
Abstract
We study the effects on results of participants completing a survey more than once, a phenomenon known as farming. Using data from a real social science study as a baseline, three strategies that participants might use to farm are studied by Monte Carlo simulation. Findings show that farming influences survey results and can cause both statistical hypotheses testing Type I (false positive) and Type II (false negative) errors in unpredictable ways.
Introduction
The convenience for data collection offered by the Internet has proven attractive to researchers. Online methods allow easy access to a wide pool of potential respondents giving data collectors cost-effective global reach (Rhodes, Bowle, & Hergenrather, 2003). Web-based businesses such as SurveyMonkey allow researchers to create and distribute online questionnaires quickly and with low cost, a service that many have used (see www.surveymonkey.com/Customers.aspx and www.limesurvey.org/en/component/content/article/1-general-news/193-ask-limesurvey-which-universities-are-using-limesurvey). There is much interest from management researchers in the use of online surveys as a research method (see Simsek & Veiga, 2000) and as an object of research (see Poncheri, Lindberg, Thompson, & Surface, 2008; Thompson & Surface, 2008). Recent management papers that have used this approach to collect data include Goldfarb and Tucker (2011) and Schilke and Goerzen (2010). Recent computer science papers that have used this approach include Chang and Chin (2011), Denvira, Balmera, and Pleasencea (2011), Huang and Truong (2008), Ke and Zhang (2008), Schrammel, Köffel, and Tscheligi (2009), Wentz and Lazar (2009), and Hussain, Slany, and Holzinger (2009). Similar papers are appearing in other disciplines.
There are general questions over the accuracy of information reported in surveys (Feldman & Lynch, 1988; Schwarz, 1999); however, a specific disadvantage of the online approach is a lack of certainty about the state of respondents during data collection—whether, for instance, they are tired or inebriated, or more fundamentally whether they are who they claim to be. For example, gender swapping in online communities is not uncommon (Turkle, 1995).
This article studies the impact that repeated lying has on survey results. This impact is evaluated empirically using a series of Monte Carlo simulations. Three strategies are developed that someone might use to respond multiple times, and these are applied to a social science data set. Statistical tests are then performed to determine how results vary depending on the number of liars and the number of times they lie. We set this work in the context of online surveys, although, in fact, there is no reason why the results will not apply to any survey data collection approach.
The article proceeds as follows: The “Background” section sets the work in context, describing repeated lying—referred to as “farming”—and illustrating how and why it might occur. The “Method” section describes in general the method used to test the impact of farming, and presents the three farming strategies. The “Repeated Truth,” “Random,” and “Inlier” sections each describe in detail the method used to simulate one of the strategies and present the results. The “Conclusion” then offers a discussion of the work.
Background
Studies of lying in surveys and in online forums are not uncommon. For example Hancock, Toma, and Ellison (2007) and Ellison, Heino, and Gibbs (2006) both report studies of dating websites and find that deception is frequent, although the magnitudes are small: According to Hancock et al. (2007), two thirds of respondents lie about their weight. Several studies suggest that people will misreport facts in an online survey when they feel it is socially desirable to do so, for instance, about their smoking behavior (Means, Habina, Swan, & Jack, 1992), criminal past (Wyner, 1980), and borrowing behavior (Karlan & Zinman, 2008; Zinman, 2009). de Leeuwu (2005) finds that when the researcher is present, in person or by phone, participants tend to give more socially desirable responses. Christian, Dillman, and Smyth (2008) show that telephone respondents give significantly more positive answers than do web respondents, suggesting an advantage to online data collection in potentially overcoming this problem of respondent acquiescence.
Aside from appearing socially desirable, it does seem that lying might be more likely in online communications than other media. Naquina, Kurtzbergb, and Belkinc (2010) find that participants are more willing to lie in an email than when writing on paper, even if the task design assures participants that their lie will not be discovered. The impact of lying on survey results therefore becomes an important question.
This article is about lying multiple times, something referred to here as farming. This is defined as a participant repeatedly completing the same survey. Respondents might have any one of a number of motivations for doing this, several of which are now discussed.
The Internet offers researchers a convenient means of data collection and may in part guard against artificial socially desirable results but suffers from lower response rates than other approaches (Manfreda, Bosnjak, Berzelak, Haas, & Vehovar, 2008). This might be due to trust issues (Sax, Gilmartin, & Bryant, 2003; Vehovar, Manfreda, & Batagelj, 2001), due to difficulties in getting representative samples (Dillman, Smyth, & Christian, 2009), or because Internet access is not universal (Miller, Kobayashi, Caldwell, Thurston, & Collett, 2002). A potential solution is to offer incentives. In a meta-analysis reported by Church (1993), response rates are found to vary in line with size of cash incentive. Thomson, Paterson-Brown, Russell, McCaldin, and Russell (2004) carry out a randomized controlled trial to compare whether one big prize or many small prizes are most effective for encouraging general practitioners to complete a postal survey. They conclude that one big prize increases the response more than many small prizes, despite the lower odds of winning. Although this does not seem to translate directly online (Kaplowitz, Hadlock, & Levine, 2004), Bosnjak and Tuten (2003) find that it is still possible to incentivize online respondents. These incentives give respondents a motivation to farm. For instance Morabia and Zheng (2009) investigate the influence of entry into a raffle as an incentive for participation in an urban transportation survey. Of 3,913 eligible responses, 183 (4.7%) participants are thought to have responded twice. Importantly, for the current study, the duplicate answers were fairly consistent although not exactly the same. The authors conclude that surveys involving a raffle should expect multiple entries from the same individual.
A second and less obvious reason to farm is to influence results, which might happen during research into controversial subjects such as how cults present themselves online. An example of this sort of thing can be seen in the way some editors try to manipulate certain Wikipedia articles (Zittrain, 2009). It is also possible that a competing researcher may farm to destroy results. Cases of this are unknown, but Duffy (2010) has demonstrated that it is a real possibility.
Regardless of the motivation for farming, the intention of the farmer is to respond to a survey multiple times without being detected. Online, respondents can easily create multiple email addresses, with many people having more than one already (Viegas, Golder, & Donath, 2006). Tracking Internet protocol (IP) addresses—a unique identifier for every device, not user, connected to the Internet—will not prevent farming as many people have access to more than one web access point (coffee shop, library, home, work). Even at home, it is possible to change an IP address, sometimes by simply switching an Internet router off and on. The use of Internet cookies (files stored on a computer to track the websites it has been used to visit) can help but even that is not difficult for a determined, technical savvy farmer to overcome.
Method
We have limited behavioral data to indicate exactly how a respondent might farm. Therefore, we consider three possible farming strategies that could potentially be used, which will be introduced later in this section. A genuine social science data set (N = 526) was used as the basis for the empirical evaluation. The data are survey responses on students’ participation in e-learning and Internet use. Prior to the current study, the data were cleaned and validated, and individuals with impossible, missing, or incorrect data values were excluded. For the purposes of this study, an assumption was made that none of the genuine respondents had farmed. These 526 represent our population of study, and we sample from it and conduct tests on the samples.
This data set was chosen because the hypotheses that it was used to test represent variety in both the testing method (t test and ANOVA) and in the results achieved (three were supported and one was not). The hypotheses are listed below. They were developed from theory by the team that collected the data. The first two were tested by independent samples t tests and the second two by one-way ANOVAs:
Hypothesis 1: There is a difference between genders in the average time spent using a computer excluding Internet use
Hypothesis 2: There is a difference between genders in the average time spent using a computer for educational purposes, excluding Internet use.
Hypothesis 3: There is a difference between age groups in the average time spent using a computer excluding Internet use.
Hypothesis 4: There is a difference between age groups in the average time spent using a computer for educational purposes, excluding Internet use.
Results on the full data set of 526 respondents are presented in Table 1. The distributions of each of the four variables were positively skewed; hence, prior to carrying out parametric statistical testing, the data were first transformed using the natural logarithm function to ensure that the assumption of normality was met. Results from tests run on all 526 respondents are as follows and represent the “correct answers.” Male students used a computer excluding the Internet for all purposes longer on average than female students (p = .001). There was no significant difference in the time spent using a computer for educational purposes between the genders (p = .676). The time spent using a computer excluding the Internet differs between age groups: for all purposes, p < .001, and for educational purposes, p < .001. The summary statistics in Table 1 show that, on average, students tend to spend longer time using a computer as age increases. Those aged 16 to 20 years use a computer for all purposes significantly less than the older age groups, and those aged 25 years or over use a computer for education purposes significantly more than the two younger age groups. The three farming strategies came from discussions with colleagues about how they might farm. They were as follows:
Natural Logarithm of Hours Spent Per Week Using a Computer, Excluding Internet Use, by Full-Time Students, Excluding Internet Use (n = 526)

Independent-samples t test.
One-way ANOVA.
Repeated Truth
The first is repeatedly telling the truth. In this case, an individual gives their real data more than once. So, for example, using this strategy, a 27-year-old male would repeatedly claim to be a 27-year-old male and each time accurately report their opinions on the phenomena being researched. This was considered by colleagues to be the simplest approach to generating farmed data.
Random
The second is answering randomly. Here the 27-year-old male may or may not give his data accurately the first time, but on successive completions would randomly invent data. This was considered to be the approach that would be used by someone who did not want to give accurate data but did not want to put in effort into generating false data.
Inlier
The third technique is where the participant tries to give average responses. So here, if the 27-year-old male feels that most respondents will be 18 years old (as might be the case if for instance undergraduate students are completing the survey), he will invent data in line with this. Of course, he will not be able to accurately predict what the typical responses will be, but the point is he will try not to stand out. Another example is as follows: A man wanting to farm a survey of women might pretend to be more interested in fashion than he really is, just as a woman might feign interest in sports to fit in a survey of males. Inlier farming was suggested by colleagues as an approach that could be taken by someone who is not part of the population of interest, as a method they might use to respond but not stand out.
The basic method was as follows: New records were generated by Monte Carlo simulation using the three farming strategies. Three parameters were varied: n, the size of the sample taken from the data set of 526 respondents; a, the proportion of individuals within that sample who farmed; and b, the number of times they farmed. We examined three levels of each parameter, plus a = b = 0, giving a total combination of 30 experimental conditions. How the three levels for each parameter were chosen is now explained. A literature search was conducted in a management subdiscipline (marketing, not reported here), and the median sample size that was used in papers that used online surveys was found to be 210. We used this as our mid level for n. For comparison, we also analyzed data sets of size n = 100 and n = 500. For a and b, a study by Morabia and Zheng (2009) suggests that the proportion of duplicate entries may be around 5%, but it is unknown how this is split across (a) the proportion of individuals within that sample who farmed and (b) the number of times they farmed. Therefore, we looked to known frequencies of plagiarism in students’ coursework (Scanlon & Neuman, 2002) as a guide to set a. We chose this domain as there are data available on it, and although it is some distance from farming, it does intuitively seem to be of a similar nature. Scanlon and Neuman (2002) present self-reports from students, and based on these, we set a to be 5% and 10%. For the third level, we set a low value of a = 1%. For b, we used absolute values of 1, 5, and 10 repetitions. We have no data to support these, and they must therefore be considered speculative.
The approach taken to the simulations varies slightly for each of the farming strategies, so in the sections that follow, the specific approach is presented, followed immediately by the results.
Repeated Truth
To illustrate this farming strategy, consider the second row of Table 2. This table shows the combinations of n, a, and b used in the simulations to give the 30 experimental conditions. Row 2 shows values of 1 for both a and b, so for the n = 100 condition (which is the third column), a sample of 100 was drawn from the population of 526, and then 1% of the sample (which is one person) was simulated to have farmed once giving a total sample size of 101. For the first simulation (Row 1), a random 100 records were chosen with replacement from the full data set. The statistical tests were run on this clean data. Then one of the records was randomly chosen and copied to create a farmed sample of n = 101 (Row 2). The statistical tests were run with the farmed sample. This was repeated 10,000 times, each time taking a fresh sample of n = 100. Then, the same thing was done for the other parameter values of n, a, and b.
The 30 Experimental Conditions With 10 Combinations of a and b, and Three Initial Sample Sizes: 100, 210, and 500.

Repeated Truth Results
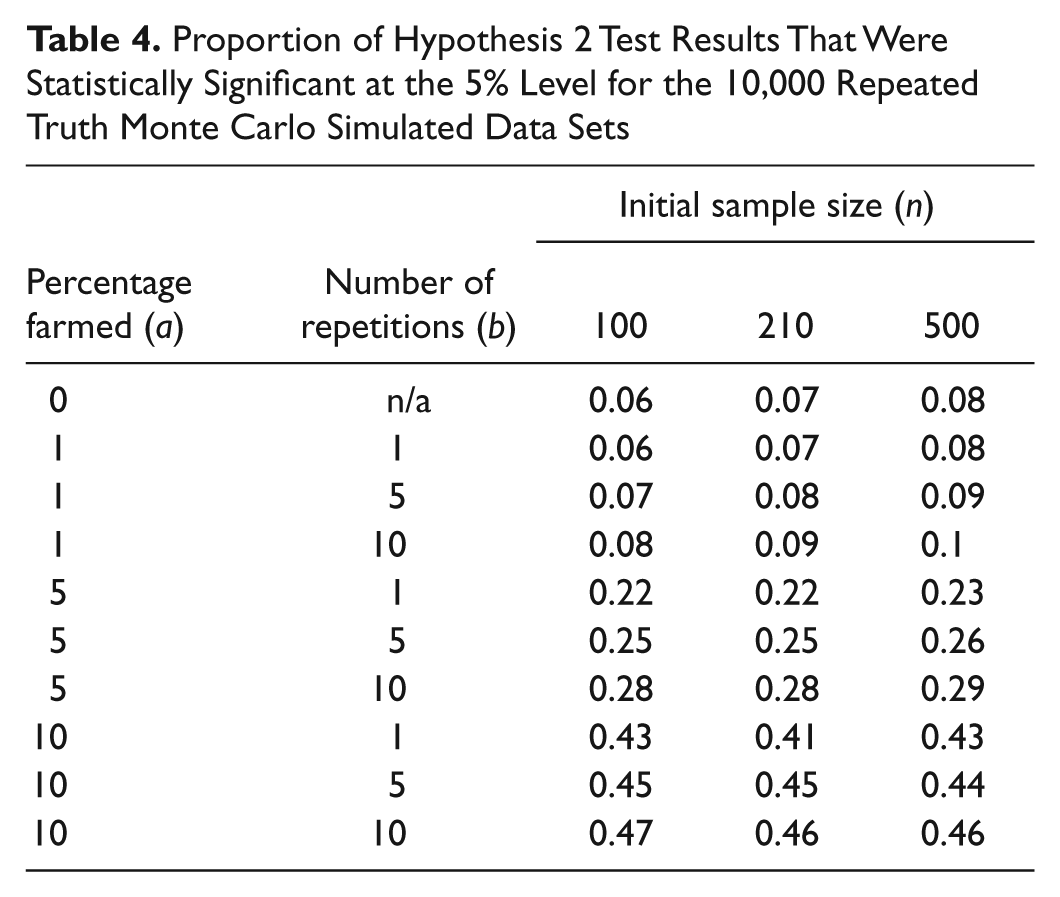
Tables 3 to 6 present the proportion of results that were statistically significant at the 5% level for each hypothesis under the repeated truth farming strategy. For Hypotheses 1, 3, and 4, the test results, based on the complete sample of 526 respondents, lead to the null hypothesis being rejected. For sample sizes of n = 100 and n = 210, the proportions of significant test results increase slightly as the levels of farming increase. However, for the larger sample size of n = 500, the proportions of significant results decrease slightly as the levels of farming increase.
Proportion of Hypothesis 1 Test Results That Were Statistically Significant at the 5% Level for the 10,000 Repeated Truth Monte Carlo Simulated Data Sets

Proportion of Hypothesis 2 Test Results That Were Statistically Significant at the 5% Level for the 10,000 Repeated Truth Monte Carlo Simulated Data Sets
Proportion of Hypothesis 3 Test Results That Were Statistically Significant at the 5% Level for the 10,000 Repeated Truth Monte Carlo Simulated Data Sets

Proportion of Hypothesis 4 Test Results That Were Statistically Significant at the 5% Level for the 10,000 Repeated Truth Monte Carlo Simulated Data Sets

For Hypothesis 2 (Table 5), where the observed test result based on the complete sample of 526 respondents is not to reject the null hypothesis, the simulation results demonstrate that the presence of repeated truth farming tends to increase the likelihood of a Type 1 error.
Random
The procedure here was similar to our strategy for repeated truth with the difference that instead of making a straight copy of a record b times, for each farmed response, we randomly generated data between the minimum and maximum legitimate value of each field using a uniform distribution, such that each possible category or value within a particular variable had an equal probability of selection. For gender, we randomly selected male or female; for age, we randomly generated an age between 16 and 70; and for hours spent using the computer, we randomly selected a number between 0 and 105 (the assumed maximum number of hours possible per day for a week). For hours spent using a computer for education, we subtracted a random number between zero and the number generated for total time spent using a computer, from the number generated for total time spent using a computer. 1 In the original analysis of the data set, age was split into three age groups (16-20, 21-24, and 25+). The randomly generated age was recoded into these same groups. 2 Notice that given the three levels of a and b, three of our conditions produce the same amount of random data (a = 5, b = 1, and b = 1, a = 5, for instance). In these cases, we report both.
Random Results
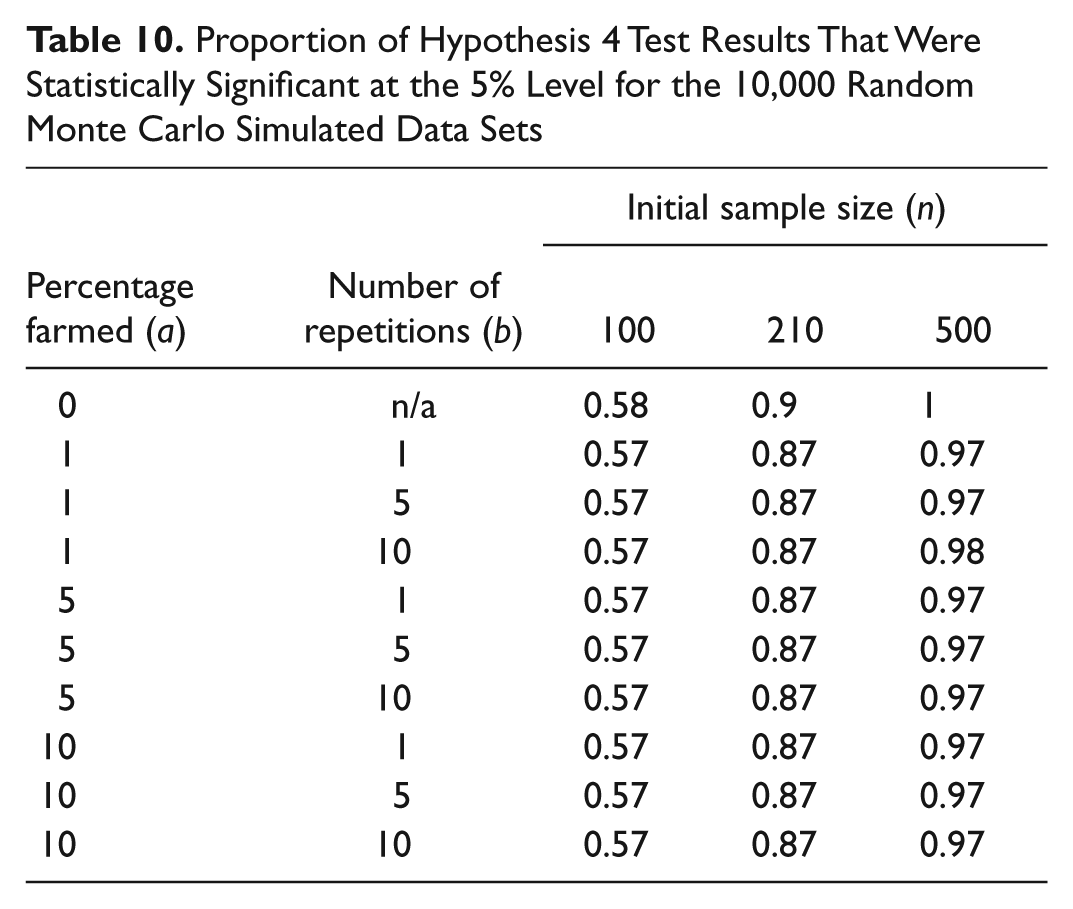
Tables 7 to 10 present the proportion of results that were statistically significant at the 5% level for each hypothesis under the random farming strategy. The larger the sample size, the higher the proportion of statistically significant results, although the increase is less dramatic for the Hypothesis 2 results. For any particular sample size, there is less variability in the proportion of significant results than the repeated truth results, and increased farming does not appear to have much effect on the results.
Proportion of Hypothesis 1 Test Results That Were Statistically Significant at the 5% Level for the 10,000 Random Monte Carlo Simulated Data Sets

Proportion of Hypothesis 2 Test Results That Were Statistically Significant at the 5% Level for the 10,000 Random Monte Carlo Simulated Data Sets

Proportion of Hypothesis 3 Test Results That Were Statistically Significant at the 5% Level for the 10,000 Random Monte Carlo Simulated Data Sets

Proportion of Hypothesis 4 Test Results That Were Statistically Significant at the 5% Level for the 10,000 Random Monte Carlo Simulated Data Sets
Inlier
The same basic procedure as in the previous simulations was used. This time, to produce the inlier farmed records, we used a convenience sample of 38 university students and staff. Each respondent was shown the instructions of the original survey and was asked to guess what he or she thought the average survey response for each of the four variables would be (with age group replaced by age). We used these responses as indications of how people would behave when attempting to farm by giving an average response, and inlier records were generated according to the observed probability distributions. The responses from the 38 individuals were used to calculate the probability of someone guessing male; this probability was .216. Hence, a Bernoulli distribution with a probability of .216 was used to generate each farmed case of gender. For respondent age and the two measures of hours using a computer, we used a normal distribution with mean and standard deviation set according to the survey responses. The distribution used to generate the farmed results was N(20.8, 2.22) for age, N(13.6, 8.72) for the average time spent using a computer excluding Internet use, and N(9.2, 5.72) for the average time spent using a computer for education purposes only, excluding Internet use.
Inlier Results
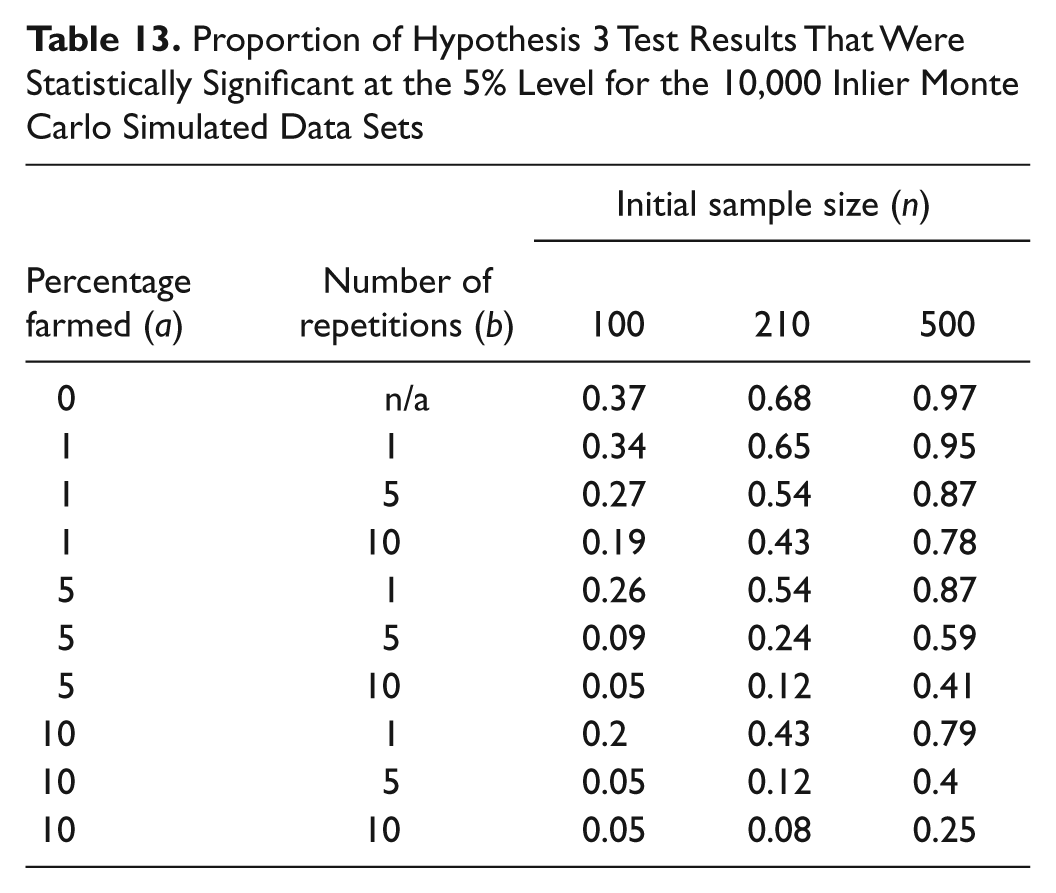
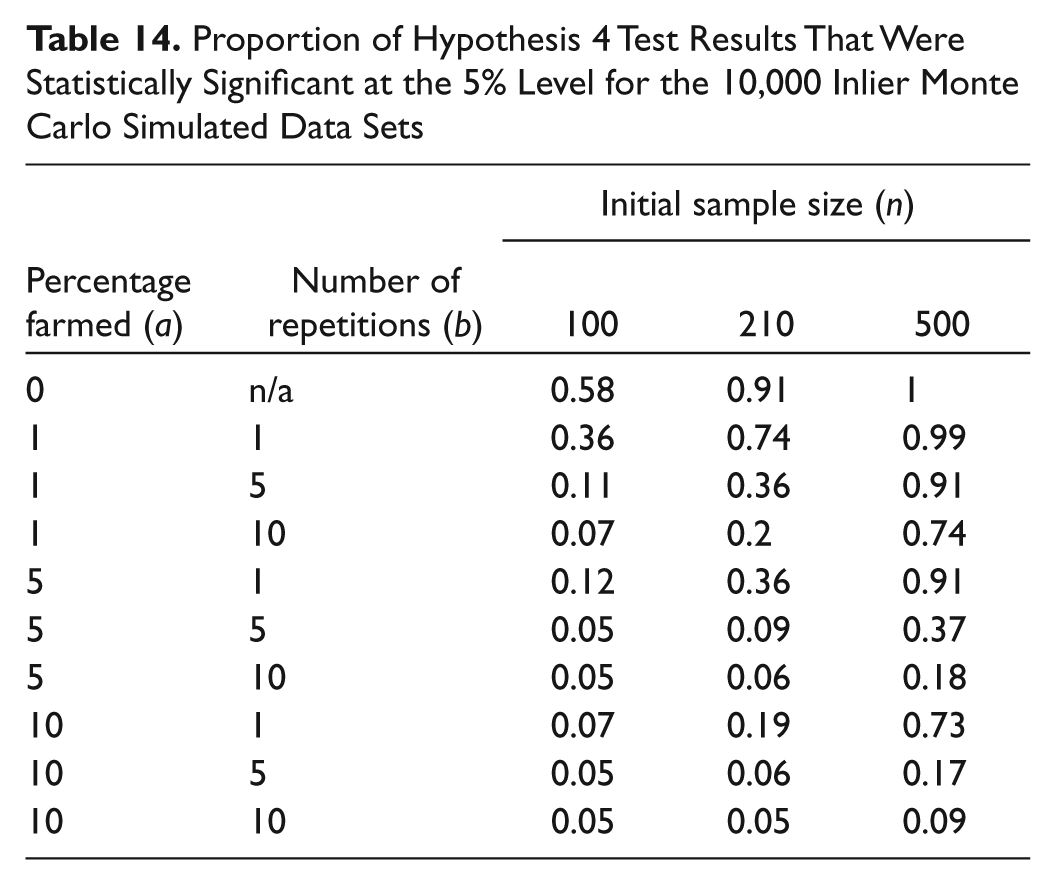
Tables 11 to 14 present the proportion of results that were statistically significant at the 5% level for each hypothesis under the inlier farming strategy. As the levels of farming increases, there are dramatic changes in the proportion of statistically significant results. For Hypotheses 1, 3, and 4, the proportions of significant results decrease as farming increases; however, for Hypothesis 2, the proportion of statistically significant results increases.
Proportion of Hypothesis 1 Test Results That Were Statistically Significant at the 5% Level for the 10,000 Inlier Monte Carlo Simulated Data Sets

Proportion of Hypothesis 2 Test Results That Were Statistically Significant at the 5% Level for the 10,000 Inlier Monte Carlo Simulated Data Sets

Proportion of Hypothesis 3 Test Results That Were Statistically Significant at the 5% Level for the 10,000 Inlier Monte Carlo Simulated Data Sets
Proportion of Hypothesis 4 Test Results That Were Statistically Significant at the 5% Level for the 10,000 Inlier Monte Carlo Simulated Data Sets
Conclusion
This section now presents a summary and explanation of the results, and discusses the work.
Summary of Results
The results presented in this article show that the effects on statistical test results depend on which hypothesis is being tested, the sample size, and the method of farming. Our main result is that farming affects results in ways that cannot be predicted. Morabia and Zheng (2009) and Steele, Schwendig, and Kilpatrick (1992) suggest that research results will not be distorted if less than 5% of the sample respond twice, and on the whole, our data support this.
In general, as the sample size increases, the proportion of statistically significant results for unfarmed samples increases, albeit less dramatically for the Hypothesis 2 results. This increase is not surprising as an increased sample size will lead to more statistical power, and hence the likelihood of a Type II error is decreased.
For the repeated truth results, the proportion of significant test results decreases slightly as farming increases for the larger sample size of n = 500 for Hypothesis 1, 3, and 4, compared with dramatic increases in the proportions for the smaller samples of 100 and 210 (Tables 3, 5, and 6).
For the random farming method (Tables 7-10), there is less variability in the proportion of significant results for three of the hypotheses. However, for Hypothesis 4 (Table 10), increased farming by the random method tends to lead to a decrease in the proportion of significant results for samples of size 210 and 500, thereby showing an increase in Type II error.
For the inlier farming results, the proportions of significant results for Hypotheses 1, 3, and 4 (Tables 11, 13, and 14) decrease dramatically as the levels of farming increase; however, for Hypothesis 2 (Table 12), the proportion of significant results increase in line with an increase in farming.
Possible Explanation
The repeated truth method of farming may lead to a reduction in variability in the farmed data set, since repeated responses are added during the farming process. This would lead to an artificial increase in statistical power compared with the unfarmed data, thereby increasing the likelihood of a Type I error. However, these results do not hold for samples of size n = 500, where the proportions of statistically significant results decrease slightly with increased farming.
The random farming method should preserve the variability in each of the four individual variables; however, the covariance structure between the four variables will not be retained since the variables were randomly generated independently of each other to create the farmed cases. This most likely explains the reduction in the proportion of significant results in the larger sample sizes, as the trend in the number of hours spent using a computer according to gender and age group will not be retained in the farmed data sets. Even in the smallest sample sizes where there is little difference in the proportion of significant results, the trend is there but is not so pronounced. Although the inlier farming results will lead to a reduction in the variability of each of the four variables, again the covariance structure between the farmed cases will not be retained, which explains the reduction in the proportions of significant results for Hypotheses 1, 3, and 4. Hypothesis 2 results show, however, a slight increase in Type I error.
Discussion
If we reconsider the two motives for farming listed at the start of the article, influencing results and repeatedly gaining an incentive, our repeated truth strategy is perhaps likely to be the one used to influence results, while the others might be used by someone wanting merely to avoid detection to gain the rewards. The repeated truth strategy tends to artificially increase the statistical power of unfarmed data, and therefore could indeed influence results, but our findings suggest that unless a high proportion of farmers exist or a high proportion of farming occurs, the impact on results is unlikely to cause much concern.
While the Internet opens opportunities for farming, it also gives researchers controls to deal with it. The best approach might be to combine real-world methods alongside online convenience. The ability to do this depends on the sampling method used, but one method is to identify individuals and assign them a unique identifier that gets submitted alongside the survey. Careful control of the identifiers should equate to careful control of farming. This would, however, not work with some sampling methods such as snowball sampling. In any case, the identifiers should be nonsequential as the use of sequential identifiers would mean they are easy for someone to guess, and this could allow farming to occur. However, if this happened, it would likely be discovered by the researcher when a genuine respondent tried to use his or her identifier that had previously been guessed by a farmer. Someone doing this could only expect to ruin data collection, not influence results or gain financially.
The three types of farming were simulated to be as realistic as possible, based on possible techniques that respondents may use in practice. In reality, some farmers may use more sophisticated techniques, and further research into the psychological reasons and strategies of farmers would be beneficial.
It would also be interesting to carry out a simulation study to explore whether any multivariate statistical techniques have the power to detect farmed cases, by flagging up any suspect cases that have an unusual or extreme covariance structure. Any useful methods could then be recommended as part of a data validity checking procedure prior to carrying out a statistical analysis of the survey data collected.
Our results demonstrate that farming in online studies is a small problem that can potentially lead to either Type I or Type II errors, which cannot be predicted. Therefore, when designing an online survey, steps should be taken to ensure that the risk of farming is kept to a minimum, to ensure that the data collected are not distorted and that the overall study results are valid and reliable.
Footnotes
Declaration of Conflicting Interests
The author(s) declared no potential conflicts of interest with respect to the research, authorship, and/or publication of this article.
Funding
The author(s) disclosed receipt of the following financial support for the research and/or authorship of this article: This work was funded in part by the Carnegie Trust for the Universities of Scotland.