
Abstract
The objective of this study was to examine the theoretical predictions of the pecking order theory and the trade-off theory to establish which of the two competing theories better explains the financing decisions of small and medium enterprises (SMEs). The study examined 187 SMEs in Ghana using the panel data methodology. The results reveal that the explanatory power of both theories apply and are pertinent to Ghanaian SMEs. The results also show that profitability, age, liquidity, growth, size, and tangibility of assets all have a significant impact on SMEs’ capital structure. In addition, the findings show that risk plays no vital role in how SMEs choose their capital structure. Broadly, the results provide evidence to back the pecking order theory, indicating that Ghanaian SMEs’ funding decisions exhibit the theoretical predictions of the pecking order theory.
Introduction
One of the essential decisions confronted by the management of firms is the capital structure decision (Degryse et al., 2012). Since the influential studies by Modigliani and Miller (1958, 1963), corporate finance has seen some noteworthy development. Theoretical advancement, particularly the development of financial theories centered on tax consideration and asymmetric information as well as, more recently, on product market, and corporate control considerations have attempted to shed some light on the funding decisions of firms, with most theoretical and empirical studies focused on large listed firms (Burgstaller & Wagner, 2015; Degryse et al., 2012; Ooi, 1999; Ramalho & Vidigal da Silva, 2009).
During the last two decades, however, an increasing number of studies (e.g., Bhaird & Lucey, 2010; Cassar & Holmes, 2003; Daskalakis et al., 2017; Hall et al., 2004; Heyman et al., 2008; Mateev et al., 2013; Michaelas et al., 1999; Serrasqueiro & Nunes, 2014; Sogorb-Mira, 2005) have extended the discussion on capital structure theories and its determinants to small and medium enterprises (SMEs). Indeed, given the critical role SMEs play in the economies around the world relating to the provision of job opportunities, wealth creation, as well as being the engine of growth in most economies (Mateev et al., 2013; Newman et al., 2013; Wu et al., 2007), the study of how these firms make their financing decisions is essential. Nonetheless, most of the existing empirical evidence is mixed and inconclusive, as well as based primarily on experiences from developed countries (Cole, 2013; Esperança et al., 2003; Hall et al., 2004; Jordan et al., 1998; Michaelas et al., 1999; Sogorb-Mira, 2005). The current literature provides little evidence on which of the theories best explains the funding behavior of SMEs in many African economies, including Ghana.
Given the variations in “institutional arrangements and financial markets” between developed and emerging nations (Abor & Biekpe, 2009), it is critical to understand which factors influence SMEs’ choice of financing source, particularly in developing economies on the African continent that has received pint-sized research interest. Past research reveals that institutional differences could contribute to differences in capital structure (see Wald, 1999). Similarly, Hall et al. (2004) have shown that there are substantial distinctions in the effects of the factors that influence financing decisions across nations. In Ghana, for instance, Abor and Biekpe (2009) posit that SMEs may display a different financing behavior with inadequate access to outside financing, thanks to the “underdeveloped nature of the financial market.”
The existing Ghanaian evidence about SMEs has primarily focused on the challenges encountered by SMEs in accessing various forms of financing (e.g., Aryeetey et al., 1994; Osei et al., 1993; Steel & Webster, 1991). To the very best of our knowledge, only Abor and Biekpe (2009) have studied the capital structure determinants of SMEs in Ghana. However, the question of which theory best expounds the financing decisions of SMEs has received no attention in the Ghanaian literature. In view of the high practical significance and a dearth of previous empirical work, this present study aims to examine and ascertain which capital structure theory’s propositions best clarify SMEs’ debt policy in an African context, specifically Ghana.
Ghana is a nation located in West Africa. Ghana has a “population of around 29.6 million (2018), a real GDP growth (annual %) rate of 3.6 as at 2016, GDP deflator (annual %) rate of 17.4 as at 2016, GDP (current US$) of 42,689,783,733 as at 2016,” and a center of commercial activities (Kosiba et al., 2018; The World Bank, 2018). We chose Ghana because it is considered as one of the promising and fast-growing economies in Africa, and thus provides an exciting milieu for the examination of finance theories, looking for new evidence and more insights on the explanatory power of these theories and SMEs’ funding choices. In Ghana, SMEs are stated to be a common feature of the production landscape. They have been noted to give about 85% of manufacturing jobs in the country, add about 70% to the country’s gross domestic product (GDP), and also represent over 90% of Ghanaian businesses (Tee et al., 2016). Again, the majority of SMEs in Ghana find it challenging to get financing, particularly long-term credits for numerous explanations, comprising the less developed nature of the long-debt market in Ghana, lack of collateral, and so on (Abor & Biekpe, 2009).
Given that a financing decision is context-dependent, we hope the outcomes of this research will complement existing studies and feed the debate by offering empirical evidence from one of the promising and essential emerging market economies. Furthermore, we believe that the results of this research will not solely fill the research gap regarding SMEs’ debt policy choices in Ghana and Africa but could also provide some useful guidance that would help policymakers to introduce strategies aimed at enhancing SMEs’ access to outside financing. For instance, it could assist governments in designing policies that address the funding needs of small businesses. The rest of this article is arranged as follows. The next section offers the theoretical review and research hypotheses, tracked by the methodology. Next follows the discussion as well as the implications for theory and practice. The final part offers conclusions, limitations, and future research.
Theoretical Review and Development of Research Hypotheses
It has been over five decades since the seminal work of Modigliani and Miller (1958, 1963) concerning the significance of capital structure. However, the simple question regarding how best firms ought to choose their capital structure remains a contentious topic. The empirical proof considering a firm’s optimum mix of financing in this period is both voluminous and mixed in the aggregate (Cole, 2013). While there is no agreement, three competing theories have been advanced as the finance profession’s explanations for the capital structure choice. They include the trade-off theory (TOT), the pecking order theory (POT), and the market-timing theory (MTT). In this article, we briefly review these three theories (see, for example, Frank & Goyal, 2008, for a detailed review).
The traditional TOT (i.e., static TOT) suggests that firms seek to attain optimum capital structure and ponder the benefits and also costs related to an added “monetary unit of debt.” Among the benefits associated with this way comprise the “tax benefits of interest payments” (DeAngelo & Masulis, 1980; Modigliani & Miller, 1963). Similarly, a decrease in the problems that emerge between the shareholders and the managers is associated with the free cash flow (Jensen, 1986; Stulz, 1990). Including the demerits related to debt, the possible “costs of financial distress” (Kim, 1978; Kraus & Litzenberger, 1973) and the agency costs occurring between owners and also financial creditors (Jensen & Meckling, 1976; Myers, 1977) stand out as the debt level rises. If an optimum capital structure is achieved, the benefits of debt funding balance debt-related costs and equilibrium are realized. According to Myers (1984), companies embracing this theory are considered as establishing a “target debt ratio” and attempt to obtain it gradually.
The next theory, which is the POT (Myers, 1984; Myers & Majluf, 1984), postulates that there is no “optimal debt-to-equity ratio.” The POT relies on the concept of asymmetric information between managers and investors that guides managers in their preference for raising finances. As stated by the POT, firms favor internally generated funds (i.e., retained earnings) when funding investment opportunities and other activities, and will only go in for outside financing if internal funds are insufficient. The real thrust of the POT is that companies will have a liking order for various sources of finance, reflecting their relative costs with the ranking being retained earnings, followed by debt and then outside equity only as a last resort.
Finally, a most recent addition to the mix is the MTT of capital structure by Baker and Wurgler (2002), which reflects how the efforts of management to “time” the issuance of equity relate to the firm’s capital structure. The MTT suggests that “firms will raise capital by issuing equity in hot equity markets but issue debt in cold equity markets.” In this sense, the ensuing capital structure of a firm is a result of when it required to raise new capital. Firms requiring capital during “hot equity markets” will have a somewhat low level of debt to equity. In contrast, firms in need of capital in “cold equity markets” will have somewhat high rates of debt to equity. As with the POT, the MTT predicts that there is no optimal debt-to-equity ratio.
For this study, we focus mainly on the TOT and the POT because SMEs are usually “privately held firms that do not issue publicly traded securities.” Thus, our empirical test will focus on the theoretical suppositions of these two theories. The TOT and POT have frequently been placed in opposition, seeking to ascertain which of them provides the best clarification in respect of how firms fund their activities. The existing literature reveals mixed and inconclusive results, as indicated earlier. Most studies corroborate the propositions of the POT and suggest that it does explain SMEs’ financing choices better than the TOT (see Berggren et al., 2000; Chittenden et al., 1996; Michaelas et al., 1999; Ou & Haynes, 2006; Ramalho & Vidigal da Silva, 2009; Sánchez-Vidal & Martin Ugedo, 2005; Sbeti & Moosa, 2012; Sogorb-Mira, 2005; Wu et al., 2008).
On the contrary, some studies (e.g., Cole, 2013; González & González, 2012; López-Gracia & Sogorb-Mira, 2008; Serrasqueiro & Nunes, 2014) maintain that both theories are not mutually exclusive. This suggests that SMEs modeling their funding choices along the propositions of one theory do not necessarily entail a remoteness from the other theory. Indeed, the findings regarding the explanatory power of both theories in the SMEs context do not appear to offer a comprehensive understanding of how capital structure choices are made (Newman et al., 2013). This, therefore, warrants the need for further empirical testing in emerging markets context, which has received little attention in the current literature to enhance our understanding of the financing behavior of small businesses.
Hypotheses derived from the POT
Profitability, according to the POT (Myers & Majluf, 1984) and Daskalakis et al. (2017), will have a negative link with leverage as very profitable firms possess the capacity to accrue earnings and are ready to finance their investment opportunities and other activities via retained earnings first, with debt financing being the second preferred choice, and new equity issues being the last favored choice. Thus, firms that can generate more profits and accumulate enough of it will borrow less, all things remaining the same (Burgstaller & Wagner, 2015; Hall et al., 2004; Psillaki & Daskalakis, 2009), signifying a negative relationship between profitability and debt. Moreover, research shows that SMEs demonstrate “control aversion,” as confirmed by a liking to sell the business instead of diluting control via new equity issue; therefore, owners choose to use funds accrued internally to fund investment opportunities (Cressy & Olofsson, 1997; Matias & Serrasqueiro, 2017). If it is not ample, they then turn to debt financing. Previous studies on SMEs also corroborate a negative connection between profitability and debt (see Cassar & Holmes, 2003; Chittenden et al., 1996; Degryse et al., 2012; Michaelas et al., 1999; Morri & Artegiani, 2015; Newman et al., 2013; Sogorb-Mira, 2005). Therefore, we posit the following hypothesis:
The age of a firm has been acknowledged as a significant factor that affects the borrowing choices of firms. The POT, in the view of La Rocca et al. (2011), is a valuable tool that can be used to analyze the financing choices of firms from the life cycle perspective. The older a firm is, the more it is capable of retaining and accumulating funds from its profits, and the less it focuses on external debt financing (Burgstaller & Wagner, 2015; Hall et al., 2004; Matias & Serrasqueiro, 2017). Thus, the POT postulates an inverse relationship between a firm’s age and debt on the assumption that mature firms, unlike new firms, have a higher ability to generate and retain profits to meet their financing needs and so the tendency to resort to outside sources of financing is low. Hence, the next hypothesis is proposed:
Regarding size, the POT predicts that somewhat bigger firms can build up internally generated funds and are accordingly less dependent on outside financing. Hence, the POT proposes a negative relation between size and debt (López-Gracia & Sogorb-Mira, 2008). Moreover, Hall et al. (2004) explain that because much of the information which small businesses make available to banks in their loan application forms will not be readily confirmable, it intensifies the “information asymmetry” difficulty they face. Given this information asymmetry challenges and transaction costs, debt financing becomes less appealing to small firms. Indeed, Ezeoha (2008) documents a negative relationship between the size of a firm and debt. However, Myers (1984) argues that bigger firm size lowers the information asymmetry challenges between executives/owners of the firm and lenders, and this enables the firm to access debt financing on more satisfactory terms, signifying the use of more debt financing. Previous studies such as Wald (1999), Deesomsak et al. (2004), and Psillaki and Daskalakis (2009) demonstrate that a firm’s size relates positively to debt, agreeing with the forecasts of the POT. Thus, according to the POT, the association between size and debt can be negative or positive, leading us to propose the following hypothesis:
Given the need to finance significant investment projects and other activities, growing firms place higher demands on retained earnings. In this sense, firms with relatively high growth will fall on external financing when internally generated funds are exhausted (Burgstaller & Wagner, 2015; Degryse et al., 2012; Matias & Serrasqueiro, 2017). Hence, the next preferred source of financing for funding growth opportunities after exhausting retained earnings is debt—less secured debt and also then long-term more secured borrowings and not new equity issues, even though growth opportunities possess higher risk than assets in place (Hall et al., 2004; Ramalho & Vidigal da Silva, 2009; Shyam-Sunder & Myers, 1999; Viviani, 2008). The implication is that firms with reasonably good growth prospects turn to borrowings when internal financing is not sufficient to meet their financing requirements. Accordingly, the POT suggests that growth opportunities will have a positive influence on firms’ borrowings. So, it is hypothesized as follows:
The tangibility of assets is anticipated to exhibit a positive connection with a firm’s indebtedness as it provides collateral. Collateral mitigates information asymmetry problems between firms’ managers-owners and lenders; hence, the POT suggests a positive link between asset tangibility and debt (Matias & Serrasqueiro, 2017; Newman et al., 2013; Pandey & Chotigeat, 2004; Vo, 2017). In particular, the information asymmetry argument is critical for SMEs, as they are more opaque than large firms. Small businesses every so often do not issue traded securities or have to provide (audited) financial statements. For these reasons, “collateralized lending” is critical for SMEs (Degryse et al., 2012). In line with the theory’s propositions, Sogorb-Mira (2005) and Degryse et al. (2012) show that tangibility of assets relates positively to debt. Hence, we postulate the following hypothesis;
Liquidity will be inversely linked to debt, according to the POT. It contends that firms will make use of their liquid assets first before they go in for new debt financing to meet their financing needs. Deesomsak et al. (2004), Sbeiti (2010), and Mota and Moreira (2017) show that liquidity has a negative effect on the borrowing decisions of firms, suggesting that firms with excess liquidity usually avoid using more new external financing, particularly debt. Thus, we have the following hypothesis:
Risky firms tend to have unsteady “cash flows” and high “costs of financial distress” and, accordingly, are expected to employ less debt. Nevertheless, the POT has an opposing view and expects higher debt levels for such firms. It assumes that these firms will utilize more debt as they are more likely to suffer from information asymmetries and are likely to have higher levels of debt. For these firms, using debt beneficially leads to somewhat higher debt levels (Chang et al., 2014; Chen et al., 2014; Hang et al., 2018). In a small firm context, Michaelas et al. (1999) explain that the “moral hazard” problem dwarfs the increased chance of bankruptcy. It follows that agency costs are lower in riskier firms as a result of the lower underinvestment problems, permitting such businesses to bank on higher debt. Previous research agrees with the forecasts of the POT (Jordan et al., 1998; Michaelas et al., 1999). Besides, Esperança et al. (2003) reveal that risk has a positive connection with short-term and long-term debt. Therefore, we suggest the following hypothesis:
Hypotheses derived from the TOT
Consistent with the tax shield proposition derived from Modigliani and Miller (1963), firms with high profits borrow more debt to gain tax benefits. In this sense, it is argued that highly profitable companies can take on more borrowings to finance their operations, thereby taking advantage of debt tax shields (Chen et al., 2014; Fama & French, 2002; Öztekin, 2015). Also, most profitable firms tend to be more attractive to suppliers of funds and are more likely to attract external debt financing compared with unprofitable firms (Ooi, 1999). Moreover, DeAngelo and Masulis (1980) explain that without non-debt tax shields, more profitable companies can benefit from their superior profitability by making use of more debt and accordingly get more debt tax shields. Hence, a positive correlation is anticipated between profitability and debt of SMEs, leading us to posit the following hypothesis:
A regards age, Abor and Biekpe (2009) argue that mature firms may have more experience and better reputation compared with young firms, placing them in a better position to find favorable terms when they seek debt financing. Similarly, mature firms are perceived to be higher quality firms with an excellent reputation, which lessens the agency drawbacks they face (Petersen & Rajan, 1994). What is more, Ramalho and Vidigal da Silva (2009) and Burgstaller and Wagner (2015) maintain that the longer the firms’ existence in business, the higher the right name they may have built over the years which has the propensity to lower their cost of borrowing as providers of debt capital believe that they can meet their debt obligations when due for settlement. Based on these arguments, older and more experienced firms with more considerable reputations are expected to utilize more debt to fund their investments and other business activities, and consequently have higher debt levels as proposed by the TOT. Thus, we propose the following hypothesis;
In line with the TOT, relatively big firms are anticipated to have a higher borrowing capacity and, thus, can have more debt financing in their capital structure. Large firms are more likely to be diversified and so will experience low volatility in profits; hence, they are less exposed to possible “financial distress costs and bankruptcy” (Matias & Serrasqueiro, 2017). Similarly, they may be capable of decreasing transaction costs related to debt financing, particularly long-term debt (Ang et al., 1982; Daskalakis et al., 2017; Morri & Parri, 2017). Consequently, the TOT maintains that the likely financial distress costs are less for big firms and would make use of more debt financing. So, we hypothesize the following:
The TOT supposes that companies with high growth opportunities might face higher costs of financial distress and hence prefer equity financing. While employing more debt increases the benefits of tax shields that a firm could enjoy, it also increases the likelihood of the firm going bankrupt, which may cause future growth opportunities to fall (Cole, 2013; Daskalakis et al., 2017; Morri & Artegiani, 2015). Thus, businesses are more unwilling to utilize debt in order not to get their future growth reduced. According to Myers (1984), expected agency and bankruptcy costs are higher for companies with high growth opportunities. So firms may be hesitant to employ high extent of debt in order not to surge their possibility of bankruptcy. Therefore, debt financing may not be the first option for companies with high growth opportunities, suggesting a negative relationship between a firm’s growth opportunities and debt. Hence, we postulate the following hypothesis:
TOT predicts that the tangibility of a business’s assets will have a positive influence on its borrowing choices. It suggests that tangible assets can be pledged or act as collateral, which offers security to lenders in the event of financial distress and eventual bankruptcy (Cole, 2013; Harris & Raviv, 1990; Harrison et al., 2011; Morri & Parri, 2017). Also, fixed assets acting as collateral will be accepted by lenders as this protects them from the moral hazard drawback triggered by owner–lender conflicts (Degryse et al., 2012; Pandey & Chotigeat, 2004). Indeed, Michaelas et al. (1999) note that firms with valuable tangible assets perhaps have easier access to debt financing and may borrow more than their counterparts with low physical assets because these tangible assets offer guarantees. Thus, debt financing may be readily utilized by firms if durable assets are available to be provided as collateral. So, the following hypothesis is proposed:
Firms with higher liquidity ratios may support a somewhat higher debt level as a result of the more exceptional ability to meet short-term obligations (Ozkan, 2001; Vo, 2017). Thus, the probable “costs of financial distress are lower for firms with a higher portion of their assets invested in liquid assets as liquid assets” can be readily converted into cash (Cole, 2013). Illiquid firms face limits in attracting debt because bankruptcy costs are high. Therefore, TOT forecasts a positive association between debt and liquidity (Burgstaller & Wagner, 2015; Degryse et al., 2012). Previous SME studies document a positive link between liquidity and debt (Degryse et al., 2012; Michaelas et al., 1999). Thus, it is posited as follows:
Risk is a pertinent factor in explaining the financing behavior of firms. Firms that face higher levels of risk possess less capacity to deal with financial risks and hence borrow less (Abor & Biekpe, 2009; Daskalakis et al., 2017). By the TOT, firms will have a lower debt to equity ratio because higher volatility in profits will increase the likelihood of financial distress. Hence, an inverse correlation occurs between risk and debt financing. Also, Ang (1991) argues that small businesses are firms doing business in markets that are not very concentrated and so face high competition. Consequently, they are exposed to higher risk and higher chances of going bankrupt, making it challenging for them to gain access to debt financing. Despite the relevance of risk in expounding the borrowing decisions of firms, empirical findings do not answer the relationship predicted by the theory. While some studies find a negative correlation between risk and debt (Morri & Parri, 2017; Psillaki & Daskalakis, 2009; Sogorb-Mira, 2005), others document a positive link (Jordan et al., 1998; Michaelas et al., 1999). Thus, the following hypothesis is suggested:
Method
Data
The testing of which capital structure theory’s suppositions (TOT vs. POT) better explains the capital structure decisions of firms was examined for a sample of SMEs in Ghana. The sample frame used for this study comprises SMEs that are registered with the National Board for Small Scale Industries and the Association of Ghana Industries. An SME is defined based on the criteria used by the Venture Capital Trust Fund Act, 2004, in Ghana. The Act defines an SME “as an industry, project, undertaken or economic activity which hires not more than 100 workers and with total asset base not exceeding the cedi equivalent of $1 million in value, excluding land and building.” All financial firms were omitted because of their specific nature and financial behavior. For instance, they are regulated differently concerning capital adequacy needs compared with nonfinancial firms. Nonfinancial information including the age of firms and the number of employees were gathered directly from the businesses involved in the study. The final sample used comprises a balanced panel of 187 SMEs for the period 2008 to 2013.
Variables
The variables utilized in this study and their respective definitions are mainly based on previous works, for example, Cassar and Holmes (2003), Hall et al. (2004), Abor and Biekpe (2009), Serrasqueiro and Nunes (2012), Newman et al. (2013), Cole (2013), Serrasqueiro and Nunes (2014), Matias and Serrasqueiro (2017), and Daskalakis et al. (2017), among others. They comprise profitability, age of the firm, size, tangibility of assets, growth opportunities, liquidity, and risk. These variables are employed as independent variables and are all based on book value for the shares of the SMEs considered in the study are not publicly traded. The use of book value is consistent with Myers’s (1984) suggestion that book values are stand-ins for the value of assets in existence. The study employs one dependent variable; which is the total amount of debt and is specified as “the ratio of total debt to total assets.” All the variables and their respective codes and measures as applied in this study are shown in Table 1.
Variables, Measures, and Expected Sign.

Note. POT = pecking order theory; TOT = trade-off theory.
Regression Model
This study utilizes the balanced panel data method because the sample includes data across firms and over time. Panel data upturn the sample size significantly and are more fitting to examine the dynamics of change. The panel data method employs a set of data that follows a given sample over a period, offering multiple observations for every variable in the sample (Hsiao, 2003). This approach expands the quantity of data as a result of the cross between longitudinal and time-series study techniques. This enlarges the “degrees of freedom” and reduces the “collinearity” between independent variables, which produce a better efficiency of the econometric estimation.
Panel data can be estimated through three different regression models, namely, pooled ordinary least squares (POLS), fixed effects model (FEM), and random effects model (REM). Employing the Wald, Breusch–Pagan, and Hausman tests, the most appropriate regression technique is selected. First, comparing between POLS and FEM, the Wald test states the null hypothesis of the constant terms being all equal. The efficient estimator is the POLS model under the null hypothesis, denoting the nonexistence of a specific effect for each one of the firms. Next, the Breusch–Pagan test compares between POLS and REM, where the rejection of the null hypothesis shows that REM is more appropriate. Finally, the Hausman test compares REM with FEM, where under the null hypothesis, the efficient estimator is the REM. If the null hypothesis is rejected, then the FEM is more appropriate, as the REM would yield biased results. To examine our hypotheses, the following regression is defined:

where i signifies an individual firm, t denotes the period, Yi, t expresses the dependent variable in the model for the ith firm in year t, α is the constant, β indicates the coefficients to estimate, Xi, t represents the independent variables in the estimation model for the ith firm in year t, and ε i,t is the error describing the nonexplained effects on Yi, t .
First, all the independent variables were included; however, after selecting the most suitable model, the regression was done again with simply the variables that exhibited statistical significance.
Results
Descriptive Statistics and Correlation Analysis
Table 2 gives a summary of the descriptive statistics of the variables considered in this study. As reported in Table 2, the average debt of the SMEs studied is 0.4342. This indicates that the SMEs financed their assets using about 43.42% debt financing and 56.58% form equity financing. Furthermore, the correlation coefficients between the variables are found in Table 3. When the correlation coefficients between the explanatory variables are more than 50%, the concern about collinearity turns out to be significant (Gujarati & Porter, 2010). However, the results from the correlation matrix (see Table 3) generally demonstrate that the coefficients between the explanatory variables are reasonably small and not above 50%, indicating that they are not amply significant to cause multicollinearity issues in the regression.
Descriptive Statistics.
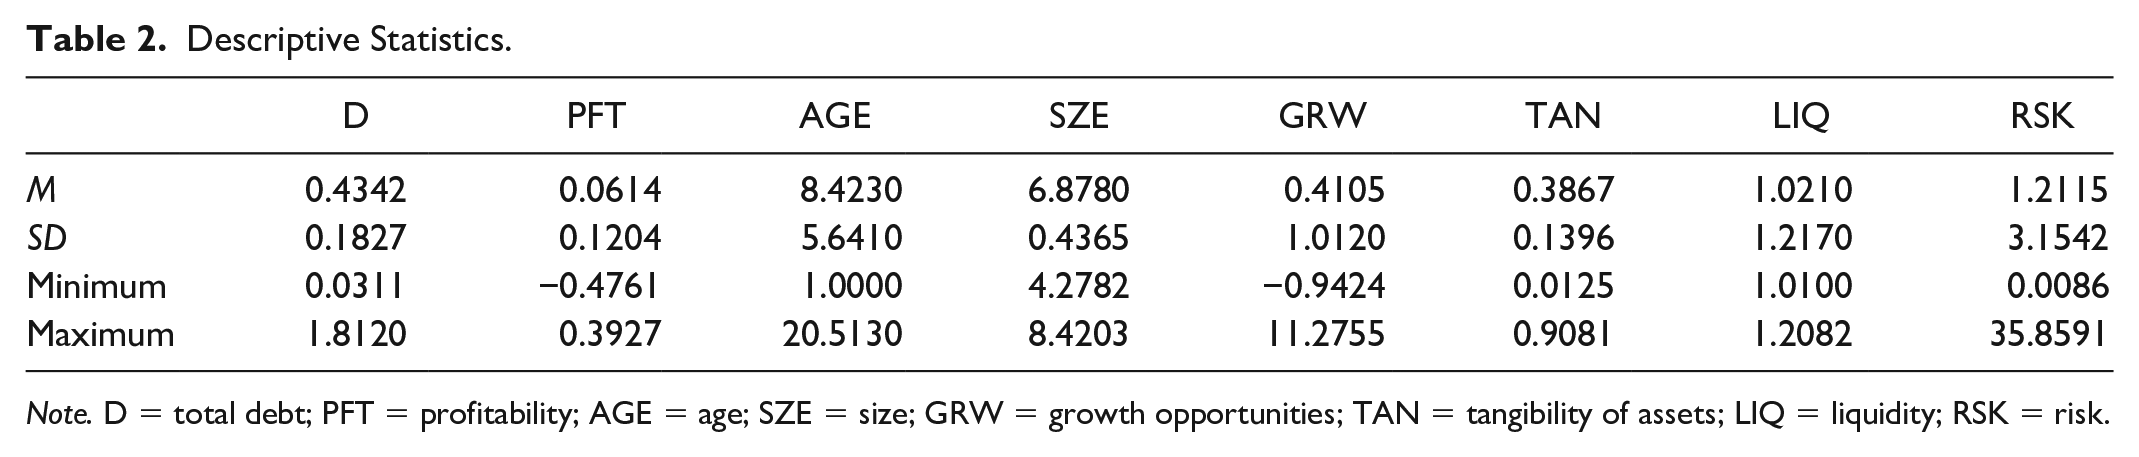
Note. D = total debt; PFT = profitability; AGE = age; SZE = size; GRW = growth opportunities; TAN = tangibility of assets; LIQ = liquidity; RSK = risk.
Correlation Matrix.

Note. D = total debt; PFT = profitability; AGE = age; SZE = size; GRW = growth opportunities; TAN = tangibility of assets; LIQ = liquidity; RSK = risk.
Significant at 10%. **Significant at 5%. ***Significant at 1%.
Regression Results
The regression results obtained in this study for all the three models applied and the different tests to select the suitable model are reported in Table 4. Based on the Wald and Breusch–Pagan tests, the POLS model is rejected, and consistent with the Hausman test, REM is rejected, signifying that FEM is more efficient. As the tests show the FEM model results have better explanatory power compared with POLS or REM results, the FEM is estimated again but with only the variables that exhibited statistical significance in the prior estimation (see Table 5). From the FEM results shown in Table 5, we can conclude that profitability, age, and liquidity are significant and negatively linked to debt. Furthermore, the link between debt and firm size, growth opportunities, and tangibility of assets is positive and significant. However, the connection between risk and debt is found to be insignificant.
Regression Model.

Note. POLS = pooled ordinary least squares; FEM = fixed effects model; REM = random effects model; PFT = profitability; AGE = age; SZE = size; GRW = growth opportunities; TAN = tangibility of assets; LIQ = liquidity; RSK = risk.
Significant at 10%. **Significant at 5%. ***Significant at 1%.
Regression Model—FEM.
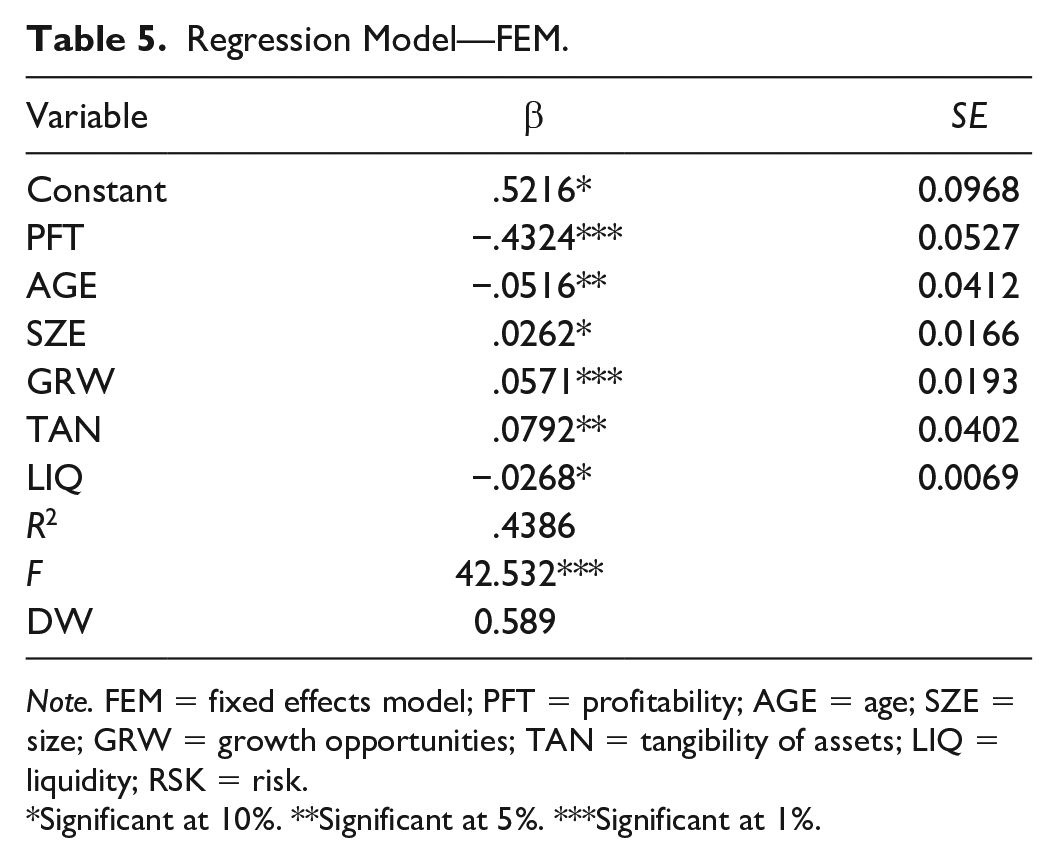
Note. FEM = fixed effects model; PFT = profitability; AGE = age; SZE = size; GRW = growth opportunities; TAN = tangibility of assets; LIQ = liquidity; RSK = risk.
Significant at 10%. **Significant at 5%. ***Significant at 1%.
Discussion
Profitability, as shown in Table 5, is significant and negatively linked to debt in Ghanaian SMEs, providing backing for the POT. This result indicates that debt levels are reduced if a company creates profits. Thus, managers or owners of more profitable SMEs prefer to first fund their assets internally via retained earnings, followed by outside financing, particularly debt if more funding is still required. The most probable reason is that they prefer to “stay in control” and prevent debt as much as possible (Degryse et al., 2012; Vos et al., 2007). This finding suggests that the agency problem of free cash flow is absent in SMEs, considering that they do not have “public equity,” and ownership is typically concentrated. Thus, the result agrees with H1 but rejects H8. This study’s result agrees with Karadeniz et al. (2009) and Serrasqueiro and Nunes (2014) in the hotel sectors in Portugal and Turkey, respectively. It also supports other studies, including Cassar and Holmes (2003), Sogorb-Mira (2005), La Rocca et al. (2011), Degryse et al. (2012), Cole (2013), Palacín-Sánchez and Ramírez-Herrera (2013), Morri and Artegiani (2015), Burgstaller and Wagner (2015), and Matias and Serrasqueiro (2017). Nonetheless, it does not support the point of view of other studies (e.g., Bhaird & Lucey, 2010; Jang et al., 2008).
Also, the negative relationship observed between age and debt suggests that more mature SMEs in Ghana, unlike new ones, have a superior ability to generate and retain profits to meet their funding needs and so the inclination to resort to outside sources of financing is low. The results obtained in this Ghanaian study provide evidence to validate H2, which was formulated based on the assumptions of the POT, but invalidate H9 derived in line with the TOT’s forecasts. Prior studies by Michaelas et al. (1999), Psillaki and Daskalakis (2009), Bhaird and Lucey (2010), La Rocca et al. (2011), Cole (2013), Forte et al. (2013), and Matias and Serrasqueiro (2017) also found similar results, indicating that age of a firm negatively influences debt.
Furthermore, the results disclose a positive and statistically noteworthy relationship between size and debt. Thus, the larger the business, the higher the debt level it can achieve and maintain, offering some suggestions for the higher financial barriers faced by smaller businesses (Michaelas et al., 1999). In other words, relatively larger SMEs in Ghana are capable of attracting more debt financing. This agrees with Serrasqueiro and Nunes’s (2014) argument that greater size of SME hotels can contribute to less volatility in operational outcomes and less likelihood of bankruptcy, hence the rise in recourse to debt. Small businesses, on the contrary, “have difficulty attracting long-term debt because of the severe information asymmetry problems between owner-managers of small businesses and potential lenders.” Likewise, long-term debt financing is likely to be proportionally more costly for small companies as a result of the “fixed transaction cost.” The information asymmetries and transaction cost arguments thus limit the bait of debt, especially long-term debt (Abor & Biekpe, 2009). Accordingly, both H3 and H10 are accepted. The positive relation observed in this Ghanaian study corroborates other studies, including Michaelas et al. (1999), Cassar and Holmes (2003), Degryse et al. (2012), Deesomsak et al. (2004), Psillaki and Daskalakis (2009), La Rocca et al. (2011), Newman et al. (2013), Morri and Artegiani (2015), and Matias and Serrasqueiro (2017).
Concerning the relationship between growth opportunities and debt ratio, the result reveals that Ghanaian SMEs with more growth prospects employ more debt financing. This can be attributed to the fact that growth tends to put a strain on internally generated funds and drive SMEs to resort to outside funding, particularly debt, hence the significant and positive relationship between the two variables. The results provide support for the POT and confirm H4 but reject H11 formulated per the TOT. While our finding contradicts Serrasqueiro and Nunes’s (2014) study about Portuguese SME hotels, it gives support to other empirical studies (e.g., Burgstaller & Wagner, 2015; Cassar & Holmes, 2003; Degryse et al., 2012; Forte et al., 2013; La Rocca et al., 2011; Ramalho & Vidigal da Silva, 2009; Sogorb-Mira, 2005). Indeed, it is anticipated that SMEs in Ghana having high growth potentials will look for more outside funding, particularly long-term debt to fund growth, confirming the view of earlier studies (e.g., Abor & Biekpe, 2006; Aryeetey et al., 1994).
Again, the coefficient of the tangibility of assets is statistically significant and positive. Collateral is very substantial for SMEs, as it assists in overcoming informational difficulties. This result confirms prior SME hotel studies (e.g., Devesa & Esteban, 2011; Serrasqueiro & Nunes, 2014) claim that collateral is essential for these firms in acquiring favorable terms when they want to access debt financing. Given that small companies are regarded as high-risk businesses, they are typically required to offer better security when making an application for financial debt financing. Thus, a guarantee is a mode to reduce the risk of SMEs, and so these companies can utilize their collateral to bring in debt financing, particularly long-term debt (Abor & Biekpe, 2009; Degryse et al., 2012). As the assets substitution effect is a lot more considerable within small companies, the owner has greater discretion, leading to “higher monitoring costs by banks and other suppliers of debt financing.” This leads these institutions to require better collateral instead of focusing on accounting info. In Ghanaian case, Abor and Biekpe (2009) note that suppliers of long-term finance typically require landed property as collateral in giving credit. Our result is in agreement with the expectations of both theories, and hence H5 and H12 are accepted. This study’s outcome agrees with previous research by Chittenden et al. (1996), Cole (2013), Jordan et al. (1998), Harrison et al. (2011), Michaelas et al. (1999), Sogorb-Mira (2005), La Rocca et al. (2011), and Morri and Parri (2017).
Besides, the coefficient of the liquidity variable is statistically noteworthy and negative, indicating that it is a relevant variable in explaining the financing decision of SMEs in Ghana, allowing H6 to be accepted. However, H13 proposed based on the forecasts of the TOT is not supported. As predicted by the POT, the liquidity of SMEs affects negatively on their use of debt financing. One reason that could explain this relationship is that Ghanaian SMEs with higher liquid assets may utilize these assets to fund their investments instead of raising debt security, and accordingly use less debt capital. Our finding supports earlier studies by Ozkan (2001), Mazur (2007), Deesomsak et al. (2004), Viviani (2008), Sbeiti (2010), Cole (2013), and Mota and Moreira (2017).
Finally, the insignificant relationship between risk and debt reported in Table 4 appears to suggest that risk plays no role in the debt policy decisions of SMEs in Ghana, leading us to reject H7 and H14. This result in the Ghanaian context contradicts those found by past studies such as Serrasqueiro and Nunes (2014), Dalbor and Upneja (2004), and Elgonemy (2002). They argue that SME hotels decrease their debt levels as a result of higher risk, and thus a greater likelihood of bankruptcy. Furthermore, our result is not in agreement with other research (e.g., Burgstaller & Wagner, 2015; Forte et al., 2013; Morri & Parri, 2017; Psillaki & Daskalakis, 2009; Sogorb-Mira, 2005). However, this present result backs the one obtained by Morri and Artegiani (2015).
Table 6 shows a comparison of the expected relation by both theories and their relationships between capital structure determinants and debt and the observed associations.
Expected and Observed Relationships.

Note. POT = pecking order theory; TOT = trade-off theory; PFT = profitability; AGE = age; SZE = size; GRW = growth opportunities; TAN = tangibility of assets; LIQ = liquidity; RSK = risk.
Implications for Theory and Practice
This study makes some contributions to the existing literature. First, we have provided new evidence on the topic and established that the financing behavior of SMEs is closer to the predictions of the POT in an emerging economy context. This current Ghanaian study extends and deepens our knowledge of SMEs’ financing choices and complements the existing empirical evidence, which is above all dominated by research results derived from the experiences of the United States, Spain, Portugal, the United Kingdom, and other developed economies around the globe. Second, the issue of capital structure is a pertinent strategic financing choice that small businesses need to make (Abor & Biekpe, 2009). Hence, our results have offered some insights that can drive the financing decisions of SMEs because this category of firms contributes significantly to the GDP of many countries. Third, the findings of this study may lead to further examination or reexamination of this subject.
From a managerial viewpoint, the study’s findings offer valuable guidance to policymakers in Ghana and other developing countries. First, the government could put in place favorable measures to assist SMEs to get access to debt funding from the banking sector to support and expand their activities in cases where their internal funds are insufficient to make them remain relevant to the economy and also to stay competitive. Besides, the government and all other donor funding organizations could think about developing a long-lasting ingenious financial package for SMEs in Ghana (Abor & Biekpe, 2009). Likewise, policymakers might also consider introducing stricter reporting requirements for SMEs. In this way, the “asymmetric information” problems between SMEs and prospective financiers could be reduced and enhance access to financing. This, in turn, would also enable financial institutions to minimize their dependence on asset-based loaning practices and focus instead on methods such as financial statement lending (Bhaird & Lucey, 2010). Again, given that tangibility of assets and size are very critical to obtaining debt financing, assistance from the government could be especially pertinent to SMEs lacking collateral and reduced capacity to access debt financing (Serrasqueiro & Nunes, 2014).
Similarly, the undeveloped nature of the financial markets in Ghana possibly makes it extra challenging for SMEs to access outside financing compared with larger firms (Abor & Biekpe, 2009). For that reason, the government needs to institute strategies targeted at developing the long-term capital market in Ghana to improve access to financing. Finally, owners/managers of SMEs are urged or recommended to build and strengthen their trusting relationships with bankers and other creditors to ease the information asymmetry between them that, in a way, permit more favorable credit terms for SMEs.
Conclusions, Limitations, and Future Research
The purpose of this study was to analyze the theoretical predictions of both the POT and the TOT to establish which of the two competing theories better explains the financing choices of SMEs in the African context, specifically Ghana. The results reveal that the explanatory power of both approaches is applicable and useful to Ghanaian SMEs. The results also show that profitability, age, liquidity, growth, size, and tangibility of assets all have a significant influence on SMEs’ capital structure. A further insight provided by our study is that risk plays no vital role in how SMEs choose their capital structure. Broadly, our results appear to agree with the predictions of the POT mostly. This indicates that Ghanaian SMEs utilize profits to lower their debt level, as they have a preference for internal finances over external debt funds because the “cost of external financing” is higher for the firm. This could also be explained by the difficulty in accessing funds as collateral remains a critical factor for small businesses’ access to credit in Ghana (Abor & Biekpe, 2009).
Furthermore, while the Ghanaian corporate tax rate is quite high at 25%, there exist incentives that perhaps make the debt tax shield less valuable for some firms. For example, firms operating in the manufacturing zone are allowed tax rebates, based on their location. The income tax rebate allowable to manufacturing firms operating in regional capitals other than Accra and Tema is 25% of the applicable income tax rate, whereas those in other locations other than Accra and Tema enjoy 50% of the applicable tax rate.
Thus, this lowers the tax rate and reduces the value of using debt tax shields for SMEs in the manufacturing sector.
The study has some limitations. First, the study relied on financial reports obtained from the sampled firms, and an apparent qualification of this article is the reliability and quality of the data (Barkham & Purdy, 1993; Ooi, 1999). While significant care has been taken to deal with several probable challenging areas, the outcomes have to be considered in relation to the nature of the data employed. The second limitation is that the study used only the total debt ratio as the dependent variable and did not decompose it into short-term and long-term debt ratio. Also, it was not possible to ascertain the amount of financing obtained from informal sources, including family and friends and bank borrowing due to data limitations. The features of these sources are or may not be the same, and it is desirable to know how they separately affect the financing choices of SMEs for a greater understanding.
Future research could consider how SME ownership, single or multiple, influences the financing decisions of SMEs. The purpose would be to determine whether they finance their activities differently or not, considering the differences in the ownership structure. In addition, future research could investigate the capital structure choices of family-owned and also nonfamily owned Ghanaian SMEs. The objective of this future research would be to determine the differences in their capital structure decisions and to investigate which theory influences their borrowing decisions.
Footnotes
Declaration of Conflicting Interests
The author(s) declared no potential conflicts of interest with respect to the research, authorship, and/or publication of this article.
Funding
The author(s) received no financial support for the research, authorship, and/or publication of this article.