
Abstract
This study empirically examines the impact of working capital management (WCM) on the profitability of Small and Medium Scale Enterprises (SMEs) in the context of a developing economy, Ghana. We analyzed data on 366 SMEs over a 10-year period, spanning 2007 to 2016. Generalized method of moment (GMM) estimation was employed. The results reveal a positive relationship between trade payable period and profitability. The inventory conversion period and cash conversion cycle show a negative association with profitability. The results show an inverted U-shaped relationship between trade receivables collection period and corporate profitability, an indication of an optimal trade receivables collection period that maximizes profitability. Further check suggests a deviation from the optimal trade receivables collection period significantly and negatively affects corporate profitability. The study reveals the need for firms to ensure efficient management of working capital to maximize profitability.
Introduction
The corporate management literature cites several corporate concerns that came to light after the recent global economic downturn. Critical among these are the issues of limited corporate access to long-term financing avenues, unpredictable cash flows, and increased credit risk exposure (Mielcarz et al., 2018). These issues have in no doubt revolutionized the financial management architecture of businesses worldwide. In particular, the focus on short-term financial management (hereinafter termed as working capital management [WCM]), an area that hitherto was neglected, has now become a necessity (Abuzayed, 2012; Enqvist et al., 2014; Mielcarz et al., 2018). This has been true and crucial, especially for small and medium scale enterprises (SMEs) whose survival and growth hinge largely on short-term financing models (García-Teruel & Martínez-Solano, 2010; Javid, 2014; Yazdanfar & Öhman, 2016). By their very nature, smaller firms have limited access to long-term capital (García-Teruel & Martínez-Solano, 2010; Javid, 2014; Petersen & Rajan, 1997), which makes their dependence on short-term credit such as trade credit inevitable (García-Teruel & Martínez-Solano, 2010; Yazdanfar & Öhman, 2016). Indeed, several research works reveal the sensitivity of WCM to SMEs, with overwhelming evidence highlighting poor WCM practices as a major cause of SMEs’ failure (Javid, 2014; Kosgey & Njiru, 2016). This implies that efficient WCM practices are critical for the survival of SMEs.
The general importance of WCM can be attributed to the fact that it constitutes a significant component of the firms’ assets (Aregbeyen, 2013; Raheman & Nasr, 2007); plays critical role in influencing profitability (Sharma & Kumar, 2011); and also impacts corporate risk and the overall goal of shareholder wealth maximization (Bhatia & Srivastava, 2016; Enqvist et al., 2014). One of the ultimate goals of every business organization is to maximize profitability. Nevertheless, in pursuit of this goal, adequate liquidity is needed to finance the firm’s day-to-day commitments of the firm. A crucial task for finance managers is, therefore, to strike a balance between the opposing goals of ensuring adequate liquidity while aiming at higher profitability (Akinlo, 2012). For instance, the corporate goal of maximizing profitability may create fertile ground for poor liquidity, which can consequently lead to bankruptcy. As the barometer of liquidity measure, efficient WCM thus becomes critical management issue needed to balance the trade-off between profitability and liquidity and consequently averts the tendency for corporate bankruptcy (Baños-Caballero et al., 2012; Enqvist et al., 2014). Other scholars suggest that the effectiveness of the firm’s long-term financial decisions, such as capital expansions projects, are also dependent on the effectiveness of its WCM decisions (Adam et al., 2017),
WCM measures the firm’s short-term financial health of the firm by focusing on the mixture of short-term assets and liabilities held on a day-to-day basis. Specifically, WCM seeks to settle the corporate dilemma of how much short-term assets such as inventory, receivables, and cash, or short-term commitments such as account payables a firm must hold at any particular period to maximize returns. For strategic reasons, management may pursue an aggressive policy of holding less investment in short-term assets or large volume of short-term liabilities. On the other hand, management may opt for a more liberal approach of holding a large amount of investment in working capital (Altaf & Shah, 2018; Ukaegbu, 2014). Regardless of the policy choice, there are associated costs and benefits; hence managers who are astute in choosing the optimal working capital level tend to create value for the firm (Gorondutse et al., 2017; Ukaegbu, 2014). For instance, a liberal policy of holding high volume of receivables improves sales, enhances customer relations, attracts financially constrained customers, and consequently increases profitability (Abuhommous, 2017; Ukaegbu, 2014). Holding large inventories may enable the firm to avoid stock out, ensure uninterrupted production and take advantage of quantity discounts (Baños-Caballero et al., 2012; Ching et al., 2011; Koumanakos, 2008). Holding large amount of cash may enable the firm meet day-to-day financial obligations to avoid financial distress. Finally, delaying payment to creditors or holding large amount of trade payables may provide an alternative short-term low-cost credit facility (Ferrando & Mulier, 2013; Yazdanfar & Öhman, 2016). There are, however, risks associated with such policy. For example, increasing investments in receivables may lead to higher bad debts (Cheng & Pike, 2003; Dary & James, 2019), locked up capital and higher opportunity cost (Dary & James, 2019; Martinez-Solano et al., 2013), and increased debtors administration costs (Abuhommous, 2017; Mian & Smith, 1992). Higher inventories may also increase holding cost, higher obsolescence, and frequent stock write-downs (Baños-Caballero et al., 2012; Koumanakos, 2008). Holding a large amount of cash means the firm has to forgo interest that could be earned on short-term investments. Finally, undue delay in the creditor payment period may lead to loss of cash discount and higher interest charges (Yazdanfar & Öhman, 2016). Amid these dilemmas, what really constitutes an optimal WCM policy remains an unanswered question, both in practice and literature. One approach to settling this issue has been to look at it from the perspective of which WCM policy maximizes corporate profitability.
The financial implications of corporate WCM practices have been a subject of intense academic research (Sharma & Kumar, 2011; Ukaegbu, 2014). However, research has focused largely on large firms (See Bhatia & Srivastava, 2016; Sharma & Kumar, 2011) for review] with little attention paid to SMEs (Baños-Caballero et al., 2012; Javid, 2014). In particular, financial literature that examines the effect of WCM on the profitability of SMEs in developing countries remains scarce, despite the growing importance of SMEs in such economies (Haselip et al., 2014; Padachi, 2006). Some few exceptions are the works by Stephen and Elvis (2011) and Padachi (2006) that examine the WCM-financial performance relations for SMEs in Kenya and Mauritius, respectively. Nonetheless, given the limited research and the growing recognition of a striking differences in the working capital requirements for different countries, the call for more country-specific studies has heightened in recent times (Boțoc & Anton, 2017).
This study aims to shed more light on the financial impact of WCM on SMEs in a developing economy. In pursuit of this objective, we empirically examine the impact of WCM on SMEs profitability in Ghana, a developing West African country. This study, to the best of our knowledge, offers the first evidence on the subject in the Ghanaian context, as the few published finance and management literature on WCM and corporate profitability in Ghana have focused primarily on large publicly traded firms (Adam et al., 2017; Akoto et al., 2013; Korankye & Adarquah, 2013). This work also contributes to the general literature in other important ways. First, unlike the linear relationship between WCM and corporate profitability that has been the focus of earlier studies (Bhatia & Srivastava, 2016; Sharma & Kumar, 2011), this study explores the possibility of both linear and non-linear relationship between each component of WCM and corporate profitability. Indeed, the proposition of potential non-linear relationship between each WCM component and corporate profitability has received strong theoretical justification, but has attracted limited empirical test, particularly in the context of the SME literature (Baños-Caballero et al., 2012; Martinez-Solano et al., 2013; Stephen & Elvis, 2011). Finally, as deviation from the conventional ordinary least square, fixed or random-effect models employed in the majority of the extant WCM literature, especially in the context of SMEs (Padachi, 2006; Stephen & Elvis, 2011), we follow recent trends (Abuzayed, 2012; Altaf & Shah, 2018) and employ a more robust dynamic panel regression model—the generalized method of moments (GMM). This methodology allows us to improve the reliability of estimates by controlling for the potential problem of endogeneity that is associated with the WCM-corporate profitability analyses (Korent & Orsag, 2018).
Like other developing countries, SMEs in Ghana face severe challenges in accessing finance from the traditional financial markets (Abor & Biekpe, 2006; Biney, 2018; Buatsi, 2002). This thus makes their reliance on short-term financing avenues such as trade credit inevitable for their survival. More importantly, a study on SMEs’ financial performance in Ghana assumes national relevance since SMEs have emerged as strong force in the economic growth and development of Ghana. For instance, Ghanaian SMEs contribute significantly to entrepreneurial skills development, job creation, and poverty reduction (Arthur-Aidoo et al., 2016). The available evidence also indicates that an estimated 92% of Ghanaian businesses are known to be SMEs and contribute about 70% of Ghana’s gross domestic product (Arthur-Aidoo et al., 2016).
Our results show that WCM has significant impact on the profitability of SMEs in Ghana. In specific terms, our results reveal an inverted U-shaped relationship between trade receivables period and profitability, suggesting the existence of an optimal level of trade receivables investment where profitability is maximized. A further check indicates that a deviation from the optimal trade receivables period negatively impact profitability. Both inventory conversion period (INVCP) and cash conversion cycle were negatively related to profitability. Trade payable period (TPP), however, was found to be positively related to profitability.
The rest of the study is organized as follows. Section “Literature Review and Hypotheses Development” focuses on the related literature and hypotheses development. Detailed descriptions of the research methodology are provided in section “Research Methodology.” The discussions of empirical results are provided in section “Empirical Results.” Section 5 details the research conclusions, implications, and suggestions for future research.
Literature Review and Hypotheses Development
Academics have examined the relationship between WCM and corporate profitability, both theoretically (Emery, 1984; Nadiri, 1969; Sagan, 1955; Warren & Shelton, 1971) and empirically (Bhatia & Srivastava, 2016; Enqvist et al., 2014; Ukaegbu, 2014). Within these discussions, different WCM constructs have been employed. Specific among these WCM constructs are the trade receivables collection period (TRCP), TPP, Inventory convention period, and cash conversion cycle (Bhatia & Srivastava, 2016; Enqvist et al., 2014). The following sections of this article provide detailed review of the literature on the profit implications of each component of working capital.
TRCP and Corporate Profitability
TRCP measures the number of days credit customers of the firm are made to take possession and possibly ownership of goods and services offered without payment. In effect, TRCP measures the level of investments firms make in trade receivables (Martínez-Sola et al., 2014). TRCP essentially provides a reflection of the firm’s trade credit supply policy. As a policy option, firms may either offer longer or shorter credit period; a concept technically termed as conservative or aggressive credit policies, respectively (Altaf & Shah, 2018; Ukaegbu, 2014). In examining the financial effect of TRCP, scholars have, accordingly, based their arguments on the financial benefits vis-à-vis the cost associated with each TRCP policy. On the one hand, it has been argued that offering longer TRCP enhances profitability by affording the firm the opportunity to attract customers, especially financially constrained customers (Abuhommous, 2017; Martinez-Solano et al., 2013; Nadiri, 1969). Longer TRCP helps ensure predictable and improved long-term customer relationship (Baños-Caballero et al., 2014; Cuñat, 2007; Ng et al., 1999). According to Long et al. (1993) and Ng et al. (1999), trade credit serves as a useful mechanism for reducing information asymmetry between the firm and its customers. Based on the transaction cost theory, others have indicated that firms can also benefit from reduced transaction cost and consequently increased profitability by offering trade (Dary & James, 2019; Ferris, 1981). Offering trade credit also signals product quality (Baños-Caballero et al., 2014; Lee & Stowe, 1993), compliments firm’s marketing tools (Cheng & Pike, 2003; Dary & James, 2019), and serves as useful tool for mitigating financial friction of customers (Meltzer, 1960). Authors of empirical studies, such as Sharma and Kumar (2011) and Abuhommous (2017) provide empirical evidence of a positive relationship between conservative trade credit policy and corporate profitability.
On the contrary, the literature cites several concerns associated with longer trade credit extension periods. These concerns are generally related to trade credit-induced cash flow and cost challenges that are believed to have the potential to negatively impact profitability negatively. It is, for instance, argued that trade credit extension decision may result in higher cost, arising from both real and opportunity cost (Dary & James, 2019; Nadiri, 1969). The firm’s decision to offer longer trade credit period has the potential to lock up viable resources in debtors. The locked up funds have the potential to deny the firm the opportunity of taking advantage of other viable investment projects and eventually hurts profit. By locking up capital, firms may also be compelled to resort to costly external sources of finance like loans to meet short-term liquidity demands. Extending trade credit to customers lends the firm to higher risk of payment defaults, which could lead to liquidity challenges, financial distress, and potential bankruptcy (Cheng & Pike, 2003; Dary & James, 2019). Customer credit extension can also result in high corporate debtor management expenses such as bad debts write-offs (Abuhommous, 2017; Dary & James, 2019; Mian & Smith, 1992). To buttress these claims, some empirical studies find evidence of negative impact of debtors’ management policy on corporate profitability (Bhatia & Srivastava, 2016; Deloof, 2003). For example, Bhatia and Srivastava (2016) find a negative relationship between corporate trade credit policy (measured as the number of days accounts receivable) and profitability for a sample of publicly-traded Indian firms examined over the 2000-2014 accounting period.
Recent studies make a case for a more complex or a curve-linear relationship between trade credit supply and corporate financial performance (Emery, 1984; Martinez-Solano et al., 2013; Nadiri, 1969). Central to this is the proposition that the relationship between trade credit policy and financial performance is that of an inverted U-shaped relationship (Altaf & Shah, 2018; Martinez-Solano et al., 2013). This proposition is premised on the assumption that the relationship between TRCP and financial is function of the level of trade credit offered. For example, it is argued that at lower levels of trade receivables investments, firm tend to reap more economic benefits than the cost associated with that of trade credit extension. This eventually leads to higher TRCP-induced profit at lower TRCP levels. It is, however, argued that any trade credit offered beyond the optimal level tends to generate higher costs when matched against its associated benefits. This tends to hurt overall profitability. Consequently, Altaf and Shah (2018) propose and find evidence of an inverted U-shaped relationship between TRCP and corporate profitability.
A closer look at the extant literature thus suggests both conflicting theoretical underpinnings and empirical evidence on the link between TRCP and corporate profitability. This study therefore intends to test whether TRCP strategy affects the profitability of Ghanaian SMEs, and if so, whether the relationship between TRCP and profitability is negative, positive, or that of curve linear (non-linear) one. We, therefore, propose that:
TPP and Corporate Profitability
Trade payables period measures the numbers of days the firm is allowed to postpone payment for goods or services offered by its suppliers. That the firm’s accounts payable policy affects its financial performance is an established fact, both in theory and in the empirical finance literature (Nadiri, 1969; Sharma & Kumar, 2011; Yazdanfar & Öhman, 2016). The bone of contention, however, has been the exact direction and magnitude of the effect. Several competing theoretical cost and revenue pathways have therefore been advanced to link trade payable policy to corporate financial performance (Yazdanfar & Öhman, 2016).
On the one hand, several scholars argue for positive impact of trade payables on corporate profitability. For example, it has been argued that delaying payment to creditors provides cheap alternative source of short-term finance to the firm (Biais & Gollier, 1997; Petersen & Rajan, 1997; Yazdanfar & Öhman, 2016). Thus, the delayed payment period enables the firm to invest such cash into alternative short-term viable investment avenues. This could lead to increased profitability. By decoupling the receipt of goods from payment, the firm is offered the opportunity to assess product quality (Lee & Stowe, 1993; Long et al., 1993; Yazdanfar & Öhman, 2016). Finally, increased credit transactions help to reduce uncertainty and also strengthen the relationship between the firm and its suppliers (Ng et al., 1999; Yazdanfar & Öhman, 2016). Several empirical studies find evidence of positive relationship between TPP and profitability (Bougheas et al., 2009; Makori & Jagongo, 2013).
Some researchers, on the contrary, predict a negative relationship between delayed TPP and corporate profitability. According to Cuñat (2007; Giannetti et al., 2011), delayed payment to suppliers may attract interest on overdue debts. There is also the likelihood of the firm forgoing the cost advantage that could have been enjoyed through cash discounts from early payments. Excessive delay in payment may cast doubt on the firm’s credit worthiness, which could cause the firm to lose out on favorable credit terms from both existing and potential suppliers. Empirically, Deloof (2003) finds evidence of a negative effect of accounts payable on profitability. Similar evidence of negative relationship between accounts payable and profitability are documented in other studies (García-Teruel & Martinez-Solano, 2007; Samiloglo & Dermirgunes, 2008).
As a result of the inconclusive theoretical and empirical evidence on the relationship between trade payable management and profitability, some recent studies have begun to view the TPP–profit relationship as one that depicts a curve linear relationship. Studies such as the one by Altaf and Shah (2018) proposed and found evidence of an inverted U-shaped relationship between TPP and corporate profitability. This by implication suggests the existence of an optimal level of TPP where both cost and revenue offset. Thus, firms’ profitability may increase as TPP rises to an optimal level where associated marginal revenue and cost offset and profit is maximized. However, when TPP goes beyond this optimal level, the associated costs may far outweigh its benefits, causing profitability to fall.
Drawing on the conclusions from both the theoretical and empirical research, we predict that the relationship between TPP and corporate profitability could be that of linear negative or positive as well as that of non-linear one. Consequently, we formalize our next hypothesis as:
INVCP and Corporate Profitability
Inventory management remains a critical success factor of every business organization (Mathuva, 2013). Inventory comprises the various raw materials, work in progress as well as the finished products held by the firm at any point in time (Falope & Ajilore, 2009). For the purposes of this study, the level of inventory held by a firm is measured as the number of days inventories are held until converted into sales. This is technically termed as the INVCP. INVCP specifically measures the number of days it takes to purchase raw materials, through to the number of days it takes to convert the raw materials into finished goods and eventually sell the finished products. Longer INVCP essentially signals corporate practices of holding large inventories, while shorter INVCP is a measure of less inventory holding policy. The literature outlines the cost-revenue trade-off associated with each corporate inventory management strategy, hence their impacts on corporate profitability.
Some scholars make a positive business case for holding large inventories. These include the assertion that large inventories help to avoid stocks out to ensure uninterrupted production (Baños-Caballero et al., 2012). Large inventories also help to promptly and consistently deliver on customers’ orders, which helps to improve customer relations, sales performance, and corporate profitability (Baños-Caballero et al., 2012; Gill et al., 2010; Mathuva, 2013). Moreover, firms stand to enjoy several cost advantages, such as benefiting from quantity discounts by resorting to large inventory purchase. On the contrary, there are associated costs with holding large inventories which consequently hurt profitability. First, increased inventories are associated with high storage cost. These costs come in the form of high insurance, heating, or cooling as well as personnel and other administrative costs (Baños-Caballero et al., 2012). There is also the risk of material spoilage and stocks obsolescence, leading to persistent stock write-downs. These arguments are generally in line with the concerns flagged by the Just-In-Time (JIT) inventory management theory. Explicit in the JIT theory is the argument that holding less inventories are cost-effective and profitable as large inventories add no value, but rather reduce profitability (Altaf & Shah, 2018).
Empirical studies on the relationship between inventory management have returned mixed verdicts. Majority of the studies (Akoto et al., 2013; Bhatia & Srivastava, 2016; Sharma & Kumar, 2011) show evidence of a negative relationship between INVCP and profitability, implying that a more aggressive policy of holding less inventory is financially rewarding. Other studies justify the use of liberal inventory policy by documenting a positive relationship between INVCP and corporate profitability (Mathuva, 2010). Evidence from a study by Altaf and Shah (2018) reveal an inverted U-shaped relationship between INVCP and corporate profitability. This by implication indicates the existence of an optimal INVCP that balances the costs and benefits associated with inventory management and ensure optimal profit for the firm.
Based on the discussions and the empirical evidence, we examine both linear and non-linear relationship between INVCP and profitability. Accordingly, we expect:
Cash Conversion Cycle (CCC) and Corporate Profitability
Cash conversion cycle (CCC) is a comprehensive measure of the firm’s WCM cycle. CCC is generally a reflection of the strategy adopted for each of the three components of WCM: TRCP, TPP, and INVCP. Depending on the strategy adopted for the individual components of WCM, CCC could either be that of an aggressive or conservative strategy. Aggressive CCC strategy comprises the pursuit of shorter TRCP and INVCP while relying heavily on shorter term financing from trade creditors through longer TPP. A more conservative CCC strategy, on the other hand, entails holding large volume of debtors and inventories while relying less on short credit financing. The conservative CCC strategy is basically a reflection of the use of longer TRCP and INVCP and a shorter TPP.
Some empirical studies reveal a negative relationship between CCC and profitability (Bhatia & Srivastava, 2016; Enqvist et al., 2014). These studies in effect provide strong justification for the use of an aggressive CCC strategy as means of maximizing corporate profitability. For example, it is argued that an aggressive CCC strategy helps to improve liquidity, enjoy financial flexibility, and also avoid the potential risk of cash out and its attendant problems of financial distress (Baños-Caballero et al., 2012). Advocates of a more conservative CCC strategy, on the other hand, argue that longer CCC allows the firm to increase sales, avoid stock out, and also improve customer relationships (Baños-Caballero et al., 2012, 2014). Some empirical research provide support for a positive relationship between a conservative CCC policy and profitability (Sharma & Kumar, 2011). Other studies propose and document evidence of an inverted U-shaped relationship between CCC and corporate profitability (Altaf & Shah, 2018; Baños-Caballero et al., 2012). These studies thus suggest the existence of an optimal level of CCC that maximizes corporate profitability.
Given the inconsistencies in the literature, we examine the potential linear and non-linear relationship between CCC and profitability of SMEs in Ghana. In this regard, we propose the following hypothesis:
Research Methodology
Data and Sample
The study used a sample of SMEs from the non-financial sector in Ghana. We generated the sample from the databases of the Association of Ghana Industries and the National Board for Small-Scale Industries. These databases have been used extensively for earlier studies on SMEs in Ghana (Abor, 2007; Abor & Biekpe, 2007). Though there are different criteria for selecting SMEs, we adopted the criteria set by the Regional Project on Enterprise Development for SMEs in Ghana. Under this criterion, SMEs are classified as firms with less than one-hundred (100) employees. Prior studies on SMEs in Ghana have adopted this criterion (Abor, 2007; Abor & Biekpe, 2007). Data for the study variables were drawn from the annual financial statements (i.e., Income statement and the Balance sheet) of the sample firms for a 10-year period, spanning the year 2007–2016. Our final sample comprises 366 SMEs, culminating into 3,048 unbalanced firm-year observations. The final observations were obtained after eliminating firm year observations with illogical values, such as negative asset values. The dataset was also winsorized at the 1% level to control for noise effect that may be caused by outliers (Oikonomou et al., 2012). Table 1 presents the distribution of the final sample by industry.
Sample Description Based on Industry Classification.

Variables
Dependent Variable
The main dependent variable is firms’ profitability. We use three alternative proxies to measure profitability. The first two include gross operating profit (GOP) and net operating profit (NOP). These two proxies have been used extensively in prior studies (Aregbeyen, 2013; Baños-Caballero et al., 2012). The reason for the use of GOP and NOP is driven by the fact that they provide true measure of firms’ operating activities for which WCM is a critical component (Baños-Caballero et al., 2012; Enqvist et al., 2014). The next proxy is return on assets (ROA) . ROA provides full returns on the firm’s assets. The use of ROA affords the researcher the opportunity to account for the returns and expenses associated with both financial and non-financial assets (Aregbeyen, 2013; Enqvist et al., 2014). The bases for computing GOP, NOP, and ROA are detailed in Table 2.
Variable Description.

Independent Variables
WCM measures of the firms constitute the main independent variables. In keeping with prior studies (Bhatia & Srivastava, 2016; Enqvist et al., 2014), we adopt four different components of WCM. These include trade receivable collection period (TRCP), TPP, INVCP, and the cash conversion cycle (CCC). TRCP measures the length of days granted to customers from the day of sales to payment. TPP defines the number of days the firm is allowed to take delivery of goods until payment is made. INVCP measures the number of days inventories are held by the firm until sales are made. CCC provides an aggregate measure of the firm’s WCM cycle. The definitions and computational methods used for all four WCM measures are provided in Table 2. To measure the possibility of a non-linear relationship between WCM and financial performance, we include the squared value of each of the WCM components: TRCP2, TPP2, INVCP2, and CCC2 (Altaf & Shah, 2018; Baños-Caballero et al., 2012).
Control Variables
Following earlier works (Altaf & Shah, 2018; Bhatia & Srivastava, 2016; Sharma & Kumar, 2011), we include as control variable a number of critical elements that are known to impact firm profitability. Specifically, we control for firm size, firm growth, current ratio, firm age, and financial leverage. Table 2 details the definitions and the bases of computation adopted for the selected control variables.
The estimation model
The study primarily seeks to examine the impact of WCM on the profitability of Ghanaian SMEs. We establish this relationship using a dynamic panel model as employed in related studies (Baños-Caballero et al., 2012; Korent & Orsag, 2018). Our regression models are stated as follows:

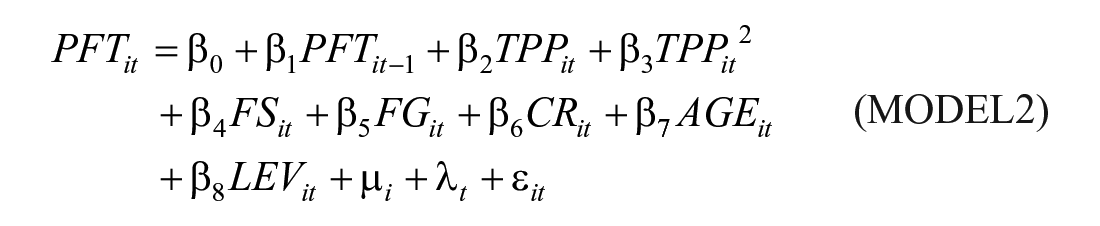


where
Empirical Results
The data analyses are presented in three forms. First is the use of descriptive statistics. The second and third involved the use of pairwise correlation and ultimately the regression estimates.
Descriptive Statistics and Correlation Results
We report the descriptive statistics for the dependent, independent, and that of the control variables in Table 3. Mean (median) GOP, NOP, and ROA over the study period are 0.247(0.406), 0.198(0.311), and 0.169(0.134), respectively. Mean (median) TRCP is 147.814 (86.880) days. The mean TRCP of 147.814 days suggests that, on the average, it takes 147.814 days for SMEs in Ghana to receive payment from their credit customers. The median TRCP of 86.880 days reveals that about half (50%) of the SMEs (sample) take about 86.880 days to receive payment for credit sales offered to customers. Mean (median) TPP is 88.206 (46.771) days suggesting that it takes SMEs an average of 88.206 days to settle their credit suppliers. Moreover, more than of the SMEs take about 46.771 days to make payments to their creditors for goods and services supplied. Mean (median) INVCP is 98.039 (64.225). Overall, the mean (median) CCC of the sample is 157.647 (100.833) days. Mean firm size (FS) is 3.150. Mean CR is 3.331 suggesting the current assets of the SMEs on average can cover their short-term liabilities over three times. Over the period, SMEs in Ghana experienced an average rate of 0.510 (51.0%) growth in sales with more than half of the SMEs experiencing 0.215 (21.5%) growth. The average year of the SMEs (sample) since registration is 22.031 years. The mean (median) Leverage is 0.031 (0.018).
Descriptive Statistics of the Sample.

Source. Authors’ computations.
Note. GOP = gross operating profit; NOP = net operating profit; ROA = returns on assets; TRCP = trade receivables collection period; TPP = trade payable period; INVCP = inventory conversion period; CCC = cash conversion cycle; FS = firm size; FG = firm growth; CR = current ratio; AGE = firm age; LEV = financial leverage.
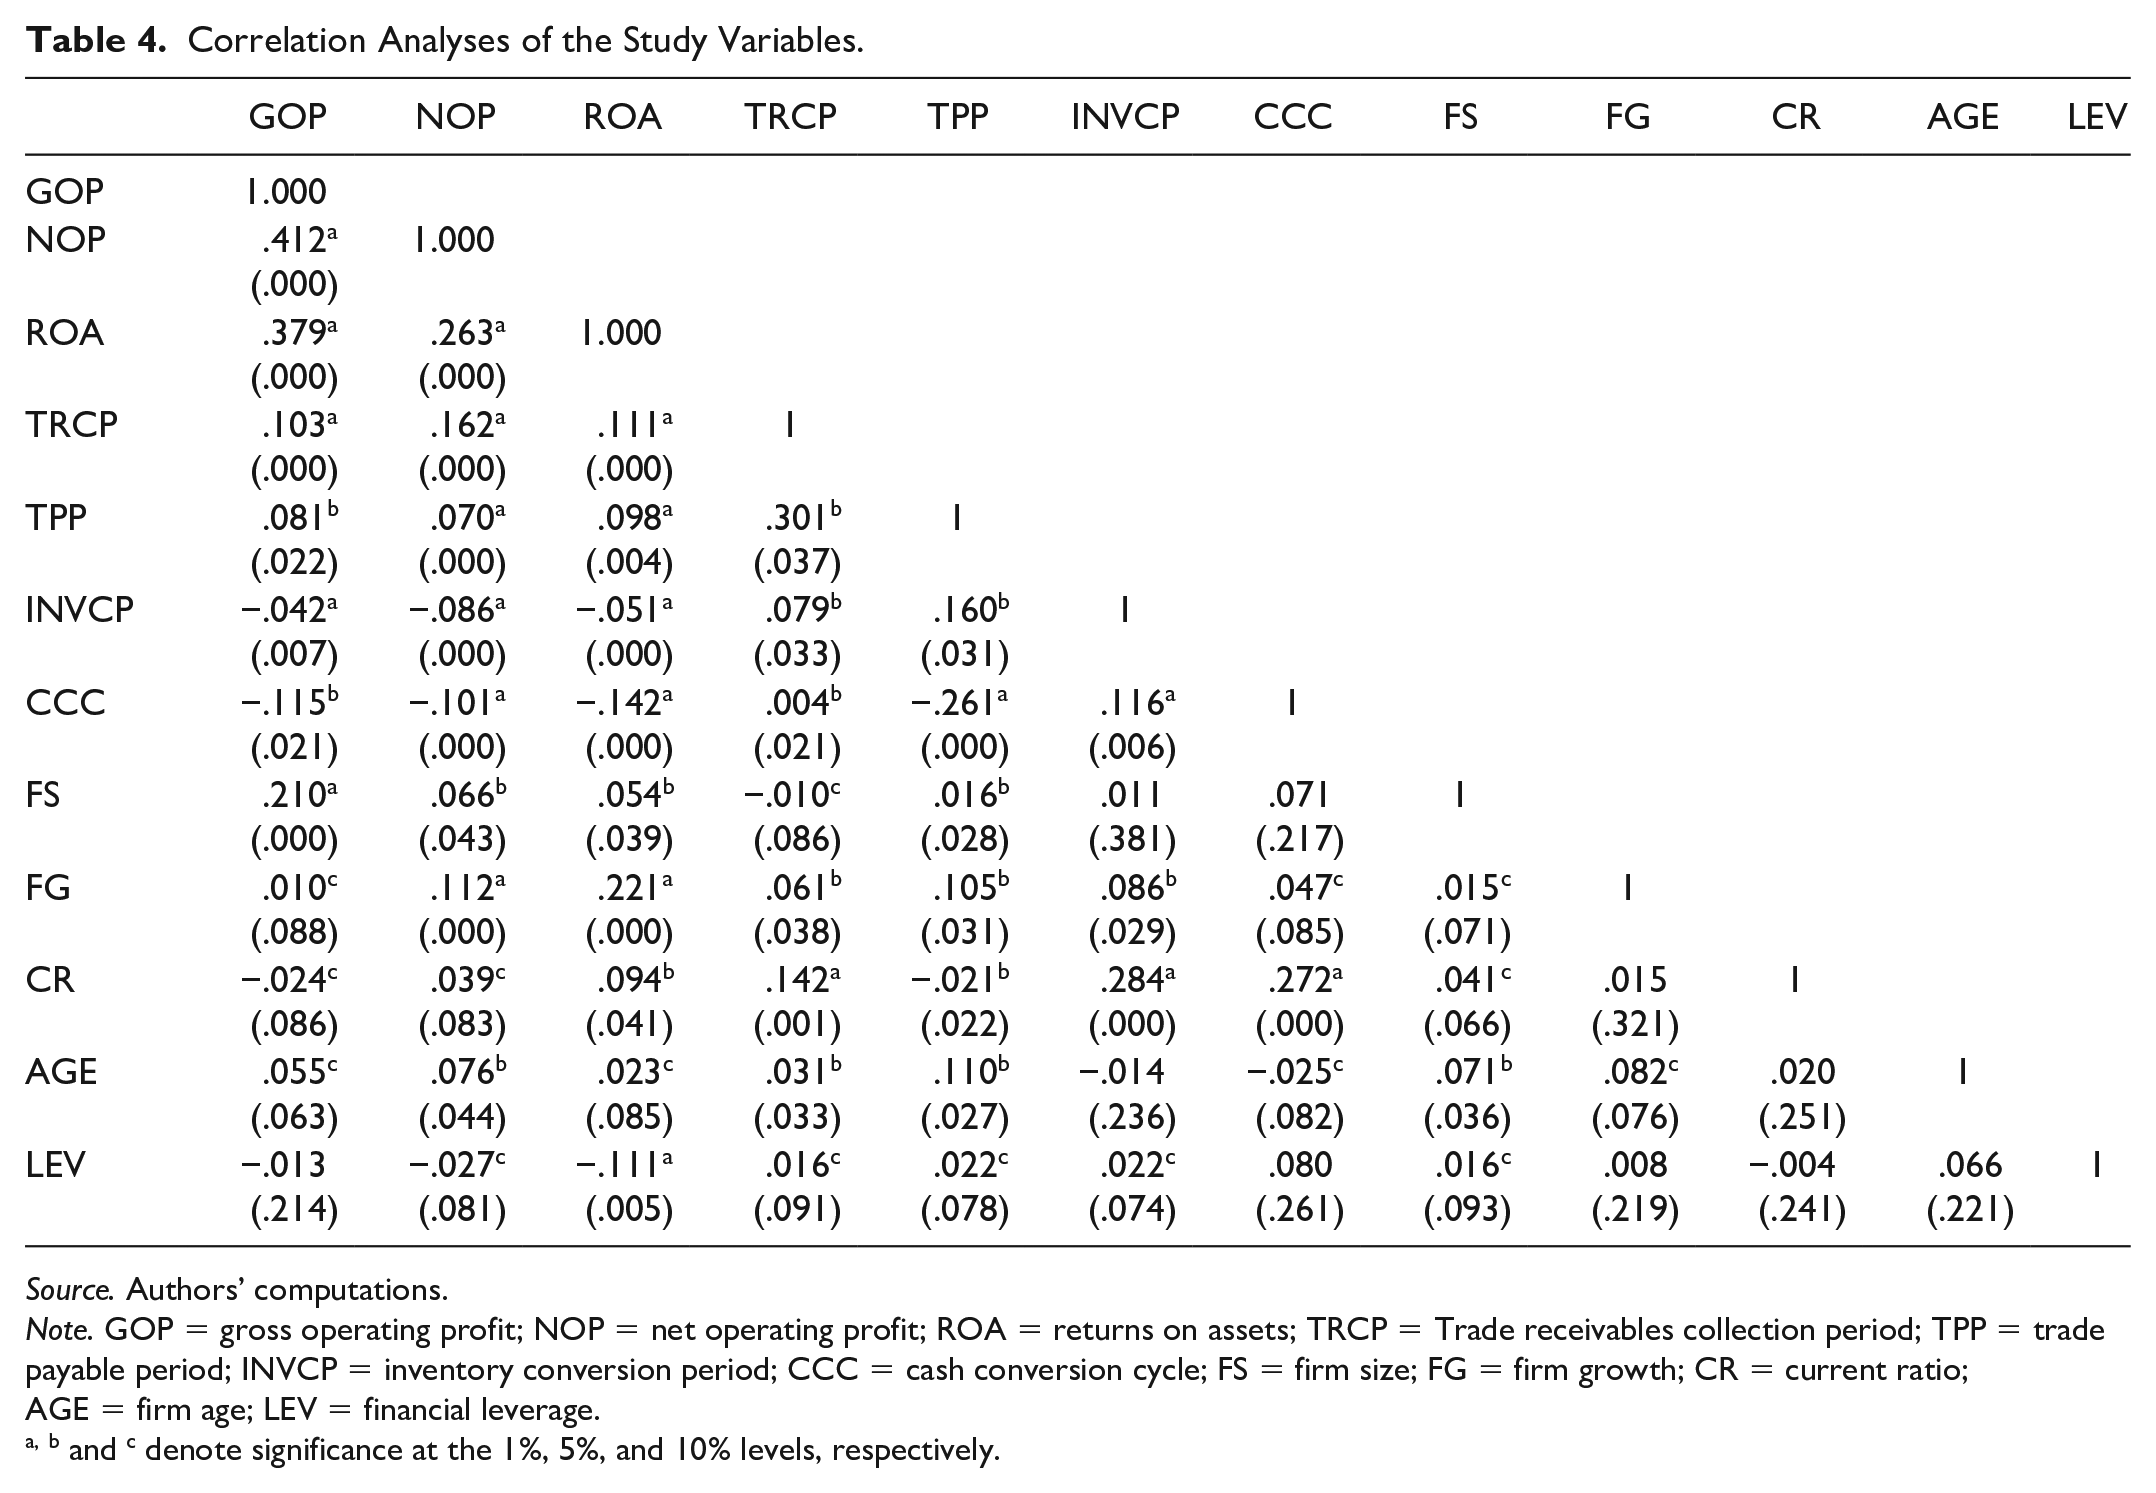
Table 4 presents the estimated coefficients of the correlations between the variables employed in our model. The correction analyses are presented to provide preliminary information on the linear relationship between the study variables. We find positive and significant relationship between TRCP and TPP on the one hand and that of GOP, NOP, and ROA on the other hand. INVCP and CCC show significant negative relationship with GOP, NOP, and ROA. More importantly, the estimated coefficients between the independent variables are all less than 0.8, giving an indication of the absence of potential multicollinearity (Gujarati, 2004).
Correlation Analyses of the Study Variables.
Source. Authors’ computations.
Note. GOP = gross operating profit; NOP = net operating profit; ROA = returns on assets; TRCP = Trade receivables collection period; TPP = trade payable period; INVCP = inventory conversion period; CCC = cash conversion cycle; FS = firm size; FG = firm growth; CR = current ratio; AGE = firm age; LEV = financial leverage.
, b and c denote significance at the 1%, 5%, and 10% levels, respectively.
Regression Results and Discussions
We explored our regression analyses with the primary aim of controlling for the issues of unobservable heterogeneity and endogeneity. Our regression model was therefore estimated with Arellano and Bond’s (1991) dynamic GMM instrumental variables estimator with robust standard errors. The GMM is widely considered a very powerful tool for demonstrating the dynamic relations between variables, such as those exhibited in the working capital–corporate financial performance relationships (Baños-Caballero et al., 2012; Korent & Orsag, 2018). As postulated by Arellano and Bond (1991), the consistency of the GMM estimator is premised on the assumption of no second-order autocorrelation and instrument validity. Consequently, the insignificant p values of the m statistics, as reported under Models 1 to 4 in Tables 5–7, indicate that there is no second-order serial correlation. The p values of the m statistics represent the test of no second-order correlation in errors as proposed by Arellano and Bond (1991). Moreover, the Sargan (1958) test results of moment condition, as reported under Models 1–4 of Tables 5–7, do not reveal any issue of overidentification. This gives credence to instrument validity. All regression results, as estimated under Models 1–4 for each profitability measure, are reported in Tables 5–7.
Regression Results on the Effect of Working Capital Management on Profitability (GOP).

Note. Reported in the parentheses are the robust standard errors. The highest VIF, though not reported, was 2.117, 2.383, 1.996, and 2.403 for the independent variables under Models 1, 2, 3, and 4, respectively. These VIFs fall below the threshold of 10, suggesting the absence of multicollinearity (Kennedy, 1998). GOP, TRCP, TPP, INVCP and CCC are as defined under Table 2. TRCP2, TPP2, INVCP2, and CCC2 denote the quadratic terms for TRCP, TPP, INVCP, and CCC, respectively. Each model estimation incorporated both time and industry dummies, but the estimates are not reported. GOP = gross operating profit; TRCP = trade receivables collection period; TPP = trade payable period; INVCP = inventory conversion period; CCC = cash conversion cycle; FS = firm size; FG = firm growth; CR = current ratio; AGE = firm age; LEV = financial leverage; VIF = variation inflation factor.
, b and c denotes statistical significance at 1%, 5%, and 10%, respectively.
Regression Results on the effect of Working Capital Management on Profitability (NOP).
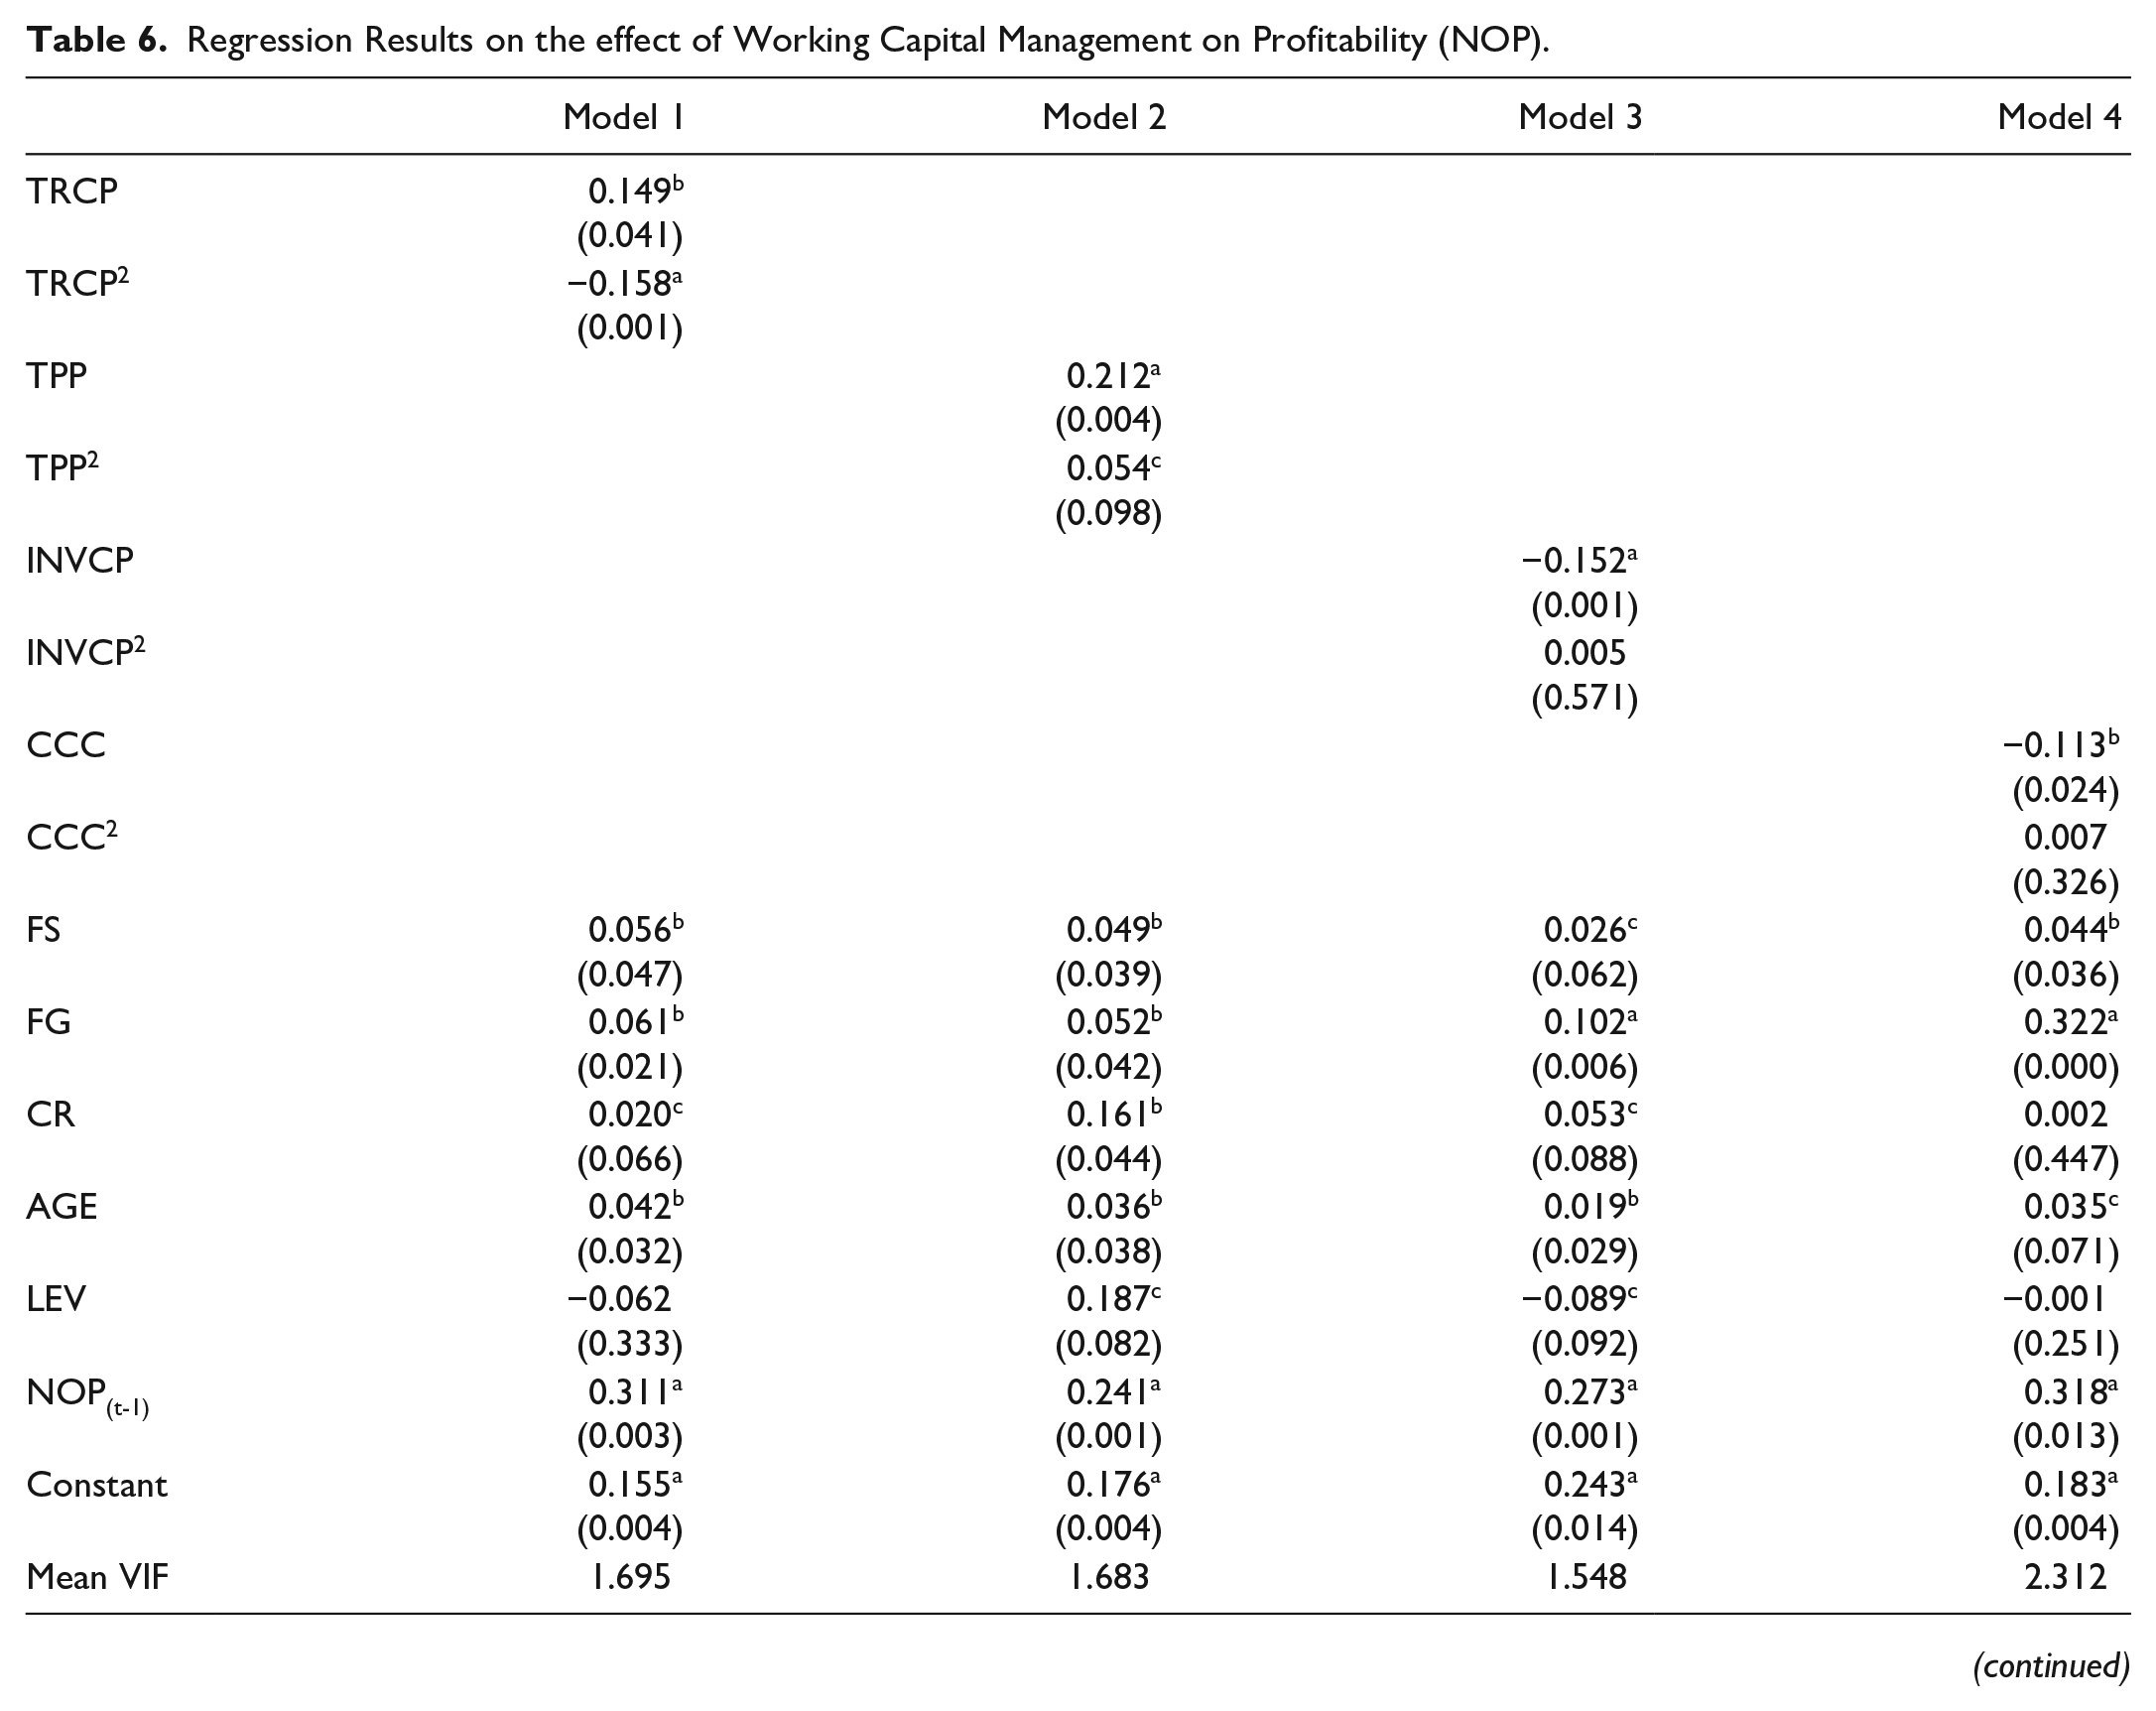
Note. Reported in the parentheses are the robust standard errors. The highest VIF, though not reported, was 2.035, 1.977, 1.981, and 2.758 for the independent variables under Models 1, 2, 3, and 4, respectively. These VIFs fall below the threshold of 10, suggesting the absence of multicollinearity (Kennedy, 1998). NOP, TRCP, TPP, INVCP and CCC are as defined under Table 2. TRCP2, TPP2, INVCP2, and CCC2 represent the quadratic terms for TRCP, TPP, INVCP, and CCC, respectively. Each model estimation incorporated both time and industry dummies, but the estimates are not reported. NOP = net operating profit; TRCP = trade receivables collection period; TPP = trade payable period; INVCP = inventory conversion period; CCC = cash conversion cycle; FS = firm size; FG = firm growth; CR = current ratio; AGE = firm age; LEV = financial leverage; VIF = variation inflation factor.
, b and c denotes statistical significance at 1%, 5% and 10%, respectively.
Regression Results on the Effect of Working Capital Management on Profitability (ROA).
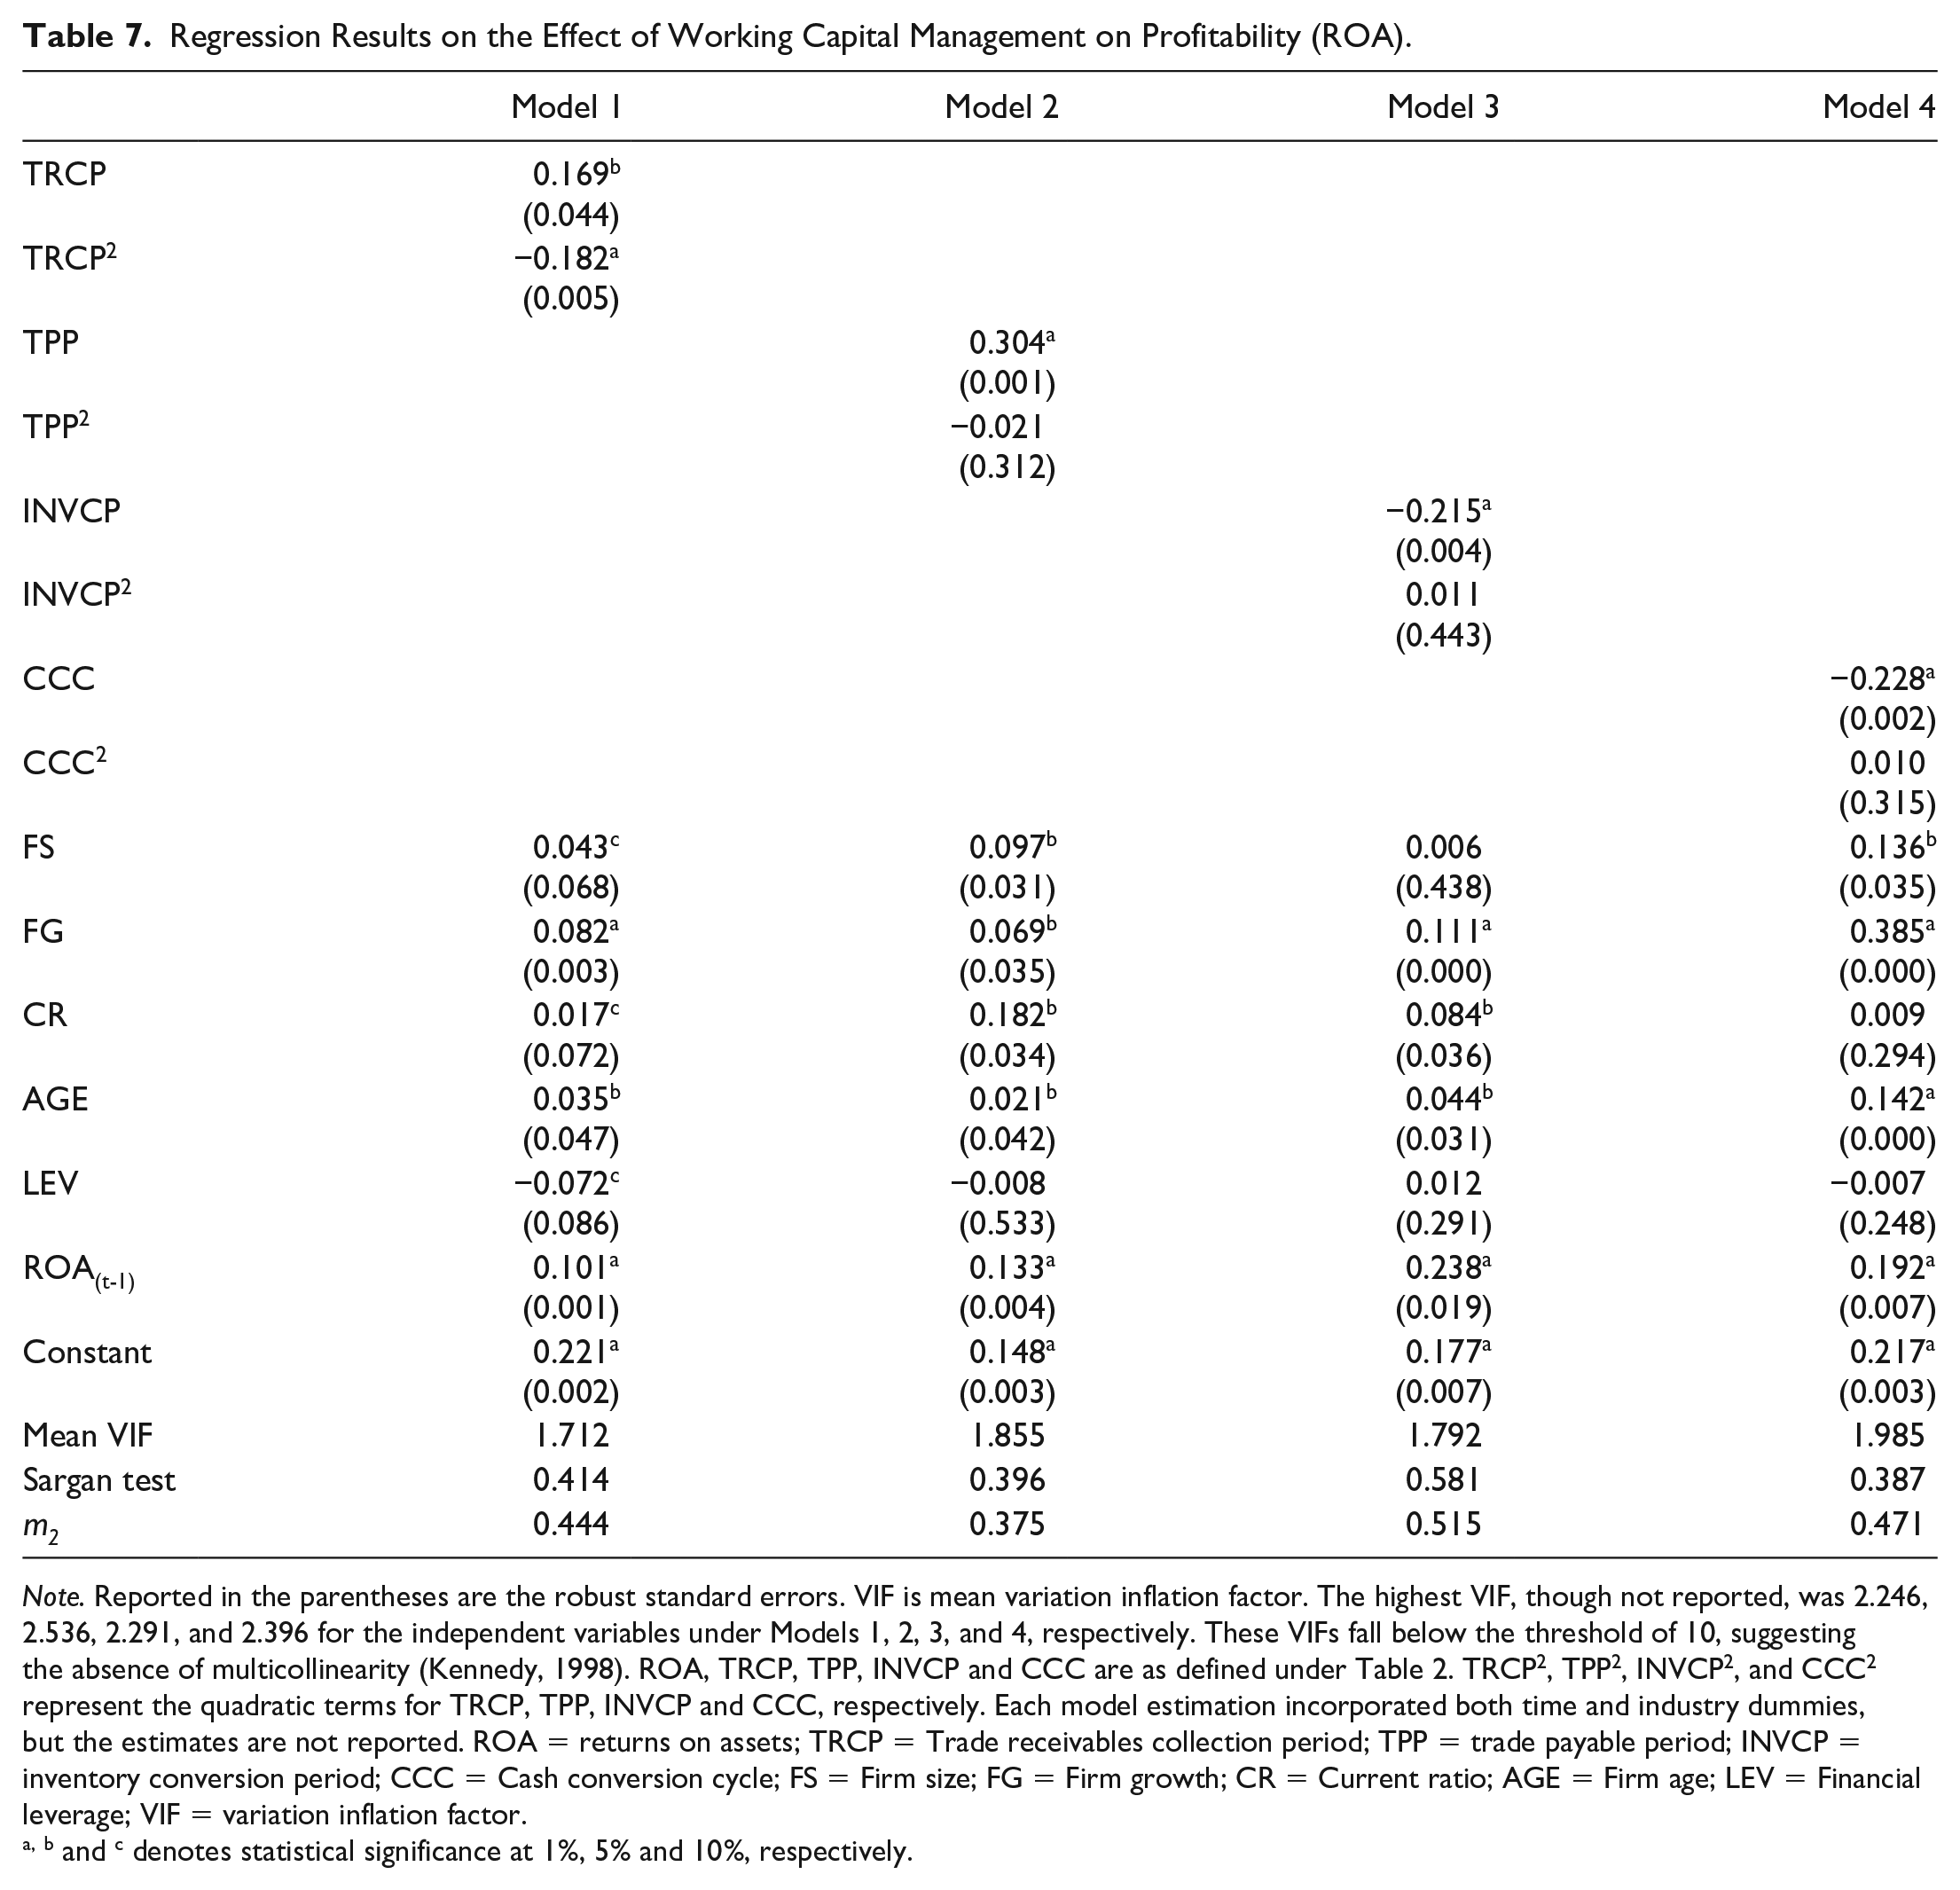
Note. Reported in the parentheses are the robust standard errors. VIF is mean variation inflation factor. The highest VIF, though not reported, was 2.246, 2.536, 2.291, and 2.396 for the independent variables under Models 1, 2, 3, and 4, respectively. These VIFs fall below the threshold of 10, suggesting the absence of multicollinearity (Kennedy, 1998). ROA, TRCP, TPP, INVCP and CCC are as defined under Table 2. TRCP2, TPP2, INVCP2, and CCC2 represent the quadratic terms for TRCP, TPP, INVCP and CCC, respectively. Each model estimation incorporated both time and industry dummies, but the estimates are not reported. ROA = returns on assets; TRCP = Trade receivables collection period; TPP = trade payable period; INVCP = inventory conversion period; CCC = Cash conversion cycle; FS = Firm size; FG = Firm growth; CR = Current ratio; AGE = Firm age; LEV = Financial leverage; VIF = variation inflation factor.
, b and c denotes statistical significance at 1%, 5% and 10%, respectively.
Model 1 in Tables 5–7 reports the test results on the relationship between TRCP and the measures of profitability: GOP, NOP, and ROA, respectively. The test results show that TRCP has positive association with GOP (
Under Model 2 of Tables 5–7 are the test results on the relationships between TPP and GOP, NOP and ROA, respectively. TPP shows positive associations with GOP, NOP and ROA (
The results obtained with the use of INVCP as WCM measure (see Model 3 under Tables 5–7) show negative association between INVCP and all three measures of profitability (
As reported under Model 4 of Tables 5–7, the estimated coefficients of CCC are all negative (see
Additional analyses
The test results under Model 1 of all three tables (see Tables 5–7) show an inverted U-shaped relationship between TRCP and profitability. The implication of the inverted U-shaped relationship is that there is an optimal level of TRCP beyond or below which SMEs profitability may be adversely impacted. We, therefore, perform further check to confirm the financial consequences, if any, of such deviation using well-documented models. Toward this end, we adopt the two-stage model proposed by Tong (2008), which has also been used extensively in subsequent empirical studies (Altaf & Shah, 2018; Martinez-Solano et al., 2013).
In stage 1 of the model application, we determine the deviation from the optimal TRCP-based on carefully selected determinants of firms’ investment in trade receivables. Variables chosen as determinants for the optimal TRCP are based on review of prior literature (García-Teruel & Martínez-Solano, 2010; Martinez-Solano et al., 2013). The specific determinants of the optimal TRCP (the proxy for trade receivables investment) considered here include firm size (FS), firm’s external financing cost (EFFC), amount of firm’s internal financing component (IFF), short-term financing (SHFC), profitability (PRT), firm growth (FG), and a measure for product quality (PROQ). We, accordingly, formulate our optimal TRCP regression equation as:
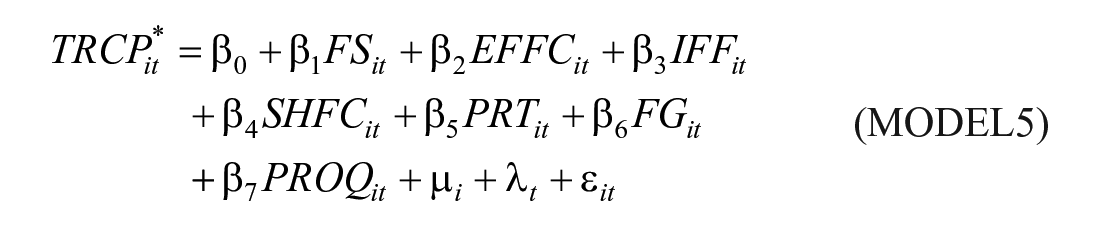
where
We obtain the measure of deviation from the optimal level of TRCP based on MODEL 5. Specifically, we measure the deviation from the optimal
Under Stage 2 of our model application, we test the impact of the deviation (DEV), as estimated under MODEL 5, on the profitability of the firm. We specifically formulate the Stage 2 regression model as:

where
Results on the Impact TRCP Deviation on Profitability.
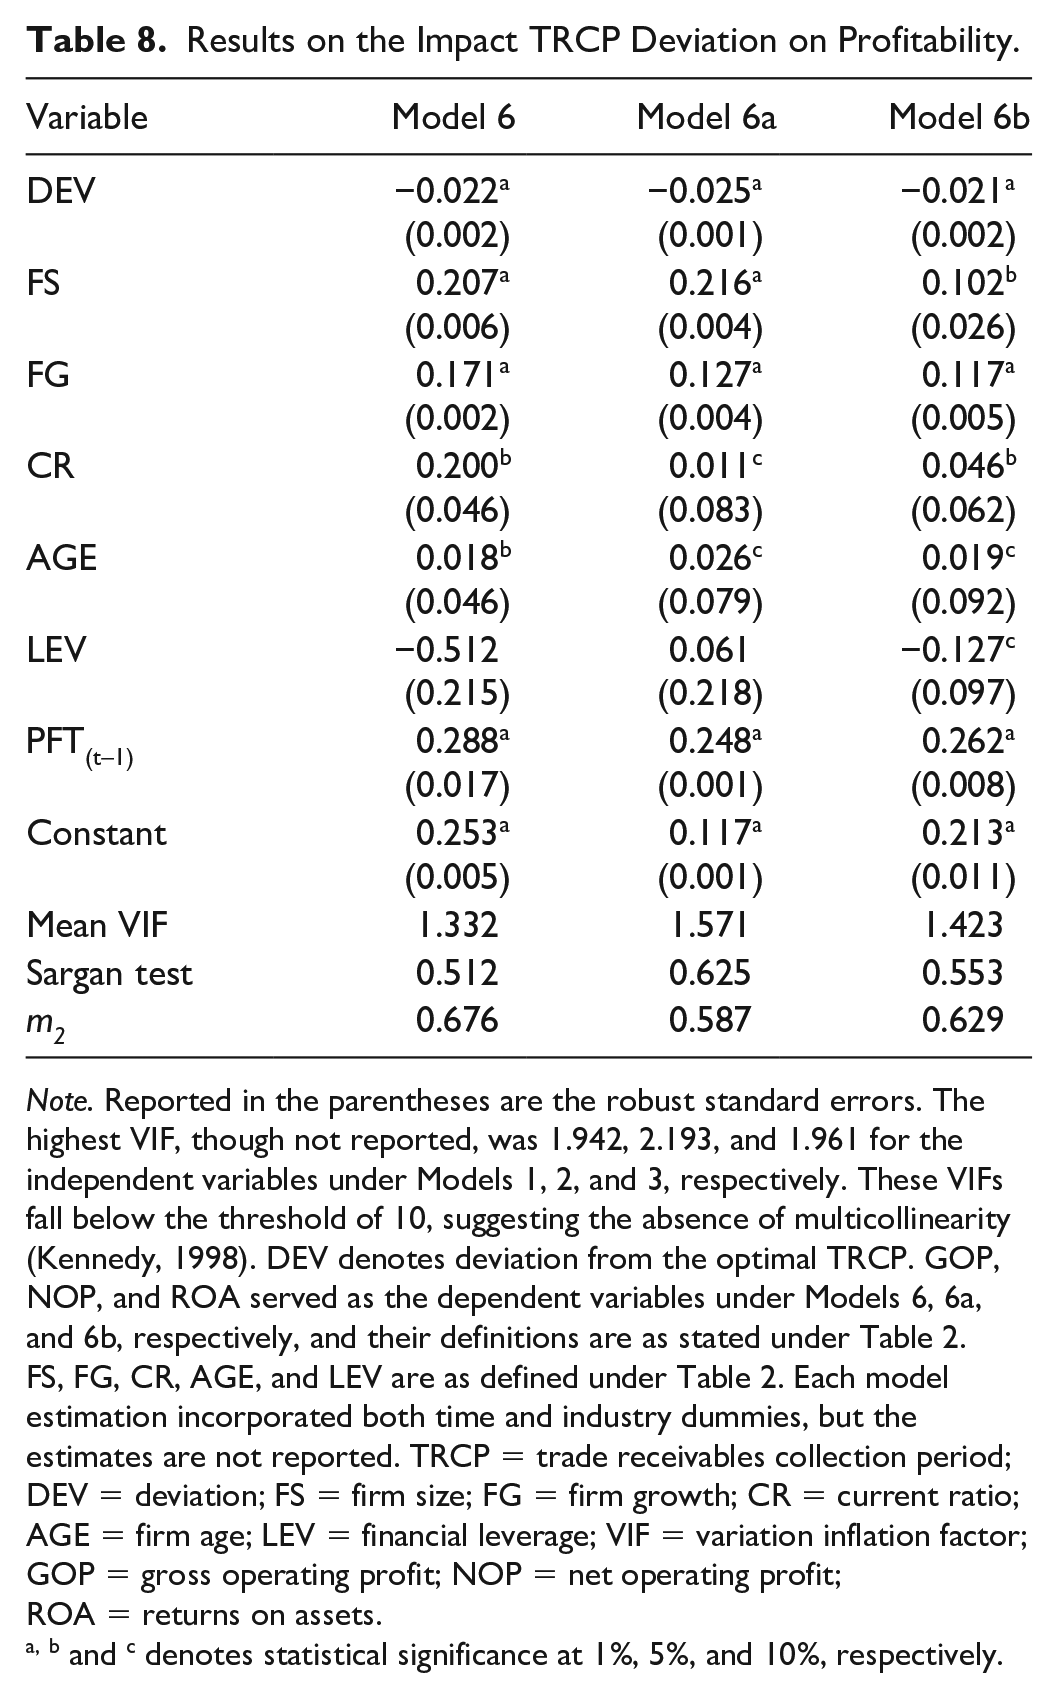
Note. Reported in the parentheses are the robust standard errors. The highest VIF, though not reported, was 1.942, 2.193, and 1.961 for the independent variables under Models 1, 2, and 3, respectively. These VIFs fall below the threshold of 10, suggesting the absence of multicollinearity (Kennedy, 1998). DEV denotes deviation from the optimal TRCP. GOP, NOP, and ROA served as the dependent variables under Models 6, 6a, and 6b, respectively, and their definitions are as stated under Table 2. FS, FG, CR, AGE, and LEV are as defined under Table 2. Each model estimation incorporated both time and industry dummies, but the estimates are not reported. TRCP = trade receivables collection period; DEV = deviation; FS = firm size; FG = firm growth; CR = current ratio; AGE = firm age; LEV = financial leverage; VIF = variation inflation factor; GOP = gross operating profit; NOP = net operating profit; ROA = returns on assets.
, b and c denotes statistical significance at 1%, 5%, and 10%, respectively.
As reported in Table 8, the estimated coefficients of DEV are negative and significant under all three measures of profitability (i.e.
Conclusion, Implications, and Study Limitation
In this study, we empirically examine the relationship between WCM and profitability of SMEs in the non-financial sector of Ghana. The study was based on a sample of 366 SMEs over a period of ten (10) years, spanning from 2007 to 2016. Four measures of WCM, including trade receivable period (TRCP), trade payable period (TPP), inventory conversion period (INVCP), and cash conversion cycle (CCC), were employed. Firms’ profitability was also measured with three alternative profitability proxies: gross operating profit, net operating profit, and returns on assets. For the purposes of this study, we tested for the potential of both linear and non-linear relationship between each component of WCM and corporate profitability, using dynamic GMMs estimator. The GMM was employed to allow us control for unobservable heterogeneity and most importantly the concerns with potential endogeneity.
The test results provide striking variations on the relationship between each working capital component and profitability. The study established an inverted U-shaped between TRCP and corporate profitability, suggesting the existence of an optimal level of TRCP where profitability is maximized. A further check revealed that profitability of firms is negatively impacted when the TRCP deviates from its optimal level. The results thus suggest the need for managers to endeavor to maintain an optimal TRCP level, or avoid the tendency of deviating from the TRCP level to maximize profitability. The results further indicate negative impact of both INVCP and cash conversion cycles on profitability. These suggest that the practice of holding low levels of investment in inventories and working capital in general improve firms’ profitability. TPP was, however, found to have positive association with profitability, which indicates that negotiating for delayed payment periods from trade credit suppliers leads to higher profitability. The findings of this study are generally consistent with several of the existing studies. With respect to TRCP, we find similar evidence from a study by Altaf and Shah (2018). The results with respect to CCC and INVCP are consistent with Bhatia and Srivastava (2016) and Deloof (2003) and Sharma and Kumar (2011), respectively. Finally, the evidence with respect to TPP is similar to the following works (Bougheas et al., 2009; Makori & Jagongo, 2013).
The findings of the study have compelling implications for both literature and management. The study contributes to the general literature on the financial effect WCM practices from the perspective of SMEs in a developing West African country, Ghana. Practically, the study provides useful insight to managers on the trade-off between liquidity and profitability. When considered collectively, the results suggest that WCM significantly impact corporate profitability, but each component of WCM depicts different influence. This suggests that each WCM component may warrant unique management strategy to maximize profitability. The test results signals to manager that adopting a straight jacket approach for each WCM component may not inure to the benefit of the firm. The results also reveal that different firm-specific factors such as firm size, growth, current ratio, age, and financial leverage affect corporate profitability differently, depending on the specific WCM component under consideration. The study, therefore, highlights the need for managers to consider firm-specific characteristics to devise appropriate WCM policies to help maximize profitability. The study also provides useful information to state institutions, especially those charged with oversight responsibility of seeing to the financial success and growth of SMEs in Ghana. Thus, for regulators, who are responsible for ensuring the financial success and survival of SMEs, the strength of the results makes it clear that proper scrutiny of the WCM policies of SMES should be done to achieve such objectives. This is particularly important as the government seeks to champion its private sector–led economic growth agenda with emphasis on SMEs.
Despite the relevance of the evidence produced in this study, we offer the following directions for future studies. Our study focused specifically on accounting-based profitability measures. We believe future research can add valuable information to this study by extending the analysis to include different metrics of financial performance. For example, studies can look at critical financial variables such as operating risks. Future studies can also reconsider this study from the perspective of firms’ market value (thus, stock returns) and equity risks, particularly for SMEs that are publicly traded.
Footnotes
Declaration of Conflicting Interests
The author(s) declared no potential conflicts of interest with respect to the research, authorship, and/or publication of this article.
Funding
The author(s) received no financial support for the research, authorship, and/or publication of this article.