
Abstract
The pandemic caused by covid-19 has revealed an enormous vulnerability in health, economic and social terms. We are facing a new unprecedented environmental and socioeconomic reality, which poses a challenge for risk control and management. This forces a methodological effort to be made in all areas in the creation of models for the prevention and prediction of existing impacts, risks, and potential threats. In Social Services’ field, we propose a tool that will allow, on the one hand, to measure the impact of COVID-19 on the Social Services system and, on the other hand, to evaluate the areas with the highest socioeconomic risk in the post-COVID scenario. The modified Delphi technique has been used to reach a consensus on a proposal of 37 indicators with a group of experts, which in the final phase resulted in 34. To our knowledge, this represents the first risk assessment tool in social services designed specifically for use at local level. The proposed tool can help determine the situation of municipal social services in relation to risk, assessing weaknesses and improving the capacity of the system.
Introduction
The COVID-19 pandemic has created new needs and ways of dealing with global threats. Impact assessment and risk and disaster management methodologies are models capable of preventing risks and designing future scenarios considering realities that may be susceptible to hazards such as natural disasters. There is a broad scientific consensus in methodological models’ proposal of impact assessment and risk management based on vulnerability, threats and capacity (Hazard, Vulnerability, Capacity and Risk Assessment, HVCRA, hereinafter). Thus we can see HVCRA methods in environmental issues such as floods, droughts, hurricane or storm sensitive areas, earthquakes or consequences of climate change (Ebi & Bowen, 2016; Kadam et al., 2020; Kamanga et al., 2020; Nguyen et al., 2016; Reinoso et al., 2020); and adaptations of the model applied to health and public health system impacts, urban vulnerability, social vulnerability, poverty, and socioeconomic impacts (Estoque et al., 2020; Lankao & Qin, 2011; Rufat et al., 2015). Different approaches and methodologies are being developed for study and intervention in the face of new complex realities (migratory flows, refugee and asylum processes arising from war and environmental situations, technologization of society, pandemics); however, no research have been located that use the HVCRA methodology applied to the field of social services as it shown in this article. Moreover, these studies that assess risk in social services do not implement the HVCRA model and are focused on specific objects of study such as domestic violence (Skillmark et al., 2019), psychosocial risk in families (Rodríguez et al., 2006), risk in adolescents and minors (Åström et al., 2017; Bastian, 2017), homelessness (Mullen et al., 2022), among others. On the other hand, there are research addressing vulnerability, resilience and hazards (Flanagan et al., 2011) but not in a joint way applied to social services. In current times, innovative responses are required and/or transferred from other areas, so it is necessary to address the interdependence of social vulnerability from other disciplines with greater expertise in matters of a similar nature (economy, environment, culture, territory). It is worth highlighting the article by Bergstrand et al. (2015) that contributes to the literature on catastrophes by measuring and connecting social vulnerability and community resilience in U.S. counties finding a correlation between high levels of vulnerability and low levels of resilience. By examining social vulnerability and community resilience they map communities’ social risks to hazards as well as their resilience and adaptive capacities.
In disaster management, regardless of the cause, social work has been recognized as an important resource before (mitigation/preparation) and after (response/recovery) the event (Gillespie & Danso, 2010). Generally, social work contributes to the support of the individual and his or her family and their ability to recover after a critical situation. It also deals with the distribution of emergency aid, the identification of those most at risk, the provision of an information channel and a mediation service between individuals, communities and organizations, in the reconstruction of social functions and in preventive interventions (Cuadra, 2015). Therefore, although the contribution of social work is evident in disaster situations, there is no model that monitors and performs an intra-risk assessment in Social Services as a system in the face of random situations as Covid-19 can be.
In this article, the HVCRA model combines the variables of vulnerability, hazard and resilience (Wisner et al., 2014). This model works on the management of uncertainty, from an integral and transferable knowledge, and framed in integrated planning strategies in risk management and socioeconomic impact in disasters, hazard and/or risk situations (Van Niekerk, 2002), which allow the protection of people and systems, with effective and appropriate management modes to know, apply and control.
First, the vulnerability dimension has been defined as the one that reflects situations of fragility linked to the sociodemographic structure and data directly related to the population. It has been measured through variables such as aging index, migratory balance and temporary employment. The threat dimension contains indicators that are more directly related to the territorial context, such as average income, rental price indexes, diversity of productive sectors. Lastly, resilience has been defined as the capacity of social protection systems, in this specific case social services, to reverse the negative effects derived from the situations of vulnerability and threats contemplated in the previous dimensions (Walker & Salt, 2006). The indicators selected have to do with social facilities, the social services budget, expenditure on social benefits, percentage of people over 65 years of age out of the total number of users, among others. The resilience dimension is the one that includes the largest number of indicators, due to the increasing importance of resilience or the capacity to reverse adverse situations in communities or systems (Béné, 2013; Bhandari & Alonge, 2020). Resilience is concerned with the dynamism, contingency and absorption of disturbances in complex adaptive systems or parts thereof at different scales, from the global to the local with their ecosystems and communities involved.
The proposed tool represents an important advance and innovation, by favoring the identification, prevention and mitigation of risks, as well as their transfer to assist in strategic decision-making processes. The three dimensions incorporated allow working from variables that make up composite indicators that capture the complexities and allow the synthesis of relevant information (Schneiderbauer et al., 2017). The model is established from an approach of social management of irrigation and consideration of the complexity of the processes, beyond purely technical and statistical issues. From a constructivist approach, knowledge and interpretation are based on data and incorporate elements of reflection on generative-modulating processes (ideological frameworks, social processes, etc.) (Aledo & Aznar-Crespo, 2021). Pre- and post-pandemic measurements are established for the inclusion of elements of change and temporality that can modulate variables of the dimensions considered.
The transference of the HVCRA method to the field of social services in this project has followed a sequence of phases that have led to the final Social Services Risk Index (SSRI) which considers the ratio of vulnerability to hazards to resilience in its calculation. This index has been calculated for a pre- and post-pandemic period. Thus, the impact is the ratio between both time points (Muñoz-Moreno et al., 2023).

Finally, the final calculation of the SSRI is made by multiplying the vulnerability index (iV) by the hazard index (iH), divided by the resilience index (iR). This SSRI is calculated for all social services in the pre- and post-COVID-19 situation.
Making use of this methodology and adapting it to the field of social work and social services, in addition to being innovative, will provide planning elements to develop strategies and action plans aimed at reducing the impact of risk and crisis situations, as well as a better understanding of the services in the contexts where they are developed and to be able to establish elements of prevention and action with foresight. Moreover, it allows uncertainty and risk to be managed through evidence-based practice with standardized risk assessment tools that are evident in many countries (Ponnert & Svensson, 2016). Risk management, anticipation in the present involves assuming the challenge of making certain forecasts or posing situations, which do not cease to be partial or incomplete. In this sense, following Cardona (2022), the relevance and emphasis in the management or handling of safety must be placed on informing as well as possible the decisions that must be made and justify the actions of the best plausible objective way. The same author advocates the need of a common language and a holistic theory of risk from an interdisciplinary viewpoint and based on an approach like the one used in complex dynamic systems. In these times, the field and the focus of risk management and processes that are not only society-environment are extended, but are socio-ecological, territorial, participatory, etc. It is about incorporating a trans-scale approach, so that contributions at local level can be framed in regional or even global visions, allowing dynamic understandings and applications (Bocco et al 2020). This author argues that incorporating the territorial dimension can help to close the gap between threat and vulnerability and find adaptation paths as transformation, rather than as a mere adjustment to pre-existing conditions. With all this, in the framework project from which this study and article was born, all the substantial exposed elements of the HVCRA model are considered, in the field of social services and with territorialized indicators.
It should be stressed that the motivation for the design of this tool arises from a context strongly affected by the covid-19 pandemic, although the applicability of the tool that is designed is intended to be useful in the prevention and prediction of different circumstances and events that may have a negative impact on the socio-economic reality of our societies.
This article presents the first methodological steps that have taken place within the framework of this project to define the final set of indicators that will form part of the model in the design of the social services risk index.
Methodology
Design
In this study, a modified Delphi technique is used in two phases or rounds with the objective to optimize the content validation, and in order to increase response rate in consecutive rounds (Cabero, 2014). The initial version of the proposal was developed through a mixed study of literature review and indicator consultation by the research team. From the initial version, the consultation process is carried out with nine experts. For the methodological procedure, the article follows the phases of Bravo and Arrieta (2005). The study procedure is presented in Figure 1.

Procedure for application of the modified Delphi technique.
In accordance with the theoretical postulates of the Delphi method (Blasco & López, 2010; Bravo & Arrieta, 2005; Oñate et al., 1988), two groups were formed to validate the system of indicators designed: the coordinating group (research team) and the experts group. The experts group selection was made by the coordinating group, considering the recommendations of Landeta (1999) regarding the number of experts participating in the group and considering the candidates’ knowledge of the subject matter addressed as a fundamental criterion.
E-mail is used as a means of communication for the validation process. The document sent to the participants consists of a first page with a brief introduction to the research topic, a clear explanation of the objective, the method used, the phase of the research, instructions for completing the questionnaire, and, finally, the corresponding instrument for content validation (Luna et al., 2006). To avoid the introduction of bias and/or the effect of leadership in the study, the questionnaire is conducted anonymously.
Initial Drafting of Dimensions and Indicators
In order to provide a theoretical justification for the content design of the social services risk assessment tool, a mixed study is carried out to develop a framework of dimensions and indicators. The research team first categorizes the dimensions and indicators and then conducts a systematic review of locally available data in official databases. For the collection of vulnerability and hazard data, we have used mainly the Multiterritorial Information System of Andalusia (SIMA); while for resilience indicators, we have take into account the data sources available from the Ministry of Equality, Social Policies and Conciliation and also from the Ministry of Health and Families through the Primary Care Information System (SIAP). With respect to the latter dimension, many of the indicators are only available for municipalities with more than 20,000 inhabitants.
Finally, builds the initial structure of the tool with 3 dimensions and 37 indicators.
Delphi Process
Panel of Experts
Expert judgment has a number of advantages, such as the quality of the response obtained, the level of depth of the assessment offered, its ease of implementation, and the lack of great technical and human requirements for its execution (Cabero-Almenara & Barroso-Osuna, 2013). The experts in this study are professionals and academics who have a deep knowledge of demography, environment, urban planning and/or social services. The inclusion criteria were the following: (a) currently working in a related professional field or, in an academic institution (b) having worked more than10 years in the mentioned fields of knowledge. The selection of experts began with the research team’s own contacts, and from there other experts were located at specific scientific congresses in the field. Initially 16 panel members were recruited, but 9 experts participated in the two rounds: 6 from academia (demography, sociology, geography and environmental sociology) and 3 from institutions (socio-health sector, childhood and family, and social services). The characteristics of the participants are shown in Table 1.
Characteristics of the Participants in the Expert Panel.

While we recognize that nine is a low number from which to draw conclusions, the nine experts who participated throughout the study are very knowledgeable and dedicated to their field; so much so that they showed their commitment to ensuring that this Delphi study can help measure risk in social services. Furthermore, research shows that the Delphi technique is particularly suited for complex issues where the outcome does not depend on the sample size, but rather on the different perspectives and expertise of the respondents (Fefer et al., 2016; Mukherjee et al., 2015).
First Round
The initial content of the proposal developed by the research team, was incorporated into a questionnaire, in which 3 dimensions and 37 items represented specific content on risk assessment in social services. The questionnaires were sent by e-mail and experts were asked to rate each dimension and each subordinate item using a 5-point likert scale that measured the degree of importance of each dimension and indicator in the model, with 1 being not at all important and 5 being very important. A blank space was left after each entry for additional comments from the experts. To ensure timely completion of the study, the experts were asked to return the questionnaires within 2 weeks.
We have given special interest to qualitative evaluations, since by analyzing in detail the information and suggestions provided by the experts, the exclusion of items, the structure of indicators, the creation of new items, and new dimensions are delimited (Wiersma, 2001).
From the first round it is clear that the degree of importance of the indicators and the degree of agreement can be improved if the second round questionnaire includes a deeper conceptualization of what each dimension and indicator means.
With regard to the open questions, the recommendations made by the experts were included in the second questionnaire. Four new indicators were added:
- “No. of contracts registered by type of working day” (vulnerability dimension).
- “Real estate by age of buildings”(vulnerability dimension).
- “Real estate by quality of construction”(vulnerability dimension).
- “Degree of urbanization and percentage of population according to cell typology” (hazard dimension).
These recommendations were included in the second round so that they could be assessed by the entire group of experts.
Second Round
In the second round, we sent a revised a version of the questionnaire with the changes introduced. A report with the results of the first round was attached to the new questionnaire to facilitate the experts’ judgment. This questionnaire also included an open-ended question under each dimension and indicator so the experts could make any appraisals they deemed appropriate.
The purpose of this round is twofold: to inform the experts of the results obtained in the first round and to consolidate and revalidate the results obtained in the initial questionnaire.
Data Analysis
We analyzed the quantitative and qualitative data from the Delphi survey. SPSS version 27.0 (IBM, 2020) was used for the quantitative analysis. The mean score and standard deviation, mode, and maximum and minimum values were described. Zambrano et al. (2015) propose that items which possess a higher mean will be the ones to be retained, while those items that are close to the middle of the mean will be subject to revision and improvement. Thus, in the second round, an evaluation of the indicators was carried out to see which made up the final proposal. The item is included in the model if it has a modal value equal to or greater than 4. At the same time, items with a value of 3 were included or not, depending on the position of the modal values in the first quartile. For the item to be taken into account in the model, 75% of the experts had to have rated it as important (4) or very important (5).
To present the content validity of the dimensions and indicators, the content validity coefficient (CVC) was calculated (Hernández-Nieto, 2002). This coefficient allows us to assess the degree of agreement of the experts (the author recommends the participation of between three and five experts, in our case it was 9) in relation with the different items and to the instrument in general. For this purpose, after applying a five-alternative Likert-type scale, the mean obtained for each of the items is calculated and, based on this, the CVC is calculated for each item. In the second round the CVC of the model was 0.73 and for the final proposal it rose to 0.79; that is, an acceptable validity and concordance (0.71–0.79) according to the referenced author. Other studies for 9 cases place the minimum at 0.78 (Rubio et al; 2003). The dimension with the best coefficient was resilience with 0.91 (excellent validity and concordance).
The qualitative data refer to the experts’ textual comments and were consolidated in a document by two researchers. All qualitative data were understood and discussed by the entire research team in internal meetings to guide the final proposal.
Study Limitations
An important strength of this study is that expert opinions have been obtained from different regions and areas of knowledge. However, this study has some limitations. First, due to the lack of published research, the content structure of the tool was developed based on an exploratory study rather than a broadly validated framework, which may affect its completeness and applicability. Second, the experts were selected by purposive and snowball sampling, which meant that not all potential experts had an equal opportunity to be included, although the research group made every effort to have as many experts as possible for multiple perspectives. Furthermore, regardless of whether the proposal is methodologically rigorous, the validity and feasibility of the proposal’s content have yet to be verified in future studies by other participants more closely aligned with the organizational structure of social services (stakeholders).
Results
In the first and second round, 100% of the experts who agreed to participate, answered the questionnaire and all of them evaluated the items qualitatively and quantitatively.
Descriptive statistics were used to explain the results obtained. Table 2 shows the mode and the minimum and maximum values obtained for each item. The mode can take values between 1 and 5, the higher the greater the importance of each indicator in the opinion of the experts. An item with a value of 5 and 4, respectively, will be considered very important or important. A value of 3 would indicate medium importance, and below that number, importance is low (2) or very low (1).
Mode and Minimum and Maximum Values of the Indicators. First and second Round.


Source. Authors.
In Table 2, the items with a modal value of 4 and 5, the most important for the model, are shaded in green, those with a value of 3 (medium or neutral importance) in white and those with a value of 2 in red, since a priori they would be outside the model. Value 1 (not important at all) does not appear in any item. In general terms, there is a significant number of items valued positively, both in the first and second round, and it can be seen how they are more agglutinated in the resilience dimension.
If we look at the results obtained by dimensions, Figure 2 shows the accumulated modal values for each of them in the two rounds carried out. In the vulnerability dimension, it can be seen how initially the modal value 3 has weight in the model, and how in the second round there is a change in the experts’ assessment, increasing the degree of importance of the items, especially value 4, which did not appear in the first round. The threat dimension is the one that shows the highest concentration in value 3 in both rounds and the lowest variability of the results; in fact, in the second round the change is only evident in one item that obtains value 5. As for the resilience dimension, both in the first and second rounds, it obtains the highest modal values; indeed, in the second round all the indicators are between value 4 and 5. Of the 18 items that make up the dimension, 11 obtain the maximum modal value (5).
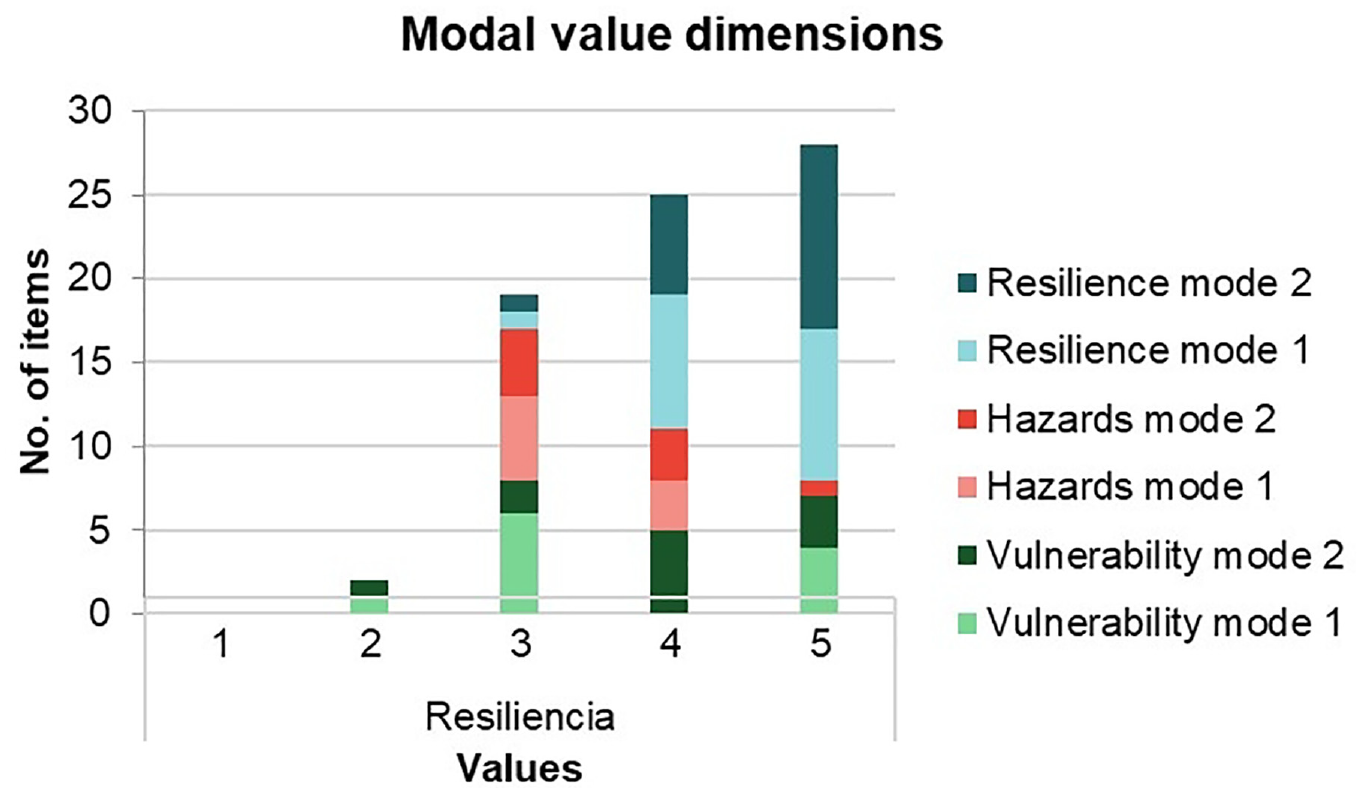
Accumulated modal values in the three dimensions of the model.
In short, it is evidenced how the vulnerability dimension is the one that shows the greatest changes in the experts’ opinion from one round to another, how the threat dimension obtains a lower modal value, remaining almost the same in both rounds, and how the resilience dimension is the one that obtains the highest degree of importance in both rounds.
The modal value is also used to decide which item is or is not part of the final proposal. In the first round, although there was an item with a modal value of 2 (“migration balance”-vulnerability-), it was decided to keep it in the second-round questionnaire to see if the inclusion of the explanation of the indicator, as suggested by the experts, would lead to different results. In this case, although the modal value improved in the second round (3), it is not included in the final proposal since quartile 1 has a value lower than 3. Table 3 below shows the indicators that have been monitored (those that have obtained a value of 3 in the second round, a total of 7) and those that are finally included in the final proposal.
Decision on Whether or Not to Include Indicators With Value 3 (Mode).

Source. Authors.
Other descriptive items which have been calculated are the mean and standard deviation (Nunnally, 1978). For the mean, like the mode, the values range from 1 to 5. The standard deviation can take values between 0 and 2. A value of 0 indicates that all experts rate this item with the same score (maximum degree of agreement, whatever the value scored). A value lower than 0.5 shows a very high degree of agreement; on the other hand, values higher than 1 denote a low or very low degree of agreement.
If we compare the degree of importance (mean) and agreement (standard deviation) in both rounds (Figures 3 and 4), it is evidenced that, in both the first and second rounds, the resilience dimension obtained the highest agreement among experts again, reinforcing the importance of its indicators in the model with the second round. Only “financing based on the contribution of users per inhabitant” obtained a lower score in both rounds (mean 1: 3.88 and mean 2: 3.44). These data coincide with the trend, which indicated the importance given by the experts to the dimension.
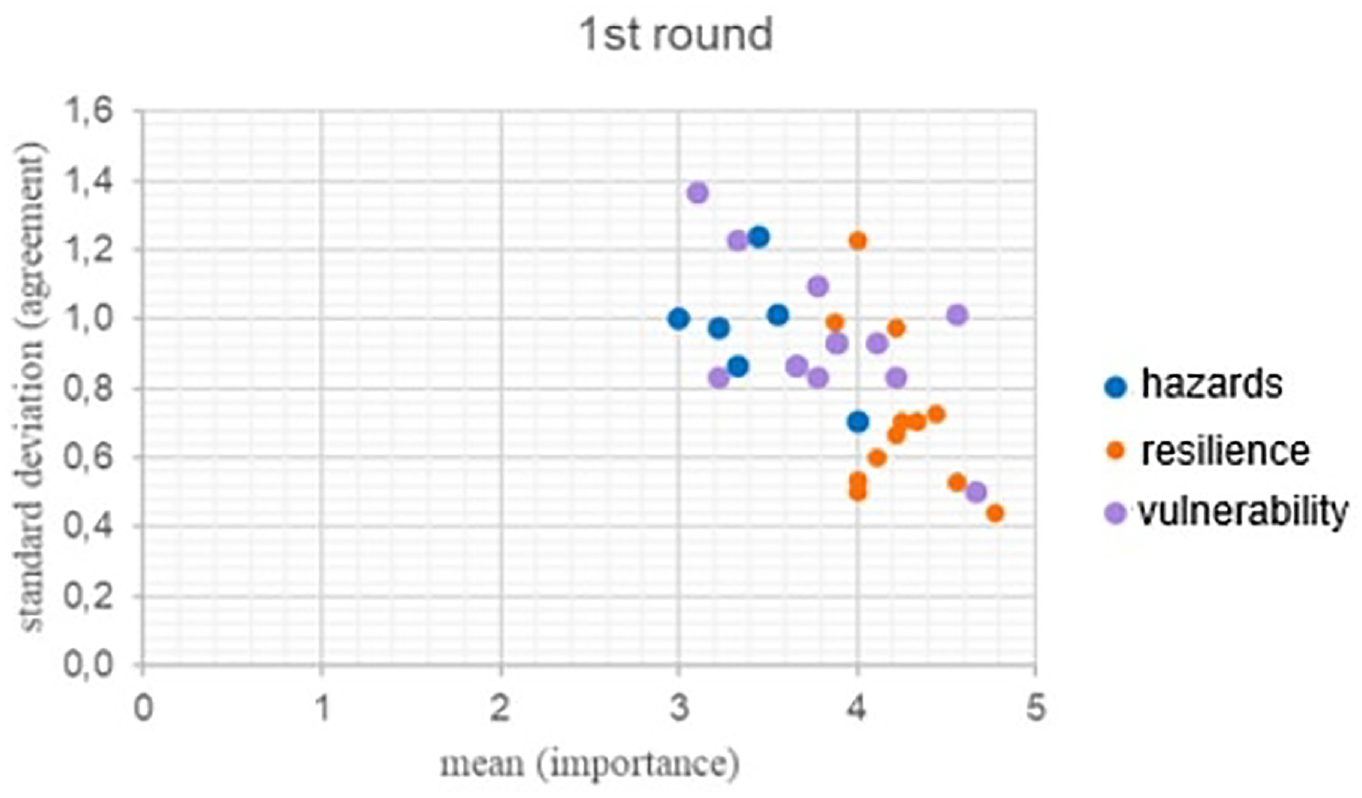
Mean (importance) and standard deviation (agreement) of the dimensions. First round.

Mean (importance) and standard deviation (agreement) of the dimensions. Second round.
The most complex dimension is vulnerability, which, despite the fact that a lower dispersion was estimated in the second round (Linstone & Turoff, 2002), is the one with a comparatively higher standard deviation. However, if we look at the mean, the degree of importance increases in the second round in almost all indicators, except for “youth employment” and “female temporary employment.”
The threats dimension, like the vulnerability dimension, in the second round, improves its degree of importance in two indicators: “population density” and “average declared net income.” It also shows greater agreement in the second round since the standard deviation is less than 1 in all items. The indicator “average declared net income” is the most positively evaluated in both the first and second rounds (mean 1: 4; mean 2: 4.33).
Regarding the open questions, the recommendations made by the experts were included in the second questionnaire. After the qualitative analysis, it was considered to add four new indicators: “number of registered contracts by type of working day,”“real estate by age of construction,”“real estate by construction quality” (vulnerability dimension) and “degree of urbanization” and “percentage of population by type of cell” (threat dimension). Two of them have been included in the final proposal (“number of registered contracts according to type of working day” and “real estate according to construction quality,” since the rest obtained a modal value of 2.
On the other hand, to determine the final model, the items which scored a modal value of 3 in the second round were included or not, depending on the first quartile (Table 3), that is, if 25% of the data is less than or equal to 3, or, in other words, if 75% of the experts rated the item as important or very important. Thus, the criterion followed for the inclusion of the indicators in the model is that the first quartile should be located at 3 or higher.
To summarize, in the vulnerability dimension, the first round started with a total of 11 indicators. In the second round they were expanded to 14, three more; and lastly, 10 indicators were included in the model. For the hazards dimension, 8 indicators were included in the first round, one more was added in the second round and for the final proposal 6 indicators have been included. The resilience dimension is the only one that maintains the 18 indicators in all phases. Figure 5 shows the final proposal agreed upon by the group of experts (Figure 5), which will later be submitted again for validation by a group of stakeholders.
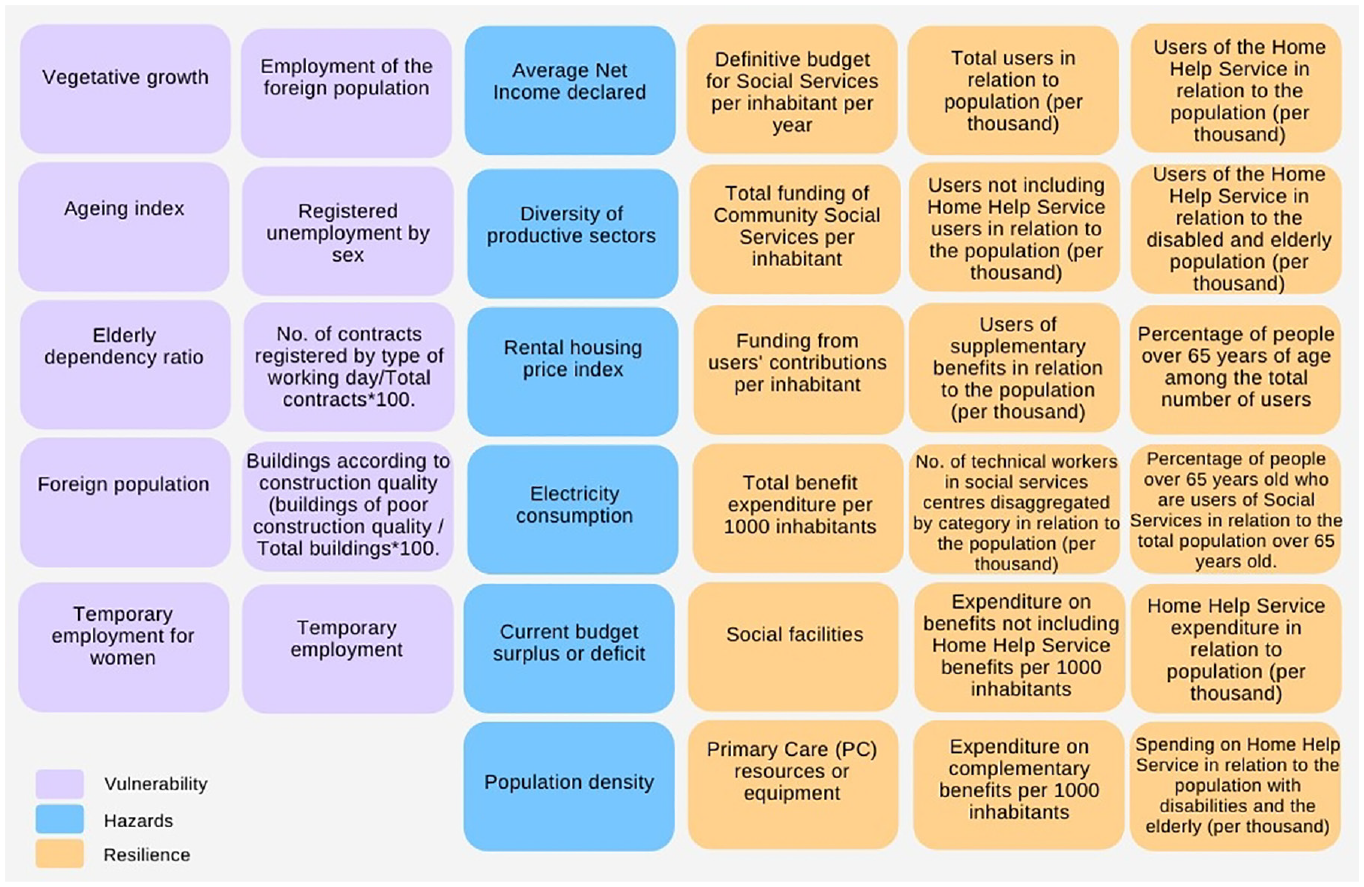
Final model of dimensions and indicators for risk assessment.
Conclusion
This article presents the process of conducting an expert consultation through the modified Delphi technique, with the aim of proposing a risk assessment tool for social services. To test the content validity of the tool, a multi-method process was carried out, involving qualitative and quantitative evaluation and analysis of the results of these evaluations.
The evaluation of the proposal was carried out in two phases and descriptive statistics such as mean, mode and standard deviation were used to determine the degree of importance of the indicators for each dimension and the degree of agreement achieved by the experts.
From the analysis of data obtained in the two rounds, we evident a consensus in relation with the content validity of the final proposal, especially in the resilience dimension. However, all the indicators included in the model have a mode between 4 and 5, and those that have obtained a mode of 3 have been evaluated in quartile 1, with 75% of the opinions being between 4 and 5.
The original model submitted for assessment by the panel of experts was composed of 37 indicators, 11 from the vulnerability dimension, 8 from the hazard dimension and 18 from the resilience dimension. Once the experts’ contributions and assessments were incorporated, the final model was reduced to 34 indicators (10 vulnerability, 6 hazard, and 18 resilience) as shown in Figure 5.
The results presented in this paper correspond to the first phases of the methodology used to validate and test the model of indicators proposed to develop the risk index applied to social services through the application of expert consultation using the modified Delphi method. This article sets out the steps that have been taken in this methodological process and the results obtained.
The final proposal can be considered a valid and reliable instrument, capable of predicting and assessing the risk and impact on Social Services in different emergency situations, such as, the pandemic. However, the content validity coefficient can be enhanced, improving the score obtained. To this end, in a subsequent investigation, a group of stakeholders will weigh the items based on three criteria: the level of impact that the COVID19 pandemic has had on the indicator, the reversibility of the indicator, that is, the ease with which the element can change to a more favorable or positive state, and the capacity of the indicator to influence the social service system. Thus, the purpose of the following methodological phases of this project is to further enrich and validate the final model. For more information on the full methodological process, see Muñoz-Moreno et al. (2023).
Footnotes
Acknowledgements
We especially want to thank the team of experts who have participated in the development of this part of the work for their interest and willingness to collaborate with us in the assessment of the indicators that make up the model.
Author Contributions
Elena Ferri: conception and design of the study; conducting the Delphi; analysis and interpretation of the data; writing the article. Rocío Muñoz: conception and design of the study; exploration of indicators in the databases; drafting of the article. Ana Vallejo: study conception and design; Delphi; preparation of tables and figures and Octavio Vázquez, study conception and design, contacting and communicating with experts, writing the article.
Declaration of Conflicting Interests
The author(s) declared no potential conflicts of interest with respect to the research, authorship, and/or publication of this article.
Funding
The author(s) disclosed receipt of the following financial support for the research, authorship, and/or publication of this article: This work is funded by the R+D+i aid program (European Commision and Junta de Andalucía), on a competitive basis, within the scope of the Andalusian research, development and innovation plan (PAIDI 2020), within the research project “Risk and impact of covid-19 in the Andalusian social services system. IRIS” [P20-00747].
Ethics Statement
Not applicable.
Data Availability Statement
Data sharing not applicable to this article as no datasets were generated or analyzed during the current study.