
Abstract
With the slowdown of its economic growth, China’s domestic coal industry is facing more and more serious overcapacity. Multiple government departments have jointly proposed that the coal industry should undergo mergers and reorganization to ease this overcapacity, enhance industrial concentration, and optimize production layout. This study thus combines the resample slacks-based measure (SBM) model and potential merger gains model to pre-evaluate the gains from potential mergers and acquisitions (M&As) before making any final decision about them. With a focus on prevaluating efficiency gains before potential M&As instead of efficiency gains after them, we take China’s listed companies in the coal mining and washing industry as the research sample. The data used to evaluate the efficiency from potential M&As come from their annual financial reports from 2013 to 2016. Empirical results show that some mergers of listed coal companies lead to improved efficiency, but not all mergers can bring efficiency improvements. We also find that the most efficient companies are not necessarily the best M&A targets, and that companies suitable for M&As are those in the stage of expansion. In addition, the empirical results confirm that combinations between large coal companies and between cross-listing companies are more efficient.
Introduction
Coal is China’s basic and most important energy source and raw material. From 1980 to 2015, according to the calculation method of electric heating equivalent, China’s coal consumption accounted for 75.3% of total energy consumption based on its total energy consumption and composition statistics over the years (1980–2015) from the China Energy Statistical Yearbook of 2016. In recent years, this proportion has declined slightly, accounting for 68.1% in 2015 based on the country’s total energy consumption and composition statistics over the years (1980–2015) from the China Energy Statistical Yearbook of 2016. Within its primary energy structure, coal has long been the main source of energy and has played a key role in its domestic economy. However, with the slowdown of economic growth and the adjustment of the country’s energy structure, China’s coal industry is suffering from excessive capacity, low coal prices, and substitutes from clean energy (Y. Wu et al., 2017).
According to the China Coal Association, by the end of 2015, China’s total coal production capacity was 5.7 billion tons, but in 2016, the coal industry cut production capacity by 290 million tons. 1 In 2016, China’s raw coal output was 3.36 billion tons, and the capacity utilization rate was only 62.1%. 1 In addition, the coal industry has low concentration, and companies’ competitiveness is weak. Inefficient companies thus take up a lot of resources.
In the context of coal’s overcapacity, the government actively promotes mergers and acquisitions (M&As) of coal companies, encourages the integration of large companies, and promotes the efficiency of coal production and intensification of coal industry. During the period 2011–2015, China’s coal industry eliminated 7,100 outdated coal mines that averaged 550 million tons of combined annual production capacity, based on China’s 13th Five-Year Plan. As of May 2017, the number of companies in the coal industry was 5,058, down 9.5% from the end of 2016 based on data from the National Bureau of Statistics of China. 2 The concentration of the coal industry during the period 2009–2015 has increased year by year. In 2015, the industry CR4 (concentration ratios) was at 24.6% and CR10 at 43.2%, reaching a peak in these years, based on Wind Information and Founder Securities Research Institute. From an international perspective, the energy landscape has undergone significant adjustments, presenting the dual trends of cleanliness and low carbonization. The proportion of coal consumption has declined, and coal production has gradually become more intensive and efficient. Along with the change in the global coal production structure, the number of coal mines has continued to decrease, and the average size of coal mines has continued to expand.
China’s 13th Five-Year Plan proposes to accelerate the optimization and upgrading of the coal industry structure, promote M&As and reorganizations of coal mining companies, foster large-scale backbone company groups, increase industrial concentration, and strengthen market control and anti-risk capabilities. The execution of M&As of large coal companies is one important way for the industry to undergo de-capacity. Specifically, China’s 13th Five-Year Plan proposes that by 2020, coal production and development will be further concentrated under large coal bases, and the aggregate output of them will account for over 95%. In addition, it also plans for the number of coal companies to be less than 3,000, and large companies with a production capacity of 50 million tons or above will account for more than 60% of total production.
In China’s current economic and policy context, the pre-efficiency assessment of coal company M&As is particularly important. Based on Great Wall Securities Research Institute, from 2014 to the first quarter of 2016, the coal industry experienced nine M&As, with an average transaction size of RMB 2.23 billion. However, from their annual reports, most M&As did not improve the return on equity (Kristensen et al., 2010). This shows that blind M&As do not necessarily lead to efficiency improvement, and pre-efficiency assessment can provide a good basis for corporate M&A decisions—that is, a pre-assessment of efficiency can better help companies to rationally choose merger targets to improve efficiency after M&As.
Chinese coal companies are mostly state-owned enterprises (SOEs). The top 10 companies in the coal industry in 2015 are all SOEs. In 2015, the total assets of the coal industry were RMB 5.4 trillion, while the total assets of coal SOEs were RMB 3.7 trillion based on National Bureau of Statistics and Founder Securities Research Institute. With the government actively promoting M&As in the coal industry, the policy will have a huge impact on the coal industry dominated by SOEs. Therefore, pre-merger efficiency assessment is particularly important for policy implementation.
Horizontal M&As can achieve economies of scale, reduce transaction costs, and increase efficiency. On the contrary, they may also cause monopolies and hinder-free competition in the market, thereby reducing industrial efficiency. In the efficiency defense of a horizontal merger anti-monopoly review, a company can obtain M&A approval from the anti-monopoly authority only if it can confirm that the merger may produce efficiency gains that can offset the anti-competitive effect and increase overall social welfare levels (Röller et al., 2000). Thus, there is an urgent need to quantify the efficiency of M&As to measure their feasibility for coal companies.
Many scholars have used the theory of scale economies to establish empirical models of mergers’ potential gains to conduct pre-efficiency assessments (Bagdadioglu et al., 2007; Bogetoft & Wang, 2005; Halkos et al., 2016; Halkos & Tzeremes, 2013; D. D. Wu et al., 2011; Zschille, 2015). However, for ex ante evaluation, the size of efficiency is random, and the selection of assessment methods and tools also brings uncertainty (Besanko & Spulber, 1993). Taking the simulation analysis methods frequently used in the United States and the European Union as an example, factors such as different variable settings, data acquisition difficulties, and differences in models influence the accuracy of the analysis results. For the same acquisition, even if the same analysis method is used, different scholars may reach different conclusions (Choné & Linnemer, 2008).
When using data envelopment analysis (DEA) for evaluation, there are random changes that lead to inconsistent results. Simar and Wilson (1998, 2000) proposed the bootstrap method, but still could not solve the error. Some research studies, such as Barnum et al. (2011), Ouenniche and Tone (2017), and Feder (2018), proposed new methods to correct errors in DEA. This article also corrects the estimated inconsistent allocation error problem caused by DEA according to resampling DEA under the framework of Tone (2013). Tone (2013) proposed a triangle distribution method (resample method) to overcome the measurement error of input and output and eliminate the empirical allocation error. This study combines the resample slacks-based measure (RSBM) model (Tone, 2013) and potential merger gains model (Halkos & Tzeremes, 2013), which together can overcome the above defects when pre-evaluating gains from potential M&As.
Our results overall suggest that some, but not all, mergers of listed coal companies can bring efficiency improvements. Therefore, for the government, the policy of promoting M&As does not necessarily bring efficiency to all companies. The most efficient companies are not always the best M&A targets—that is, the appropriate combination is not necessarily one between strong companies. Empirical results confirm that companies suitable for M&As are in the stage of expansion, meaning companies that are in the stage of increasing scale of income are suitable for M&As, and vice versa. We also find that large companies and companies with good corporate governance are more efficient. Combinations between large coal companies and between cross-listing companies are also more efficient.
The rest of this article runs as follows. “Literature Review” section reviews the theory literature. “Methods and Data Resources” section demonstrates the methods and data resources. “Empirical Results” section discusses the major empirical results. “Conclusions and Suggestions” section concludes.
Literature Review
Coal is the most important energy source in China with domestic coal reserves quite large for the primary energy sectors (B. Wang, 2007; X. Xu et al., 2015). China had 114,500 million tons of verified coal reserves at the end of 2015 (Han et al., 2018; E. Tang & Peng, 2017). According to the calculation method of coal consumption for power generation, coal accounted for 72% of China’s energy production and 64% of its energy consumption in 2015 (E. Tang & Peng, 2017; D. Wang, Wan, & Song, 2018; Y. Wu et al., 2016; Yuan, 2018). In addition, China’s coal accounted for approximately 47% and 50% of global total production and consumption, respectively (H. Xu & Nakajima, 2016).
In the past few years, China has experienced severe overcapacity (Han et al., 2018; C. M. Li & Nie, 2017; Song et al., 2017; X. Tang et al., 2018). Up to the end of 2014, coal inventory was at 87 million tons, or 2.6% higher than that at the beginning of the year (Song et al., 2017). From 2017 to 2019, the scale of coal overcapacity in China is forecasted to be between 1.721 and 1.819 billion tons (D. Wang, Wang, et al., 2018). China’s coal overcapacity will continue, and its coal industry will face a severe challenge in the future (D. Wang, Nie, et al., 2018). Such overcapacity is attributed to the combination of an economic downturn, market failure, system distortion, squeeze of imported coal, and substitutes of clean energy (Song et al., 2017; Sun et al., 2017; X. Tang et al., 2018; Y. Wu et al., 2017).
The growth of supply, accompanied by the shrinking of demand, illustrates the importance of structural adjustment in the coal industry (Yuan, 2018). Discussions on the exit strategy of coal overcapacity mainly focus on two aspects: eliminating backward production capacity (C. M. Li & Nie, 2017) and resource integration (Cao, 2017). As the main form of resource integration, M&As in the coal industry are conducive to improving coal technology and financing capacity, inhibiting excessive growth of coal production capacity, and gradually reducing coal overcapacity (J. Zhang et al., 2011; Zhu et al., 2018).
The efficiency of M&A has been a hot topic in management and economics research for a long time, presenting two analysis directions. One is the ex post efficiency evaluation that assesses whether the merger has improved the efficiency of the manufacturer. The second is the efficiency assessment beforehand that determines whether M&A can improve the efficiency of manufacturers in the future. Many existing studies in the M&A efficiency evaluation literature focus on ex post efficiency analysis.
Grigorieva and Petrunina (2015) looked at the performance of M&A deals in emerging capital markets based on the economic profit model and compared the results with ones obtained by means of the traditional method of accounting studies and found that M&As are value-destroying deals for the combined firms. Schiffbauer et al. (2017) applied propensity score matching and a difference-in-difference (DID) estimator to estimate the effects of foreign acquisitions on firm productivity. Their results indicated that the effects of foreign acquisitions vary across industries. Bianconi and Tan (2018) used the DID method with and without propensity score matching to investigate the impact of M&A on an acquirer’s firm value and offered significant evidence of negative medium-run M&A effects and positive instantaneous M&A impact on firm value. Hassan et al. (2018) analyzed four case studies of international M&As conducted by European companies and found that M&A performance can be more accurately measured by aligning it with the motives defined by the acquiring firms.
Sami (2014) explored the impact of firm combinations in the pharmaceutical industry on financial performance. The results showed that the combination increases operating revenue and net profit, but there is no significant change in the debt-to-equity ratio and the return on equity. W. Zhang et al. (2018) explored the relationship between M&As and firm performance by running a partial least squares regression with the data of listed Chinese pharmaceutical firms from 2008 to 2016. Deyoung et al. (2009) provided a review of the recent financial institution M&A literature covering over 150 studies. The results showed that North American bank mergers are (or can be) efficiency improving while European bank mergers appear to result in both efficiency gains and stockholder value enhancement. Kedia et al. (2011) noted that horizontal M&As help to increase the efficiency of manufacturers. At the same time, vertical M&As help to increase the market value of manufacturers, especially in high concentration industries. Odagiri et al. (2011) used the event analysis method to explore Japanese M&A cases over 2000–2010 and analyzed whether the M&As help to increase the market value of the manufacturer. The empirical evidence showed that most cases do not show significant improvement in the company’s stock price.
Jin et al. (2015) used a hybrid method of DEA and Malmquist total factor productivity (TFP) indices to evaluate the short- and medium-term effects of M&As on acquirers’ performance with a set of 32 M&A cases occurring during 2000–2011 in China. C.-H. Wang et al. (2013) selected 16 biotech companies in Taiwan as research samples and used DEA to evaluate the efficiency of the country’s biotechnology industry before and after integration. The results were sound after verifying with some biomedical managers. Ferrier and Valdmanis (2004) employed DEA to analyze the efficiency of combined hospitals in the United States. The empirical results showed that these hospitals are more efficient. Kwon et al. (2008) applied DEA to evaluate the impact of U.S. telecom industry combinations on vendor performance. Empirical evidence showed that these combinations negatively correlate with efficiency. Sufian et al. (2012) utilized DEA to compare the efficiency of 34 banks in Malaysia before and after M&As. The experimental results showed that the efficiency before combination is higher than the efficiency after combination. Gugler and Siebert (2007) and Lee (2013) used DEA to evaluate the performance of semiconductor manufacturers after M&As, and the results showed that postmerger operating performance did improve. Monastyrenko (2017) addressed the effects of M&As on the eco-efficiency of European electricity producers in 2005–2013, computing eco-efficiency using DEA and the Malmquist–Luenberger productivity index, both of which are based on the radial directional distance function. However, to reduce the failure of M&As, it is necessary to reasonably predict their efficiency in advance. Therefore, the pre-evaluation of M&A efficiency has attracted the attention of many scholars (Dietrich & Sorensen, 1984; Pasiouras & Gaganis, 2007; Ragothaman et al., 2003).
Existing studies of pre-efficiency assessment mainly focus on parameter analysis methods. Garzella and Fiorentino (2014) analyzed empirical data from questionnaires and interviews with M&A experts to develop a synergy measurement model to support the decision-making process in M&A. However, they only considered candidate target companies and ignored the compatibility and potential M&A benefits of the acquirer and its candidate in the M&A decision process, thus reducing the effectiveness and accuracy of M&A forecast models to some extent (Halkos & Tzeremes, 2013). Because the evaluation system is too complex, it is often difficult to find accurate functional relationships or appropriate weights for those evaluation methods that rely on utility functions or weights. In addition, analysis through some specific indicators (such as financial indicators) only reflects the status of certain aspects of M&As, but cannot reflect their comprehensive characteristics (Feroz et al., 2002; Shestalova, 2003).
The DEA method is a powerful tool for assessing relative efficiency. In terms of M&A efficiency forecasting, the DEA approach takes the acquirer and its candidate as a virtual overall decision making unit (DMU), considering the efficiency improvement of this virtual DMU relative to the frontier. This nonparametric approach considers both the acquirer and its candidate. In addition, it does not need to determine in advance the functional relationship between input and output and does not require a subjective determination of input and output weights. Without being affected by dimension, the DEA method offers great advantages in forecasting M&A efficiency (D. D. Wu & Birge, 2012).
According to the measurement method proposed by Farrell (1957), Bogetoft and Wang (2005) used radial input-oriented DEA efficiency values to measure the potential gains from M&As. Sherman and Rupert (2006) employed DEA to benchmark the operating efficiency of each branch against “best-practice” branches within both the combined merged bank and the four individual pre-merger banks. Bagdadioglu et al. (2007) applied the potential merger gains model by Bogetoft and Wang (2005) to investigate whether proposed mergers in the Turkish electricity distribution sector promise potential efficiency enhancement, and their empirical results showed that potential integrated manufacturers can indeed improve efficiency. Kristensen et al. (2010) used bootstrap DEA to estimate the efficiency score of each hospital and estimated the potential gains from proposed mergers in Denmark in 2004 by comparing individual efficiencies with the efficiency of the combined hospitals. Their empirical results showed that potential M&As of hospitals can improve technical efficiency, but if the merged hospitals become too large, they will experience diseconomies of scale.
D. D. Wu et al. (2011) developed the dynamic DEA and the stochastic boundary model (SFA) to pre-evaluate the gains from potential M&As, economies of scale, and scale of compensation for Canadian banks. Their empirical results presented that the potential combination of banks can improve efficiency. According to Baumol et al. (1983) and their theory of scale compensation, George E. Halkos and Tzeremes (2013) proposed a bootstrapped DEA-based procedure to pre-calculate and pre-evaluate the short-run operating efficiency gains of a potential bank M&A. They investigated the degree of operating efficiency gains of 45 possible bank M&As in the Greece banking industry over the period from 2007 to 2011, noting that an M&A between efficient banks does not ensure an efficient bank M&A. Zschille (2015) used bootstrap DEA on a cross-section sample of 364 German water utilities in 2006 to analyze the potential efficiency gains from hypothetical mergers between water utilities at the counties level. Their results suggested improving the incentives for efficient operations in water supply and a consolidation of the smallest water utilities. George E Halkos et al. (2016) collected data of 97 Japanese regional banks from 2000 to 2008 and used the bootstrap data envelope method to conduct pre-efficacy assessments, finding that the potential combination of small banks is more efficient than the potential integration of large banks.
The existing coal industry literature on China mainly focuses on the evaluation and analysis of overcapacity, and there are few reasonable countermeasures. Among the proposed countermeasures, most of the them support the reduction of production capacity through mergers and acquisitions, but the quantitative analysis of the effect of M&As is rare, and thus lacks persuasiveness. Many studies in the past literature have quantified efficiency through ex post efficiency assessment, but postassessment is unable to provide a basis for government and companies to make a proper decision. There are also some scholars, such as Bogetoft and Wang (2005), Bagdadioglu et al. (2007), Kristensen et al. (2010), D. D. Wu et al. (2011), Halkos and Tzeremes (2013), Zschille (2015), and Halkos et al. (2016), who used the theory of economies of scale to establish the potential gains from a merger model to do ex-merger efficiency evaluation, thus offering more information to an authority.
DEA is a nonparametric method for assessing performance developed by Charnes et al. (1978). While Banker and Natarajan (2004) illustrated that technically random variations reduce the efficiency of one-sided deviations of monotonic production functions and concave production functions, DEA produces consistent estimations. The input-based Malmquist index of productivity developed by Fare et al. (1992) measures the change in productivity between times t1 and t2. However, Fare et al. (1992) did not distinguish between the underlying true distance functions and their estimate. Lovell (1993) measured efficiency through nonparametric methods, but there is no statistical basis for this method, and it is not possible to provide information when the estimate is uncertain.
Scholars soon began to become interested in the uncertainty caused by changes in a sample. Simar and Wilson (1998) developed the bootstrap procedure and demonstrated that the key to statistically consistent estimations of these confidence intervals is unobserved data resolving DEA inconsistencies. Tziogkidis (2012) pointed out that bootstrap DEA is a major development in the past decade, but some of its assumptions and attributes are still unclear, leading to errors, which ignore the characteristics of inputs and outputs. Barnum et al. (2011) provided an alternative to panel data analysis to calculate confidence intervals for DEA scores. They extended Simar and Wilson’s bootstrapping method using panel data and generalized least squares model. The method corrects any violation of standard statistical assumptions, but the reliability of the method still depends on the generalized least squares models.
Subsequent scholars corrected the errors and hypothesis checks generated by TFP. Diewert and Fox (2017) proposed a new decomposition of a productivity index, with the existence and properties of the underlying distance functions of the decomposition proven under relatively unrestrictive assumptions. TFP is the most important indicator to be considered in the results generated. However, one problem with the index method used for computing TFP growth is that during a recession, it shows a drop in TFP, which is quite inconceivable, because it implies technological regress (Diewert & Fox, 2018). Feder (2018) presented a new measure of TFP that also takes into account the effect of biased technological change. This methodology can distinguish between neutral factor productivity and biased factor productivity (BFP). Balk (2019) developed a fourth decomposition of aggregate TFP, which is based on the level rather than the indicator.
Most studies have taken CCR-DEA (Charnes, Cooper, and Rhodes–data envelopment analysis) or BCC-DEA (Banker, Charnes, and Cooper–data envelopment analysis) as the framework, ignoring slacks and thus generating bias. Therefore, to more accurately assess whether M&As can improve efficiency, this article combines Tone’s (2013) RSBM VRS and George E. Halkos and Tzeremes’s (2013) postacquisition potential earning model to evaluate efficiency gains of potential M&As among coal companies. Halkos and Tzeremes (2013) obtained potential gains from a merger model to explore ex-merger efficiency assessments based on the radial DEA model. Tone (2013) also proposed triangle distribution with RSBM for efficiency evaluation and to solve the estimation bias of the slacks.
In empirical corporate finance literature, firm size is commonly used as an important, fundamental firm characteristic (Dang et al., 2018). Baumol (1986), Grossman and Hart (1986), Klein et al. (1978), and Oliver (1975) provided theoretical insights, whereas Holmstrom and Kaplan (2001), Robinson (2008), and Seru (2014) presented empirical evidence to illustrate the impact of company boundaries on company behavior. Smyth et al. (1975) showed that economies of scale are sensitive to different firm size measures. Therefore, it can be presumed that the size of a company will affect its operating efficiency.
A company’s operating efficiency is also affected by corporate governance. He et al. (2015) found that inefficiency due to corporate governance is one of the main causes for lower efficiency in most Chinese manufacturing firms.
Companies listed on foreign stock markets can take advantage of advanced corporate governance systems in those markets. Coffee (1999) argued that convergence in corporate governance will occur at the level of securities regulation rather than at the level of corporate laws. That study particularly highlighted the essential but often overlooked role of securities regulation in reducing agency costs. Lel and Miller (2008) found that companies from weak investor protection regimes that are cross-listed on a major U.S. exchange are more likely to terminate underperforming CEOs than non-cross-listed companies.
Mutual monitoring is an important control mechanism (Alchian & Demsetz, 1972; Fama, 1980; Fama & Jensen, 1983; Jensen & Meckling, 1976; Z. F. Li, 2014a). Mutual monitoring of executives can alleviate agency problems (Alchian & Demsetz, 1972; Fama, 1980; Fama & Jensen, 1983; Jensen & Meckling, 1976; Z. F. Li, 2014a). Z. F. Li (2014b) suggested that mutual monitoring is a substitute for other governance mechanisms and found that the extent of mutual monitoring from the No. 2 executive positively relates to future firm value. Z. F. Li (2014a) suggested that the bottom-up monitoring provided by No. 2 executives improves firm value. In sum, company size and corporate governance characteristics may impact operating efficiency.
Methods and Data Resources
Efficiency Evaluation
The DEA method projects input variables and output variables of all evaluated units in space and then gives an estimate of efficiency ranging from 0 to 1 depending on whether the projection point falls on the production boundary. The estimate of efficiency is then used as the basis for judging the effectiveness of inputs and outputs. Farrell (1957) first proposed the concept of measuring efficiency with the production frontier, but his efficiency evaluation model applies only in the situation of a single input and single output. However, in an actual production process, manufacturers have multiple inputs and outputs. Therefore, Charnes et al. (1978) presented the data envelopment model (CCR), which solves the efficiency of multiple inputs and multiple outputs with a linear programming model at constant returns to scale (CRS), but in fact many industries are not in a CRS state. Hence, Banker et al. (1984) developed a variable returns to scale (VRS) calculation model. Both CCR and BCC are radial measure methods, or in other words, input or output is adjusted by increasing or decreasing along one direction. Tone (2001) introduced a slacks-based measure (SBM) of efficiency to make up for the CCR model’s deficiency, whereby CCR models evaluating the radial efficiency do not include nonzero slacks. This article uses the SBM model for efficiency analysis with the calculated efficiency, which has the following characteristics:
a. Unit invariance: The efficiency of the evaluated unit does not change with the measure unit of input and output.
b. Monotone: The slack of an input’s oversupply or output’s shortage will show a monotone decrease.
The SBM model can be expressed as


where
Decision-making units that do not exhibit SBM efficiency can be improved by reducing the amount of input surplus and increasing the amount of output shortage to achieve SBM efficiency. Equation 2 is the adjustment method of the decision unit that does not present SBM efficiency, where

Resample DEA Bias Correction
Resample DEA
There are still errors in DEA, such as measurement errors. Léopold Simar and Wilson (2000) and Leopold Simar and Wilson (1998) proposed bootstrap methods, suggesting that repeated sampling can be used to obtain the most efficient sample allocation. Ever since then, bootstrap DEA has been significantly developed and applied (Tziogkidis, 2012). The bootstrapping method is a type of resampling method. Existing observations are regarded as the parent for repeated sampling to overcome the original data shortage. However, it does not solve the problem of data characteristics. Tone (2013) offered a triangle distribution method (also a resample method), which mainly discusses that repeated sampling can eliminate empirical distribution errors when there are errors in input and output measures.
The triangle distribution
Using the upper and lower bias rates, this model measures the efficiency’s confidence interval of the DMU through repeated sampling. As shown in figure 1, assume the upside limit, mode, and the downside limit are respectively b, m, and a, while


Triangle distribution.
The triangular allocation function is given in Equation 4:

According to the range of the r(0 ≤ r ≤ 1) value, the z value of input and output can be obtained by the following formula:
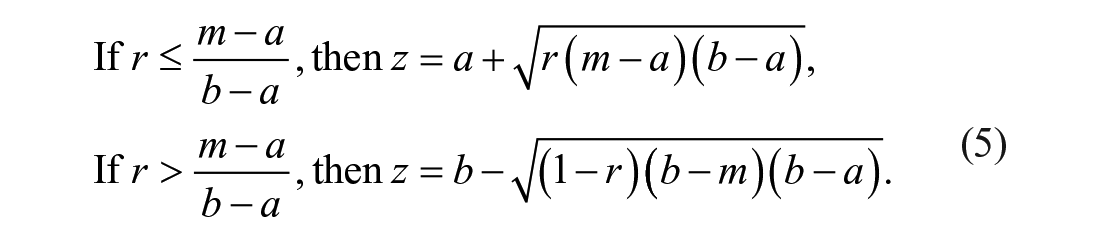
According to the above formula, the values of input and output can be found. By performing DEA estimation and resampling, we can also achieve the DMU confidence interval of efficiency.
Resample past–present–future model
Tone (2013) proposed the resample method to eliminate DEA measurement errors. Moreover, this resample method can be used to predict the future efficiency of a DMU. This model uses DMU’s past input and output data
Resample bias correction
According to the SBM DEA model proposed by Tone (2001) and the triangle distribution method proposed by Tone (2013), SBM DEA and resample efficiency are obtained after efficiency evaluation. Resample DEA bias can be calculated according to the following formula:

Among them,

Merger Potential Gains Model
According to the theory of scale compensation by Baumol et al. (1983), if there is a return on scale after M&As, then the two companies will reduce total cost—that is, the cost after the merger of the two companies is lower than the sum of the two respective costs, that is,

where
If
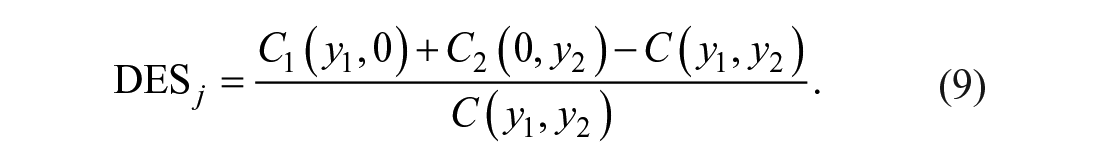
George E. Halkos and Tzeremes (2013) and George E Halkos et al. (2016) established an empirical model of merger potential gains based on the theory of Baumol et al. (1983). The formula is as follows:

where B1 and B2 represent companies, and the value of merger and acquisition (VMA) (B1, B2) represents a potential combination of B1 and B2; if
Data and Variables
This article selects coal mining and washing companies listed on the Shanghai and Shenzhen Stock Exchanges as research samples, excluding companies that are specially treated (ST) by the Securities and Exchange Commission. The sample includes 23 companies: Jingyuan Coal, Jizhong Energy, Xishan Coal, Lutian Coal, Lanhua Sci-tech Venture, Yongtai Energy, Yanzhou Coal, Yangquan Coal, Panjiang Refined Coal, Anyuan Coal, Shanghai Energy, Jinrui Mining, Hongyang Energy, Hengyuan Coal, Datong Coal, China Shenhua, Haohua Energy, Shaanxi Coal, Pingdingshan Coal, Lu’an Environmental Energy, China Coal Energy, Xinji Energy, and Yitai Coal. This article selects 2013–2017 as the study period. The data from 2013 to 2016 are derived from the public financial reports of the sample companies. The data for 2017 are estimated from the published annual reports from 2013 to 2016 by use of the resample (trend analysis) method of Tone (2013). The annual report data come from the Wind database.
The selection of useful inputs and outputs is based on whether the indicators are measurable, comparable, and consistent (Jamasb et al., 2005; Vaninsky, 2006). Financial indicators, which are under control of companies, are the main components of inputs and outputs (Fang et al., 2009). Factors such as the reliability of sources, costs, and the necessary effort of obtaining the data have to be considered (Fang et al., 2009; Geissler et al., 2015). The most widely used inputs are capital-related (e.g., total assets, operating cost) and labor-related (e.g., number of employees) indicators, whereas prime outputs remain revenue-related (e.g., sales, profit) indicators (Fang et al., 2009; Hosseinzadeh et al., 2016).
This study uses fixed assets, operating costs, and the number of employees as input variables. Fixed assets represent the input of the company’s long-term assets, reflecting the scale of the company. Operating costs in coal mining are one of the most important costs and have a direct impact on business efficiency. The number of employees represents the input of the company’s labor force. The output variable of this study is operating revenue, because it is directly related to the company’s operations and directly reflects the efficiency of the company. Figure 2 shows the selection of input and output variables.

Selection of input and output variables.
Descriptive Statistics
The study period covers 2013–2017. The data from 2013 to 2016 are derived from the public financial reports of the sample companies, whereas the data for 2017 are estimated from the published annual reports from 2013 to 2016 by use of the resample trend analysis method of Tone (2013). Table 1 shows the statistical description of the 23 listed companies in the coal mining and washing industry for the 5 years. The average value of fixed assets for the sample companies is RMB 21.211 billion in 2013 and rises to 31.856 billion by 2017. The average operating costs are RMB 21.575 billion in 2013, but decrease to 14.024 billion in 2017. The average number of a firm’s employees in 2013 is 33,339, but in 2017, it is 25,457. The average operating revenue is RMB 30.693 billion in 2013, but drops to 19.385 billion in 2017.
Statistical Description of Input Variables and Output Variables.

Figure 3 shows the trend of changes in input variables and output variables. It is clearly seen that the average fixed assets of the coal industry have increased year by year, but operating costs, number of employees, and operating revenue have shown a downward trend. In other words, the capacity of coal companies is expanding year by year, while the output is declining during the same period.

Trend of input and output variables in 2013–2017.
Empirical Results
The analysis software used in this article is DEA–SOLVER 13.0. This study uses the SBM and resample DEA models to evaluate the efficiency of listed companies in the coal mining and washing industry in China and the potential efficiency gains from M&As among these companies. From 2013 to 2017, the overall efficiency, bias correction, and potential gains from M&As of the listed companies in 23 coal mining and washing firms in China are described as follows.
Overall Efficiency and Bias Correction
Table 2 presents the resample efficiency of listed companies in the coal mining and washing industry in China from 2013 to 2017. The overall average efficiency of all companies during 2013–2017 is 0.8780. The average efficiencies of all companies from 2013 to 2017 are 0.8972, 0.9032, 0.8933, 0.8590, and 0.8375, respectively. The average efficiency has generally declined.
Resample Efficiency From 2013 to 2017.

Table 3 shows the SBM efficiency, resample efficiency, bias, bias correction efficiency, resample efficiency upper bound, and resample efficiency lower bound of the listed coal companies from 2013 to 2017. As the table shows, the average bias correction efficiency is 0.8474, and the average SBM efficiency is 0.8605. We note that the bias correction efficiency falls by 0.0131 from the original, but this adjustment is not significant. The company with the largest resample bias correction efficiency is Jinrui Mining, which has an efficiency of 1. The bias correction efficiencies of Yanzhou Coal and Datong Coal are ranked second and third, respectively. The company with the lowest efficiency is Xinji Energy with a bias correction efficiency of only 0.6206. The company with the biggest bias is Lanhua Sci-tech Venture at 0.0308. The company with the smallest bias is Jinrui Mining with a bias of 0.
Bias Correction Efficiency From 2013 to 2017.
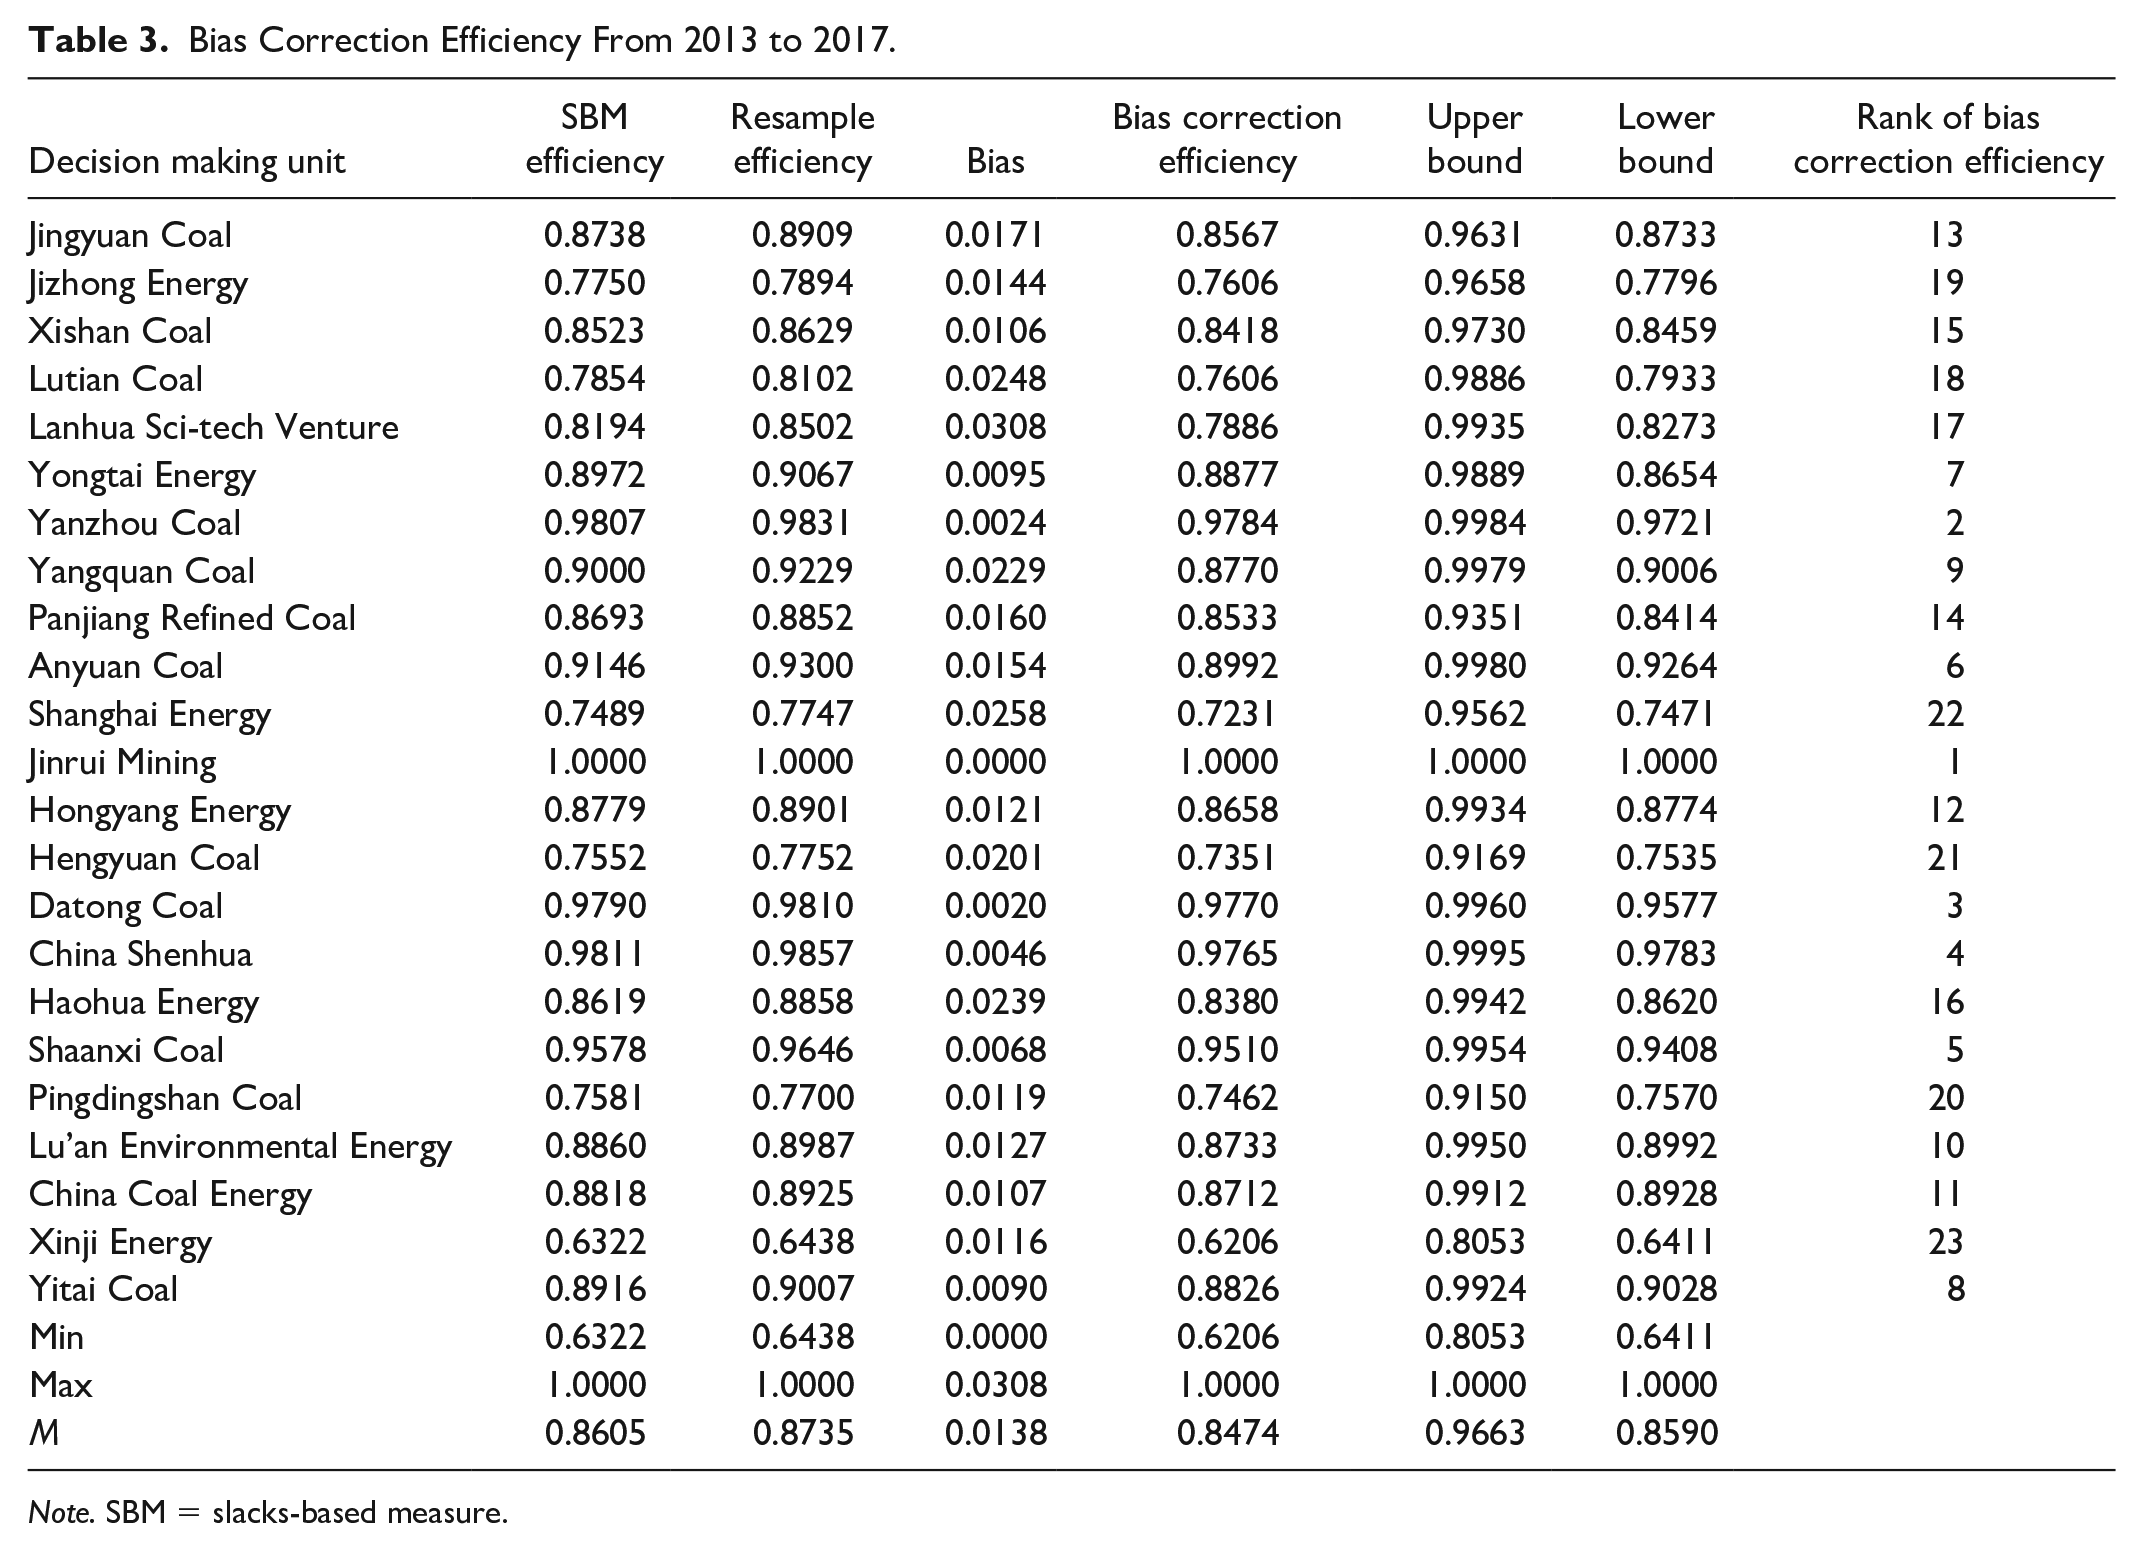
Note. SBM = slacks-based measure.
In empirical corporate finance literature, company size is commonly used as an important, fundamental company characteristic (Dang et al., 2018). There are many different proxies that can be used to measure the size of a company. According to Dang et al. (2018), the size of total sales is more related to product market and is not forward looking. Our efficiency assessment is based on product activities. Therefore, we choose total sales as a measure of company size to see whether there is a significant difference in efficiency between large companies and small companies.
We use median revenue to divide the company into large companies and small companies to investigate the difference in efficiency between them. Nonparametric test analyses are conducted, and the results of efficiency verification are shown in Table 4. We see that the efficiency of large companies is significantly higher than the efficiency of small companies.
Difference in Verification of Efficiency Due to Company Size.

Note. The value in brackets is the p value.
indicate significant at 10%.
A company’s operating efficiency is also affected by corporate governance. Z. F. Li (2014a) found that inefficiency due to corporate governance is one of the main causes for lower efficiency in most Chinese manufacturing firms.
Companies listed on foreign stock markets can take advantage of advanced corporate governance systems in those markets. Lel and Miller (2008) found that firms from weak investor protection regimes that are cross-listed on a major U.S. exchange are more likely to terminate poorly performing CEOs than non-cross-listed firms. In addition to listing in China, some Chinese coal listed companies are also listed in Hong Kong. Table 5 reports that coal companies that are cross-listed in Hong Kong and in China are more efficient than coal companies listed only in the latter. The level of significance is 5%. This demonstrates that cross-listing can improve corporate governance and increase operational efficiency.
Difference in Verification of Efficiency Due to Corporate Governance.

Note. The values in brackets are p values.
, * indicate significant at 5% and 10%, respectively.
Z. F. Li (2014a) suggested that the bottom-up monitoring provided by No. 2 executives improves firm value. We use the gap between the compensation of the CEO and that of the second-highest-paid executive scaled by CEO total compensation as the measure for monitoring capacity of the No. 2 executive (Z. F. Li, 2014b). In our study, the median of the gap ratio of the top two executives is used to divide the companies into two groups. From Table 5, we find that the efficiency of the group with a low gap ratio is higher than that of the group with a high gap ratio at the 10% level of significance. This shows that companies with strong bottom-up monitoring provided by a second executive are more efficient than companies with weak bottom-up monitoring.
Analysis of Efficiency Gains After Mergers and Acquisition
Bias correction efficiency gains—SBM and resample DEA
This article first uses SBM VRS to determine the most effective company as a potential acquisition target. Second, this article combines Tone’s (2013) resample SBM VRS and George E. Halkos and Tzeremes’s (2013) potential equity acquisition model to estimate the efficiency gains of potential coal firms after M&As. For the sake of discussion, this article selects sample firms that have the top 10 bias correction efficiencies as potential targets for mergers, resulting in 34 valid combinations.
Table 6 presents the efficiency gains of potential manufacturers after M&As during 2013–2017. Here, we see that over the 5 years, the efficiency gains of potential merged firms have positive and negative results. After any merger and acquisition, there is no guarantee that efficiency gains will occur. This result is consistent with George E. Halkos and Tzeremes (2013) and George E Halkos et al. (2016).
Bias Correction Efficiency Gains During 2013–2017.

During 2013–2017, there are positive and negative efficiency gains among potential manufacturers in each year. In 2013, there are four positive efficiency gains of potential combinations and nine negative efficiency gains, of which the most efficient potential combination is China Shenhua & Yitai Coal with an efficiency gain of 0.01910. In 2014, there are 18 positive efficiency gains and seven negative efficiency gains, of which the most efficient potential combination is Shaanxi Coal & Yitai Coal with an efficiency gain of 0.09830. In 2015, there are eight positive efficiency gains and 10 negative efficiency gains, of which the most efficient potential combination is Yanzhou Coal & Yitai Coal with an efficiency gain of 0.13550. In 2016, there are eight positive efficiency gains and five negative efficiency gains, of which the most efficient potential combination is China Shenhua & Yitai Coal with an efficiency gain of 0.14271. In 2017, there are 12 positive efficiency gains and 15 negative efficiency gains, of which the most efficient potential combination is China Shenhua & Yitai Coal with an efficiency gain of 0.17705.
Table 6 shows that the combination of China Shenhua & Yitai Coal in the 5 years of 2013–2017 has positive bias correction efficiency gains. In addition, the bias correction efficiency gains of the four combinations of Yanzhou Coal & Shaanxi Coal, Yanzhou Coal & Yitai Coal, Datong Coal & Shaanxi Coal, and China Shenhua & Shaanxi Coal are positive in each year over 2014–2017. Comparing the average efficiency gains of the five combinations mentioned above in 2014–2017, we can see that the combination of Yanzhou Coal & Yitai Coal has the highest average bias correction efficiency gain in the past 4 years, which is 0.12810. The average efficiency of China Shenhua & Yitai Coal in the recent 4 years is 0.12104, which ranks second. The efficiencies of China Shenhua & Shaanxi Coal, Yanzhou Coal & Shaanxi Coal, and Datong Coal & Shaanxi Coal rank third, fourth, and fifth in turn. Their average bias correction efficiency gains over the past 4 years are 0.05765, 0.04128, and 0.03300, respectively.
Figure 4 illustrates the bias correction efficiency gain trends of the five combinations with positive efficiency gain for 2014–2017. We see that the bias correction efficiency gain of China Shenhua & Yitai Coal increases year by year, and the bias correction efficiency gain of Yanzhou Coal & Yitai Coal continues to rise after a slight decline in 2016. The efficiency gains of these two combinations in the last 3 years exceed 10%. The bias correction efficiency gain of China Shenhua & Shaanxi Coal after the M&A in each year is about 5%. The bias correction efficiency gains of the two combinations of Yanzhou Coal & Shaanxi Coal and Datong Coal & Shaanxi Coal remain relatively low and are generally below 5% in each year.

Efficiency gain trends of potential combinations with positive bias correction efficiency gain in 2014–2017.
Taking the companies with positive M&A efficiency gain for 4 years as a sample, Table 7 gives the total assets of these companies during 2013–2017. It can be seen that the total assets of these companies have shown an upward trend between 2013 and 2017. In other words, the sizes of these companies are increasing in the context of overcapacity and shrinking industries. This shows that there is room for growth in the economies of scale of these companies. That is, these companies have not fully utilized the advantages of economies of scale and are still in the stage of increasing returns to scale. The empirical results verify that companies in the stage of rising scale returns are suitable for M&A.
Total Assets of Companies With Positive M&A Efficiency Gain for 4 Years.

China Shenhua is the largest coal company in China with total assets of RMB 571 664 million as of December 31, 2016. The empirical results show that its efficiency can be improved after a merger with Yitai Coal or with Shaanxi Coal. It denotes that further expansion of its scale can still improve its efficiency.
From Table 6, we find multiple combinations that achieve M&A efficiency gain. Companies involved in combinations with positive M&A efficiencies include Yanzhou Coal, Yitai Coal, China Shenhua, Shaanxi Coal, and Datong Coal. Their efficiency rankings are 2, 8, 4, 5, and 3, respectively. It is not always the combination of the top ranked companies that is more efficient. Yitai Coal ranks eighth in the bias correction efficiency gain, but it is a good merger target. If Yanzhou Coal and China Shenhua merge with Yitai Coal, respectively, then the resulting M&A efficiencies of the two combinations rank at the top two, meaning these two mergers can produce better synergies. In other words, the appropriate object of a merger is not necessarily an alliance between the strongest companies. Instead, the industry must focus on realizing the complementarities of resources and advantages and achieve 1 + 1 > 2, so as to improve the end company’s efficiency more quickly.
We further observe the size and governance characteristics of companies with positive M&A efficiencies. Referring to Table 8, three results are as follows. First, companies with positive M&A efficiencies are all large. This means that the synergy of the combination among large Chinese coal companies is greater than that of small companies. Second, companies with the most efficient two combinations are all cross-listed. The combination of cross-listed and non-cross-listed companies is moderately efficient. The combination between non-cross-listed companies is the least efficient. This shows that cross-listing has a positive impact on a combination’s efficiency. Third, for those mergers with positive M&A efficiency, most of them are a combination between company with a big compensation gap and company with a small compensation gap—that is, combinations between a company with strong bottom-up monitoring and a company with weak bottom-up monitoring are relatively efficient, indicating that M&A can mitigate the impact of inadequate mutual monitoring by one party.
The Size and Governance Characteristics of Companies With Positive M&A Efficiencies.

SBM efficiency gains
We use Tone’s (2001) SBM VRS in combination with George E. Halkos and Tzeremes’s (2013) potential merger gains model instead of the Tone’s (2013) resample SBM VRS model to estimate gains from potential M&As during 2013–2017. Table 9 lists the results.
SBM Efficiency Gains During 2013–2017.
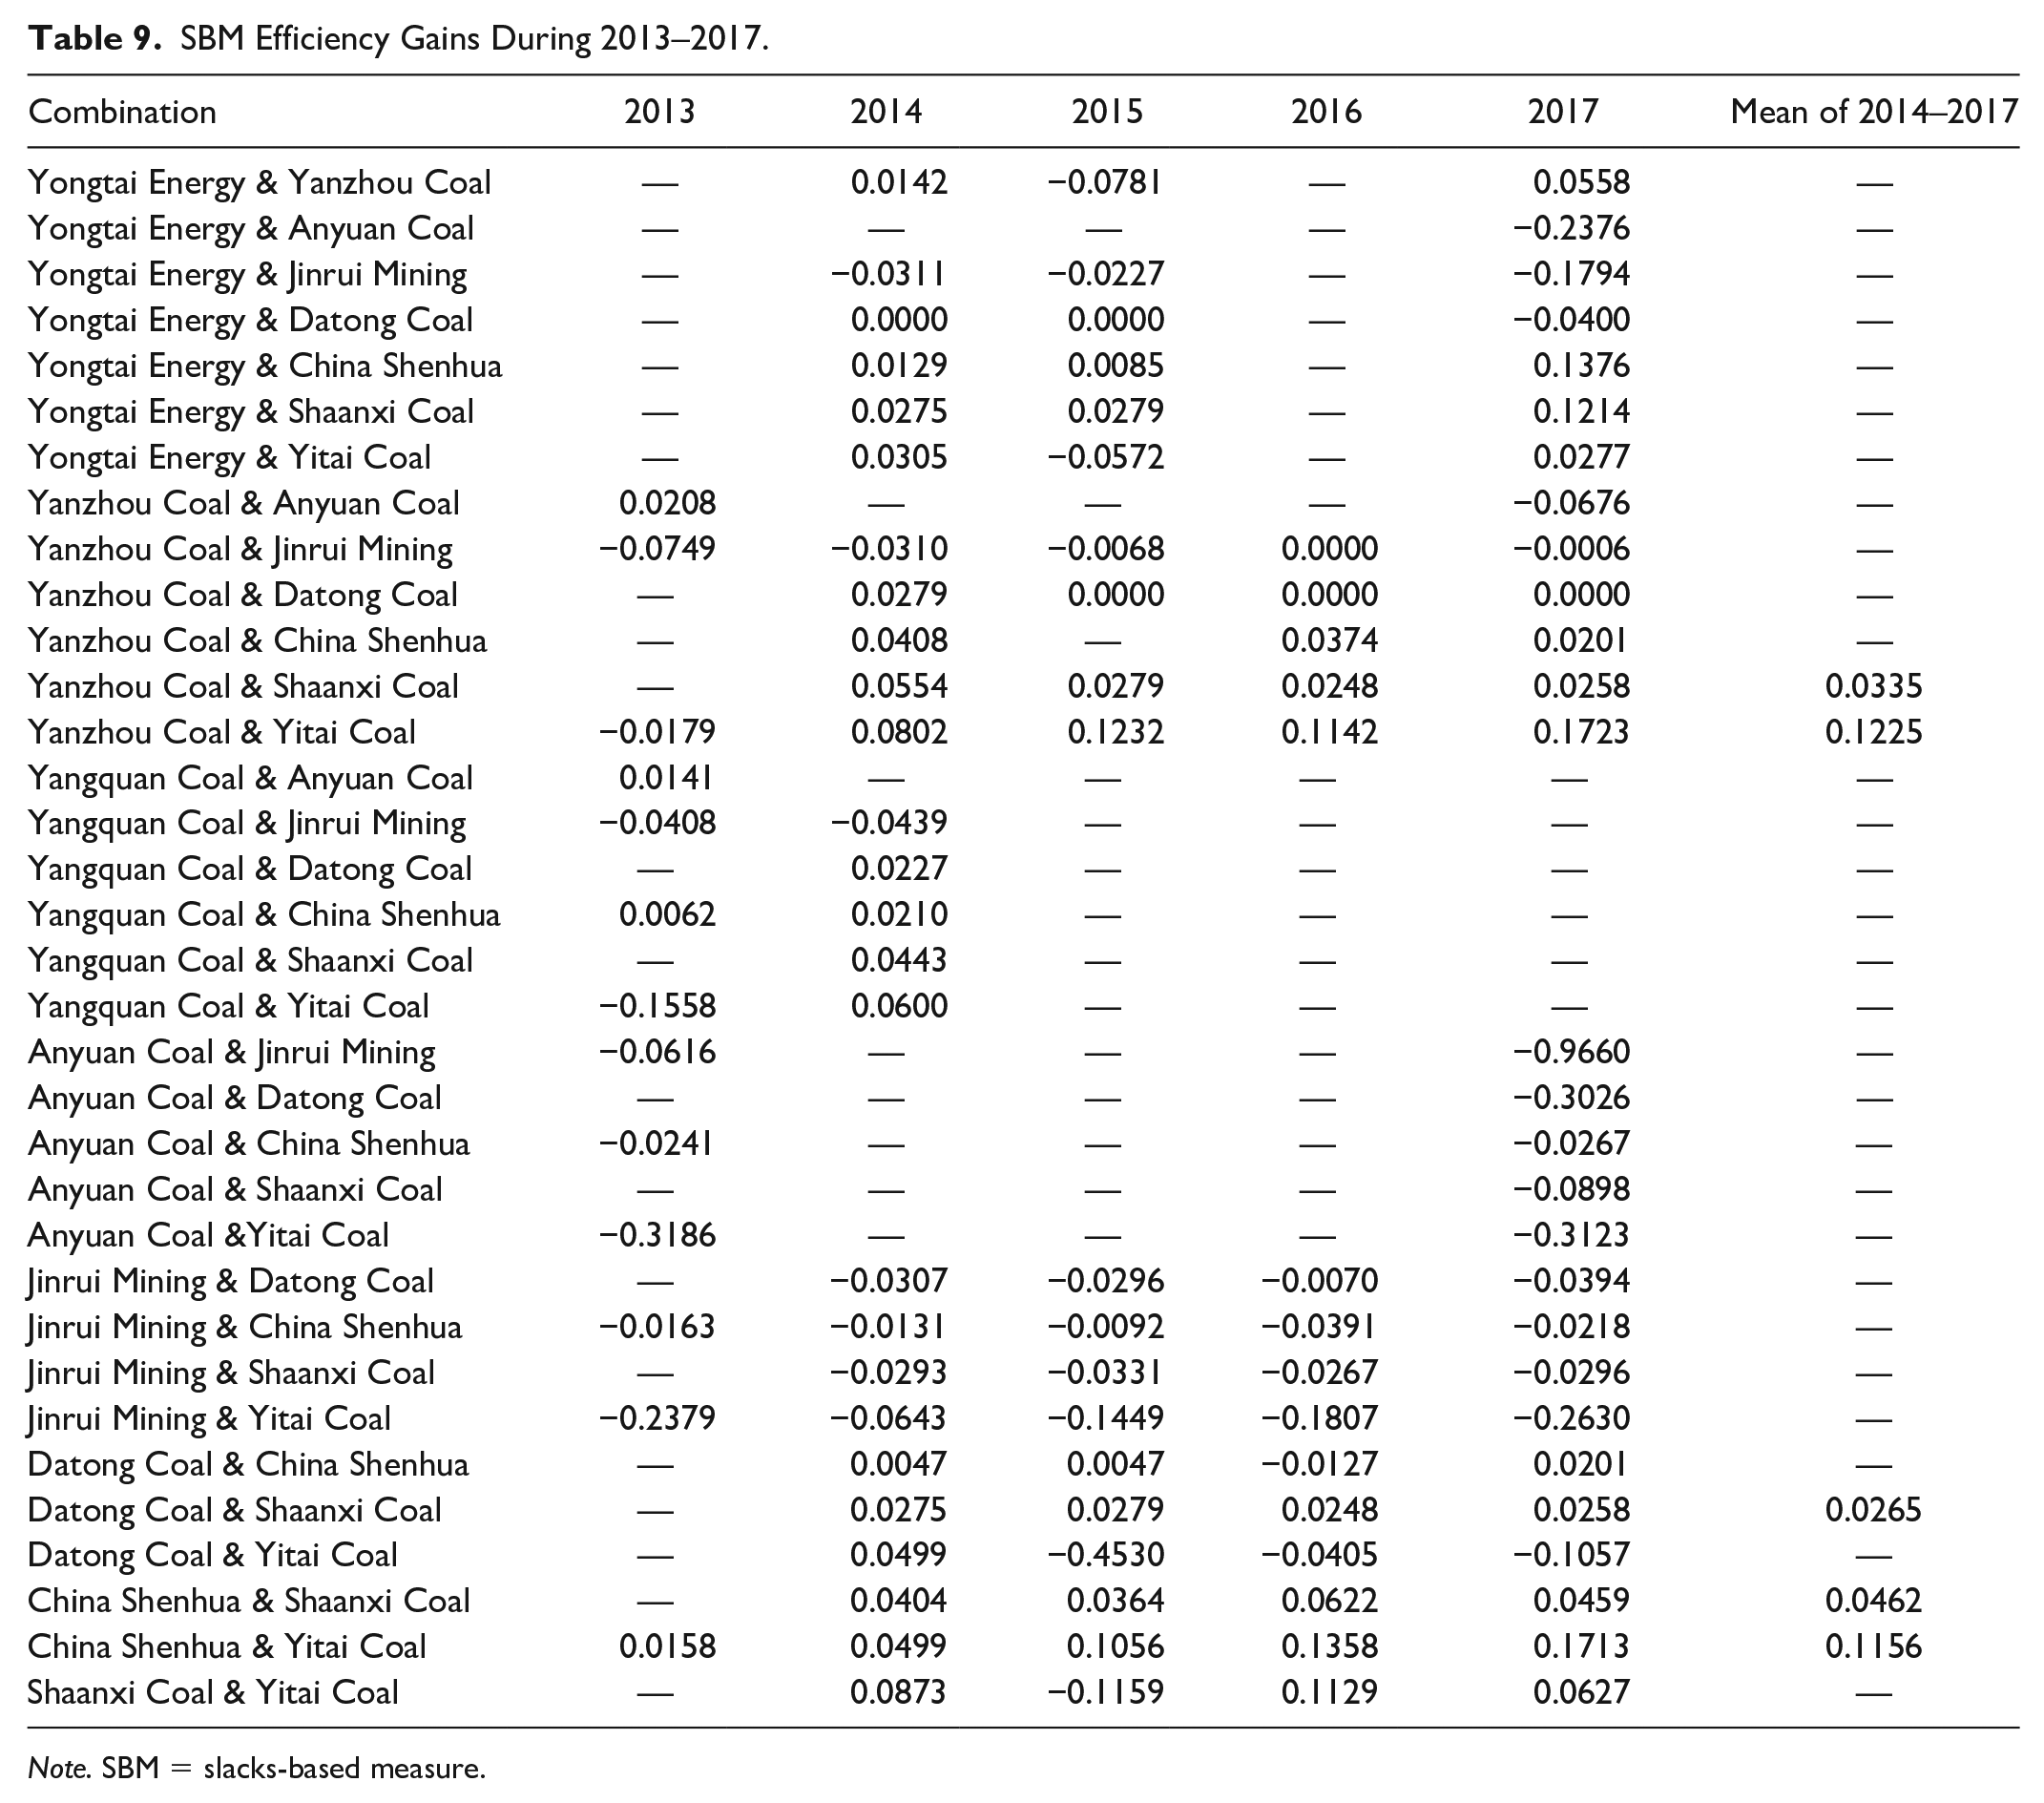
Note. SBM = slacks-based measure.
Table 9 shows that over the 5 years, the efficiency gains from potential M&As are positive and negative. This represents that after an M&A, there is no guarantee that there will be an efficiency gain. Similar to the results of bias correction efficiency gains, the combination of China Shenhua & Yitai Coal has positive SBM efficiency gain in each year over 2013–2017. The SBM efficiency gains of the combinations of Yanzhou Coal & Shaanxi Coal, Yanzhou Coal & Yitai Coal, Datong Coal & Shaanxi Coal, and China Shenhua & Shaanxi Coal are positive for each year of 2014–2017.
Figure 5 illustrates the SBM efficiency gain trends of the five combinations with a positive SBM efficiency gain in 2014–2017. These results are close to the trends of bias correction efficiency gains. The efficiency gains of the combinations of China Shenhua & Yitai Coal and Yanzhou Coal & Yitai Coal show an overall upward trend, and the efficiency gains after M&A in the last 3 years exceed 10%. The efficiency gains of China Shenhua & Shaanxi Coal, Yanzhou Coal & Shaanxi Coal, and Datong Coal & Shaanxi Coal all remain stable at low levels and are around 5% or below each year.

Efficiency gain trends of potential combinations with positive SBM efficiency gain in 2014–2017.
Conclusions and Suggestions
As China’s economic growth slows, the coal industry, which is the most important component of the country’s energy sector, is gradually experiencing serious overcapacity problems. In the context of excess capacity, the China government has actively promoted supply-side reforms and the M&A of large coal companies. An M&A can help achieve economies of scale, reduce costs, increase operating efficiency, inhibit overexpansion of individual companies, and alleviate excess capacity.
As most coal companies are SOEs, M&A policies will have a huge impact on the coal industry. Therefore, the pre-efficiency assessment of coal company M&As is particularly important. In addition, although the coal industry has experienced a range of M&As, most of them, as their annual reports suggested, did not show improvements in the return on equity (Kristensen et al., 2010). This indicates that blind M&As do not necessarily lead to efficiency improvement, and pre-efficiency assessment can provide a good basis for corporate M&A decisions.
This study combines the resample SBM VRS model (Tone, 2013) and potential merger gains model (George E. Halkos & Tzeremes, 2013) to pre-evaluate efficiency gains from potential M&As in 23 coal mining and washing companies in China. By employing this method, we are able to eliminate empirical distribution errors when there are errors in input and output measures and pre-evaluate M&A efficiency. Our results offer significant policy implications for M&A in China’s coal mining and washing companies as follows.
First, our conclusions show that some but not all mergers of listed coal companies can bring efficiency improvements. Therefore, for the government, the policy of promoting M&As does not necessarily bring efficiency to all companies. The advantage of a pre-assessment of efficiency is that it can simulate the efficiency change in the merged company, thus avoiding a waste of resources caused by unreasonable M&As. Therefore, the government should actively carry out reliable pre-assessments and selectively promote M&As between companies without rushing any case.
Second, empirical results show that the most efficient companies are not always the best M&A targets—that is, an appropriate combination is not necessarily an association between strong companies. M&As should focus on the complementarities of resources and advantages. Therefore, a company selecting an M&A target should not only rely on the existing business efficiency of the target company, but also fully consider the synergy created by the merger. A more efficient M&A target can be identified through an appropriate pre-merger efficiency assessment.
Third, empirical results confirm that companies suitable for M&As are in the stage of expansion. Our empirical results show that the total assets of companies with positive M&A efficiency gain are still increasing, indicating that they have not fully utilized the advantages of economies of scale and are still in the stage of increasing scale returns. Therefore, the M&A policy should not adopt a one-size-fits-all approach. It should be classified according to the situation of scale return. Companies that are in the stage of increasing scale of income are suitable for M&As, and vice versa.
Fourth, by the analysis of size and governance characteristics of companies with positive M&A efficiencies, we find the following: (a) The synergy of the combination among large Chinese coal companies is greater than that of small companies; (b) cross-listing has a positive impact on combination efficiency; and (c) the combinations between a company with strong bottom-up monitoring and a company with weak bottom-up monitoring are relatively efficient.
Fifth, our empirical results show that large companies and companies with good corporate governance are more efficient. We choose total sales as a measure of company size and find the efficiency of large companies is significantly higher than the efficiency of small companies. We find coal companies that are cross-listed in Hong Kong and in China are more efficient than coal companies listed only in the latter. This demonstrates that cross-listing can improve corporate governance and increase operational efficiency. Our empirical results also show that the efficiency of the group with a low gap ratio is higher than that of the group with a high gap ratio. This means that companies with strong bottom-up monitoring provided by a second executive are more efficient than companies with weak bottom-up monitoring.
Footnotes
Acknowledgements
The authors are very grateful for the insightful comments and suggestions of two anonymous reviewers and the Editors, which have significantly improved this article.
Declaration of Conflicting Interests
The author(s) declared no potential conflicts of interest with respect to the research, authorship, and/or publication of this article.
Funding
The author(s) disclosed receipt of the following financial support for the research and/or authorship of this article: This research is funded by the National Social Science Foundation of China (Project No. 17ZDA087).