
Abstract
This study aims to evaluate the innovation performance of the Turkish banking industry. For this purpose, eight different financial and nonfinancial criteria are identified as a result of literature review. Moreover, five biggest Turkish deposit banks are selected as alternatives. Interval type 2 fuzzy decision-making trial and evaluation laboratory (IT2 FDEMATEL) is taken into account to weight the dimensions. On the other side, to rank the alternatives, interval type 2 fuzzy Vise Kriterijumska Optimizacija I Kompromisno Resenje (IT2 FVIKOR) approach is considered. The findings show that market share and return on investment are the most important factors in the innovation performance of retail banking services. This situation gives information that the when banks are more successful in the market, they can make investment to the innovation more effectively. The main reason is that these banks have enough capacity to make this kind of investments. Thus, it is recommended that Turkish banks should first make an efficiency analysis to increase their profit margin so that their capacities can be improved. For this purpose, many different factors should be taken into account by Turkish banks, such as personnel competency and technological development. Within this scope, these banks should make financial analysis of the innovation effectively by generating a qualified team. However, necessary research and development activities should be conducted to reach this objective. Hence, it can be possible to minimize ineffective innovation for the banks.
Introduction
There is high competition in the banking industry all over the world. In this environment, especially small banks face difficulties to cope with this competition. Therefore, they mainly take some new actions to increase their competitive powers. Otherwise, it can be very difficult to survive in this competitive environment. For this purpose, they make new innovations to be different from their rivals (Berraies & Hamouda, 2018). Within this scope, some of these banks generate new products and services and some others make investment to improve their alternative distribution channels. For instance, new credit cards, which provide different opportunities, can be very helpful for these banks to gain competitive power. In this context, the credit cards that give bonuses for airline tickets can attract the attentions of the people who regularly use planes in their lives (Esmaeilpour et al., 2016). In addition to them, providing various banking services in alternative teller machines (ATMs) and internet banking can have a contribution to increase customer satisfaction.
However, it is not easy to make innovation in the banking sectors. The main significant point of the banking industry while making innovation is that many different factors should be taken into consideration at the same time (Hu & Xie, 2016). For example, customer expectations should be understood, and innovation should be done according to these expectations. Otherwise, the products and services, which cannot meet expectations, will not be preferred by the customers, and this situation negatively influences the profitability of the banks. Because of this situation, first, banks should make a detailed analysis to understand the expectations of their customers (Huang et al., 2018). Also, the thoughts of different parties in the country should be taken into account.
Another important issue is that financial analysis of these new innovative products should be made so that investment decisions should be taken according to these results. The main reason for this situation is that the banks cannot be appropriate to generate new products and services with respect to the financial issues (Kaushik & Rahman, 2015). For instance, if the liquidity power of the bank is not strong, new product generation may cause some financial problems. In addition, technological infrastructure is another key issue to make effective innovation. It is obvious that the banks, which do not have enough technological power, can face difficulties to generate innovative new products and services. Furthermore, the quality of the employee also plays a key role for making innovation (Wachira & Ondigo, 2016). In this scope, banks should pay attention to employ people with critical thinking.
Moreover, it is also significant to measure the innovation performance of the banks. In this framework, methodology plays a crucial role for this measurement. Multicriteria decision-making (MCDM) methodology is preferred to make decisions under the complex environment (Dinçer et al., 2019). In these methods, many different items can be considered to reach the objective. In addition to them, fuzzy logic is also helpful for this purpose because it considers expert opinions instead of quantitative data (Dinçer & Yüksel, 2019). This situation expects to reach more appropriate results because all important items can be evaluated. On the other side, using interval type 2 (IT2) fuzzy logic becomes also popular especially in recent years. The main advantage of this approach is that it minimizes the uncertainty caused in type 1 fuzzy sets.
In this study, it is aimed to evaluate the innovation performance of the Turkish banking industry. The main reason for selecting Turkey is that it made many structural reforms in the banking sector after the 2000 financial crisis. In this period, Banking Regulation and Supervision Agency was formed and new laws have been developed to increase the efficiency of the banking system. Hence, after this period, the banking sector in this country became more transparent and it is thought that this situation has a positive effect on the sustainability of the sector. Owing to this issue, Turkish banks made significant innovation to increase their market shares and attract the attention of the consumers.
In the first stage of the analysis process, eight different financial and nonfinancial criteria are selected by assessing similar studies in the literature. These criteria are weighted by using interval type 2 fuzzy decision-making trial and evaluation laboratory (IT2 FDEMATEL) approach. The main advantage of considering this approach is that causality analysis between the factors can be performed. In the second stage of the analysis, five biggest Turkish deposit banks are selected as alternatives. These banks consist of 55% of total assets and 61% of total profit of the Turkish banking industry. Thus, it is thought that these banks represent the whole Turkish banking sector appropriately. On the other side, interval type 2 fuzzy Vise Kriterijumska Optimizacija I Kompromisno Resenje (IT2 FVIKOR) method is considered to rank these five banks. In this methodology, the closest solution to the ideal one is taken into account, which is accepted as an important benefit of this methodology.
The main novelty of this study is presenting evaluation criteria set for the innovation in the banking industry. These factors can be taken into consideration by both academicians and policy makers. In addition to this issue, the weighted results of these criteria can be considered by Turkish banks to improve themselves. Another important point is that using IT2 fuzzy logic in the analysis process increases originality of this study. Moreover, with the help of the DEMATEL approach, the relationship between the factors can be identified. Hence, it can be much easier to provide recommendations to improve innovation capacities of the banks. This situation has a positive influence on the sustainable economic development of the country. Therefore, it is believed that this study makes a contribution to the literature.
The content of this study consists of five different sections. In the first part, general information about the subject is shared. In this context, the issues regarding the importance of the banking sector, the structure of competition and innovation are included. The second part of the study consists of literature review. In this context, other studies addressing this issue are summarized. The third part of the study describes the methods used in the analysis. In this context, IT2 FDEMATEL and IT2 FVIKOR methods are detailed. The fourth part of the study includes the results of the analysis. In addition, strategy suggestions are presented in the last part of the study.
Literature Review
The literature of the innovation in the banking industry has a wide scope. Within this context, the most popular theory regarding this issue is the diffusion of innovation (DOI) theory. This is one of the most significant theories in this area, which aims to explain how new ideas in the company should develop and transfer between the departments of this company (Rogers, 1962). In this framework, many different researchers in the literature focused on the relationship between financial innovation and competition for the banks. Huang et al. (2018) did a study to evaluate the innovation in Taiwan’s banking sector. In this framework, a simultaneous stochastic frontier model is taken into consideration. They reached a conclusion that making financial innovation is a significant way of increasing competitive power. Hu and Xie (2016) also emphasized the similar issue for the Japanese banking industry. In addition to these studies, Cornaggia et al. (2015) and Tabacco (2015) aimed to evaluate this issue for different country groups. Panel regression and logit methods are taken into account in these studies. They mainly identified that in a competitive environment, banks mainly focus on innovative products and services to improve their competitive powers. On the other side, Parameswar et al. (2017) and Verdier and Mariotto (2015) also determined that banks should make innovations to survive in a competitive environment.
In addition to them, some other studies also underlined the importance of technological improvement on the financial innovation competencies of the banks. For example, Kuzmenko and Ovcharenko (2018) tried to examine the innovation capacity of the banking sectors in Ukraine. Within this context, regression analysis is used for this purpose. It is found that quality of technology of banks is improved to make better innovation. Similar to this study, Mutahar et al. (2017) also focused on this situation for Yemen and reached the same conclusion. Moreover, Kaushik and Rahman (2015) conducted a survey analysis to determine the significant indicators of generating effective innovative products and services. They mainly defined that banks should have necessary technological power to reach this objective. On the other side, Yaw Obeng and Mkhize (2019) interviewed customers in Ghana to understand the key points in innovative product development process. They underlined the importance of technological efficiency in this process. Furthermore, Bajada and Trayler (2015) and Willhaus (2016) also found that banks can make more successful innovations in the case of better technological improvement.
Moreover, the relationship between customer satisfaction and innovation in the banking sector was also assessed in many different studies. As an example, YuSheng and Ibrahim (2019) focused on the advantages of making innovation for the banking sector in Ghana. In the analysis process, a survey is conducted with 450 customers of commercial banks. They determined that service innovation has a positive influence on the customer satisfaction in the banking industry. Vukosavljević et al. (2015) also carried out a survey to understand the main issues of innovation capacities of the banks. They reached a conclusion that the banks, which are preferred by customers, can generate more innovative products and services. However, Taghizadeh et al. (2018) tried to understand the main determinants of innovation capacities of banks. For this purpose, structural equation model is created with 253 managers representing 26 banks in Bangladesh. They concluded that innovative products could have a contribution to increase customer satisfaction. Obeng and Mkhize (2017) also concluded that customer loyalty can be provided for banks in case of making innovations. In addition, some researchers also identified that innovation should be customer oriented for banks to become successful (Berraies & Hamouda, 2018; Sigurdardottir, 2017; Zengin, 2019).
Furthermore, the effects of financial innovation on the performance of banks were evaluated by many researchers. In this framework, most of the researchers argued that there is a positive correlation between innovative products and performance of banks. For instance, Mustafa et al. (2018) tried to identify the main indicators of the commercial banks’ performance in Kenya. They defined these variables by considering Capital adequacy, Asset quality, Management, Earning and Liquidity and Sensitivity (CAMELS) dimensions. As a result, it is stated that financial innovation leads to higher profitability of banks. Parallel to this study, Wachira and Ondigo (2016), Nawaz and Haniffa (2017), and Victor et al. (2017) also identified that there is a positive correlation between financial innovation and banks’ profitability. In addition, Omondi et al. (2017), Rajapathirana and Hui (2018), and Esmaeilpour et al. (2016) also underlined the positive impact of the innovation on the financial performance of the banks in their studies.
In addition to these issues, there is also wide literature regarding fuzzy DEMATEL approach. Within this context, Lin et al. (2018), Kazancoglu et al. (2018), and Pourjavad and Shahin (2018) aimed to evaluate the performance of the supply chain management. For this purpose, first, necessary criteria are listed by the authors and they are weighted with the help of fuzzy DEMATEL methodology. In addition to these studies, Addae et al. (2019), Dong and Huo (2017), and Jeong and Ramírez-Gómez (2018) tried to evaluate significant issues in the energy industry by considering fuzzy DEMATEL methodology. Moreover, especially in the last years, it can be seen that there are many different studies in which the DEMATEL method is considered with IT2 fuzzy logic. For instance, Dinçer et al. (2019, 2020), Wang et al. (2019), and Pandey et al. (2019) used this methodology fwor different purposes, such as evaluation of customer expectations, performance measurement of financial services, and causality relationship in mobile applications.
On the other side, fuzzy VIKOR approach was also preferred by many researchers in the literature. Within this context, Gul et al. (2019), Wang et al. (2018), Shen et al. (2019), and Mete et al. (2019) tried to evaluate the risks in different industries, such as construction, mine, technology, and energy. After identifying significant criteria with respect to the risks, important factors are ranked by using fuzzy VIKOR methodology. In addition to these studies, it can also be seen that supplier selection is another important subject in which fuzzy VIKOR approach is taken into account. For instance, Awasthi and Kannan (2016), Sharaf (2019), and Bahadori et al. (2017) aimed to select the best supplier by considering this methodology. On the other side, it is understood that there are limited studies in the literature with IT2 fuzzy VIKOR (Liu et al., 2018; Wu et al., 2019).
As a result of the literature review, it is defined that financial innovation concept was evaluated in many different studies. In addition to this issue, the effects of financial innovation on many significant factors were analyzed. It is seen that there is a need for a new study that evaluates financial innovation in the banking industry by using a new methodology. It is understood that the authors mainly focused on survey, regression, and structural equation modeling. In this context, it is believed that making an evaluation for this concept with IT2 fuzzy logic makes a contribution. This study aims to examine the innovation capacity of Turkish banks, and IT2 fuzzy DEMATEL and IT2 fuzzy VIKOR methods are taken into account in the analysis process. Owing to this issue, it is believed that this study has a significant contribution to this area in the literature.
Extended Method
The concept of fuzzy sets is widely used for linguistic evaluations from the decision makers who are experts in the related field. Generally, linguistic scales are also defined in the various fuzzy numbers. Recently, the interval type 2 fuzzy sets (IT2 FS) are one of the most used for the extensions of MCDM approaches. IT2 FS are generalized form of the type 1 set. In this study, a hybrid decision-making model based on IT2 FS is proposed for the extended analysis. For this purpose, two-stage modeling is applied for the hybrid MCDM approach. Accordingly, first, the weighting process is employed by the DEMATEL method and then, ranking process is considered via the VIKOR method. This gives detailed results by computing the impact and relation degrees of each criterion besides the classical network and hierarchical approaches such as analytic network process (ANP) and analytic hierarchical process (AHP). However, the VIKOR generally focuses on the optimization problems of MCDM and compromise solution. Another advantage of the VIKOR is to select the consensus degrees for the strategy of maximum group utility among the decision makers between 0 and 1. So, it is aimed to evaluate the criteria and alternatives by considering the advantages of both methods at the same time. The extended decision-making approach is illustrated in Appendix A.
Analysis
In this study, innovation performance of the Turkish banking industry is evaluated. Turkey suffered from a significant banking crisis in 2000. After this date, many important reforms were generated to empower the banking industry in this country. For instance, Banking Regulation and Supervision Agency was formed in Turkey to increase audit in the industry. With the help of this situation, problematic issues in the industry can be minimized, and this situation has a significant contribution to the effectiveness of the Turkish banking sector. These items can be accepted as important reasons to make evaluation in Turkey. Analysis is applied by using a hybrid model including DEMATEL and VIKOR methods with the IT2 FS. The flowchart of the hybrid approach is summarized in the following steps, respectively. The MCDM problem is defined by discussing with the academicians and the experts. For this purpose, a decision-making team from the academicians and the experts are selected for constructing the problem. Accordingly, a set of criteria, dimensions, and alternatives are handled by the consecutive discussions until they have a consensus about the issue with the supported literature. Table 1 shows the dimensions and criteria for the innovation performance of retail banking services.
Innovation Performance Indicators of Retail Banking Services.
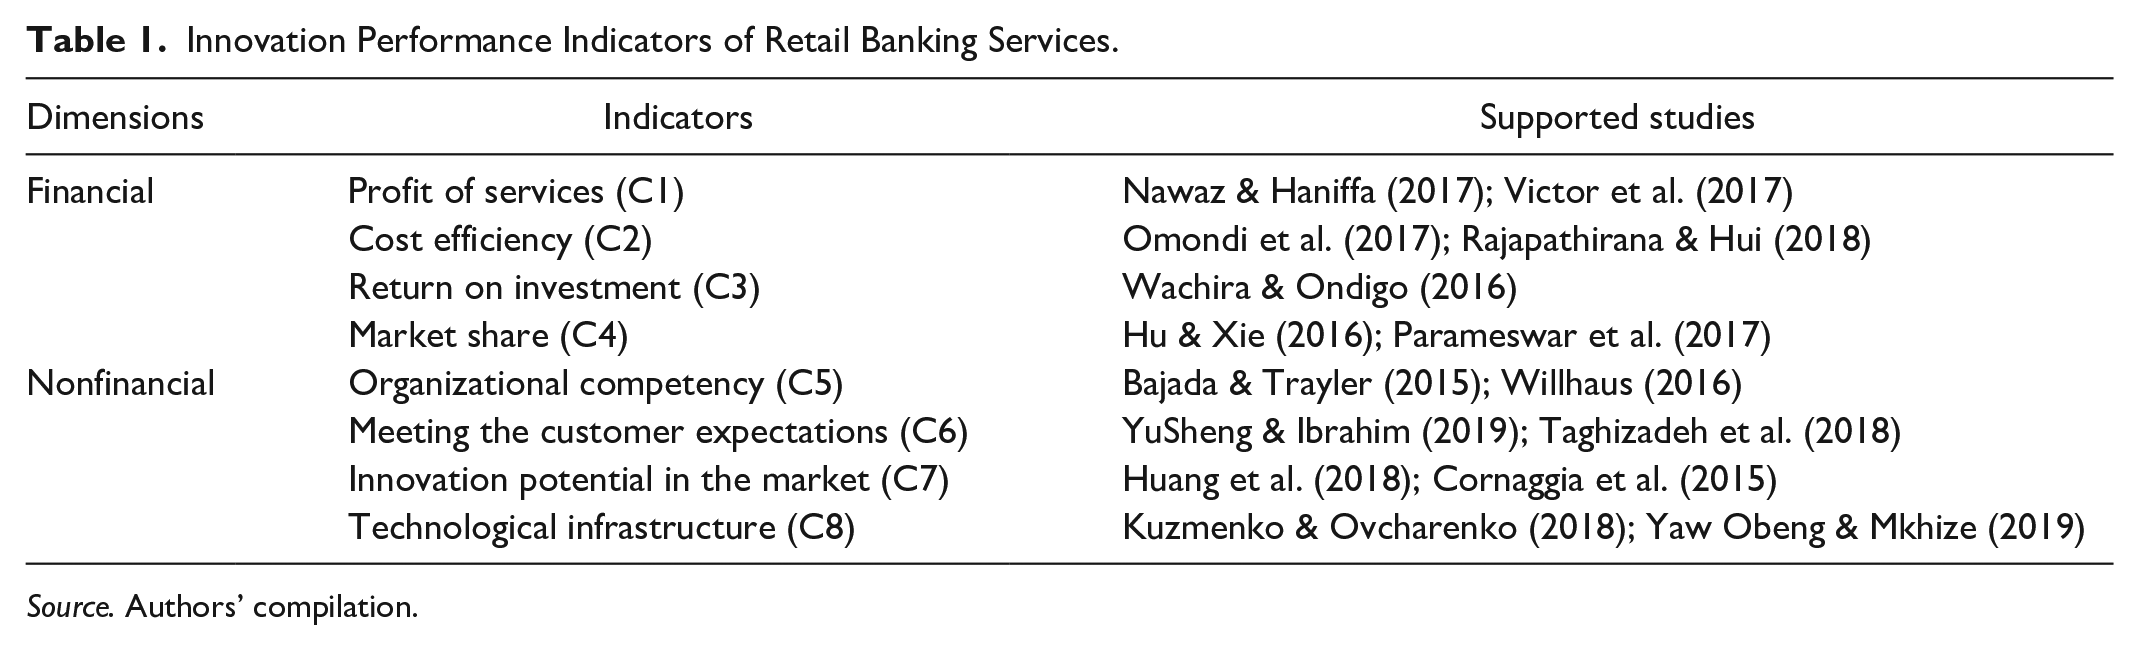
Source. Authors’ compilation.
Table 1 shows that there are four different criteria for financial factors. First of all, profit of the services and cost efficiency are the main items that affect the innovation performance of the banks. In addition, it is also seen that return on investment and market share have positive influence on the bank innovation. However, organizational competence and meeting customer expectations play a key role in innovation competency of the banks. Finally, innovation potential of the market and technological infrastructure are other important indicators of innovation performance of the banks. After defining criteria, three different decision-making groups are constructed for providing their priorities regarding the criteria and alternatives. They provide their scales by using Table 2.
Linguistic and Fuzzy Numbers for the Evaluations.

Source. Adapted from Baykasoğlu and Gölcük (2017).
Linguistic choices of each decision-maker group are given for the criteria in Appendix B. Linguistic evaluations are converted into the trapezoidal fuzzy numbers by using Table 2. The average results are represented with Equations A3 and A4 as seen in Appendix C. Normalized matrix is computed with Equations A5 to A7, and then, total relation matrix is employed by using Equations A8 to A12 before the defuzzification process. After that, defuzzified total relation matrix is obtained to provide the relation and impact degrees and weights for the criteria by formulas A13 to A18. Table 3 shows the defuzzified values and weights of criteria.
The Defuzzified Total Relation Matrix and Weights for the Criteria.

Source. Authors’ calculation.
The final results from IT2 fuzzy DEMATEL demonstrate that market share (C4) is the most important factor in the innovation performance of retail banking services, whereas cost efficiency (C2) has the least importance among them. The final listing of weighting performance is performed as market share (C4), return on investment (C3), innovation potential in the market (C7), organizational competency (C5), profit of services (C1), meeting the customer expectations (C6), technological infrastructure (C8), cost efficiency (C2), respectively. However, market share (C4) is the most influencing factor, whereas organizational competency (C5) is the most influenced item in the criterion set. Accordingly, the financial dimension, including the first four criteria, has a priority with 50.2 percentage and the nonfinancial dimension combining the remaining criteria has relatively weaker importance than the financial items.
The findings give information that the banks, which have higher market share, tend to be more successful to make innovation. On the other side, having higher profitability is also another component that affects the innovation performance of banks. Wachira and Ondigo (2016), Nawaz and Haniffa (2017), and Victor et al. (2017) also underlined the importance of this situation in their studies. After that, five biggest banks of Turkey with respect to the asset size are taken into consideration. The descriptive statistics of these banks are given on Table 4.
Descriptive Statistics of Five Turkish Banks Analyzed in the Study (March 31, 2018).
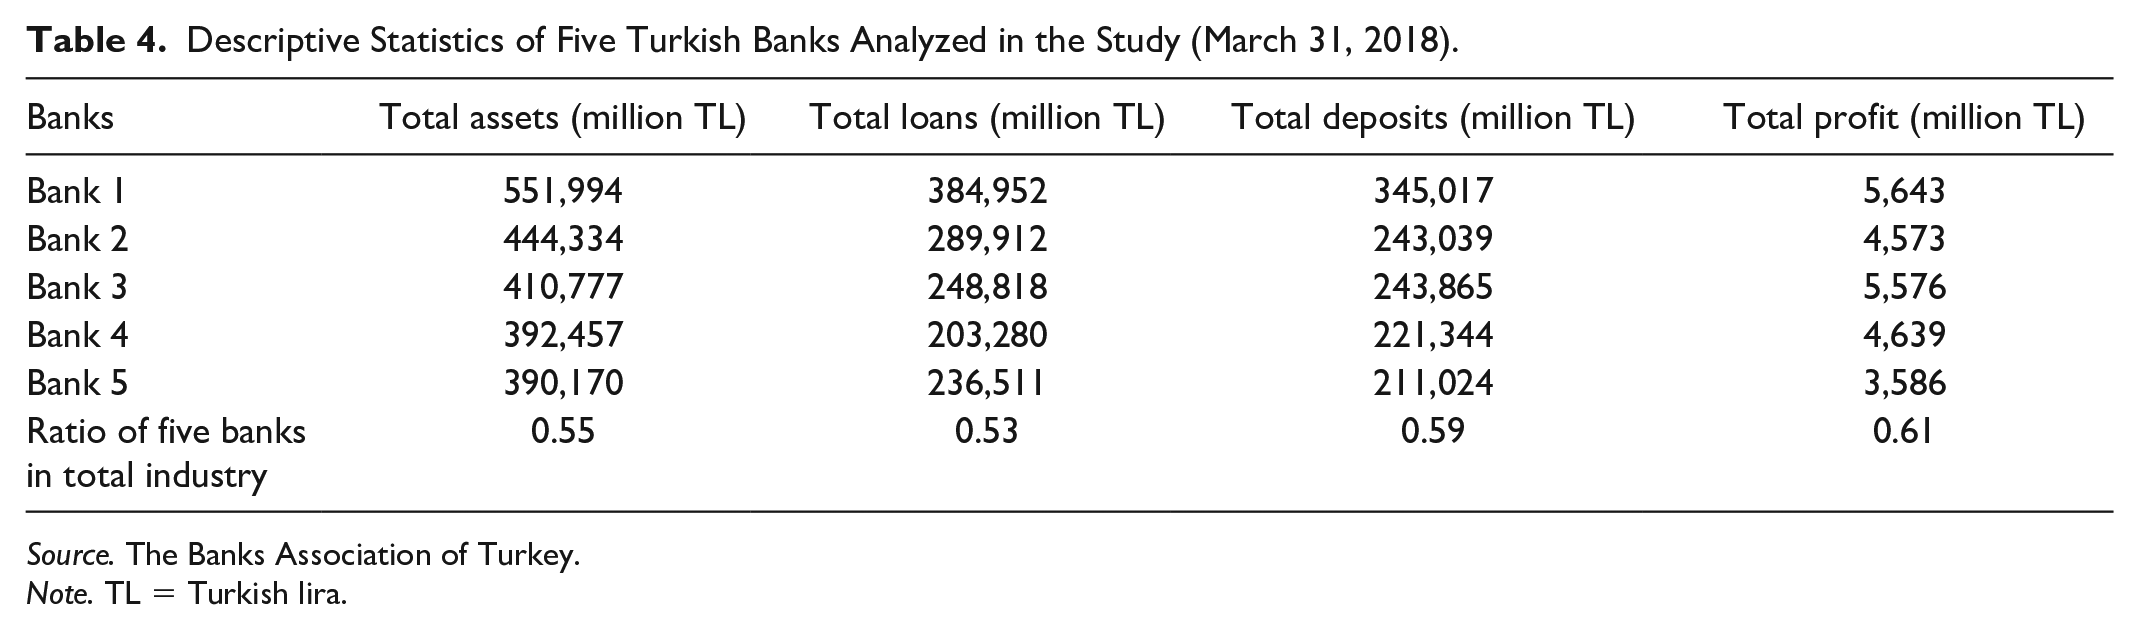
Source. The Banks Association of Turkey.
Note. TL = Turkish lira.
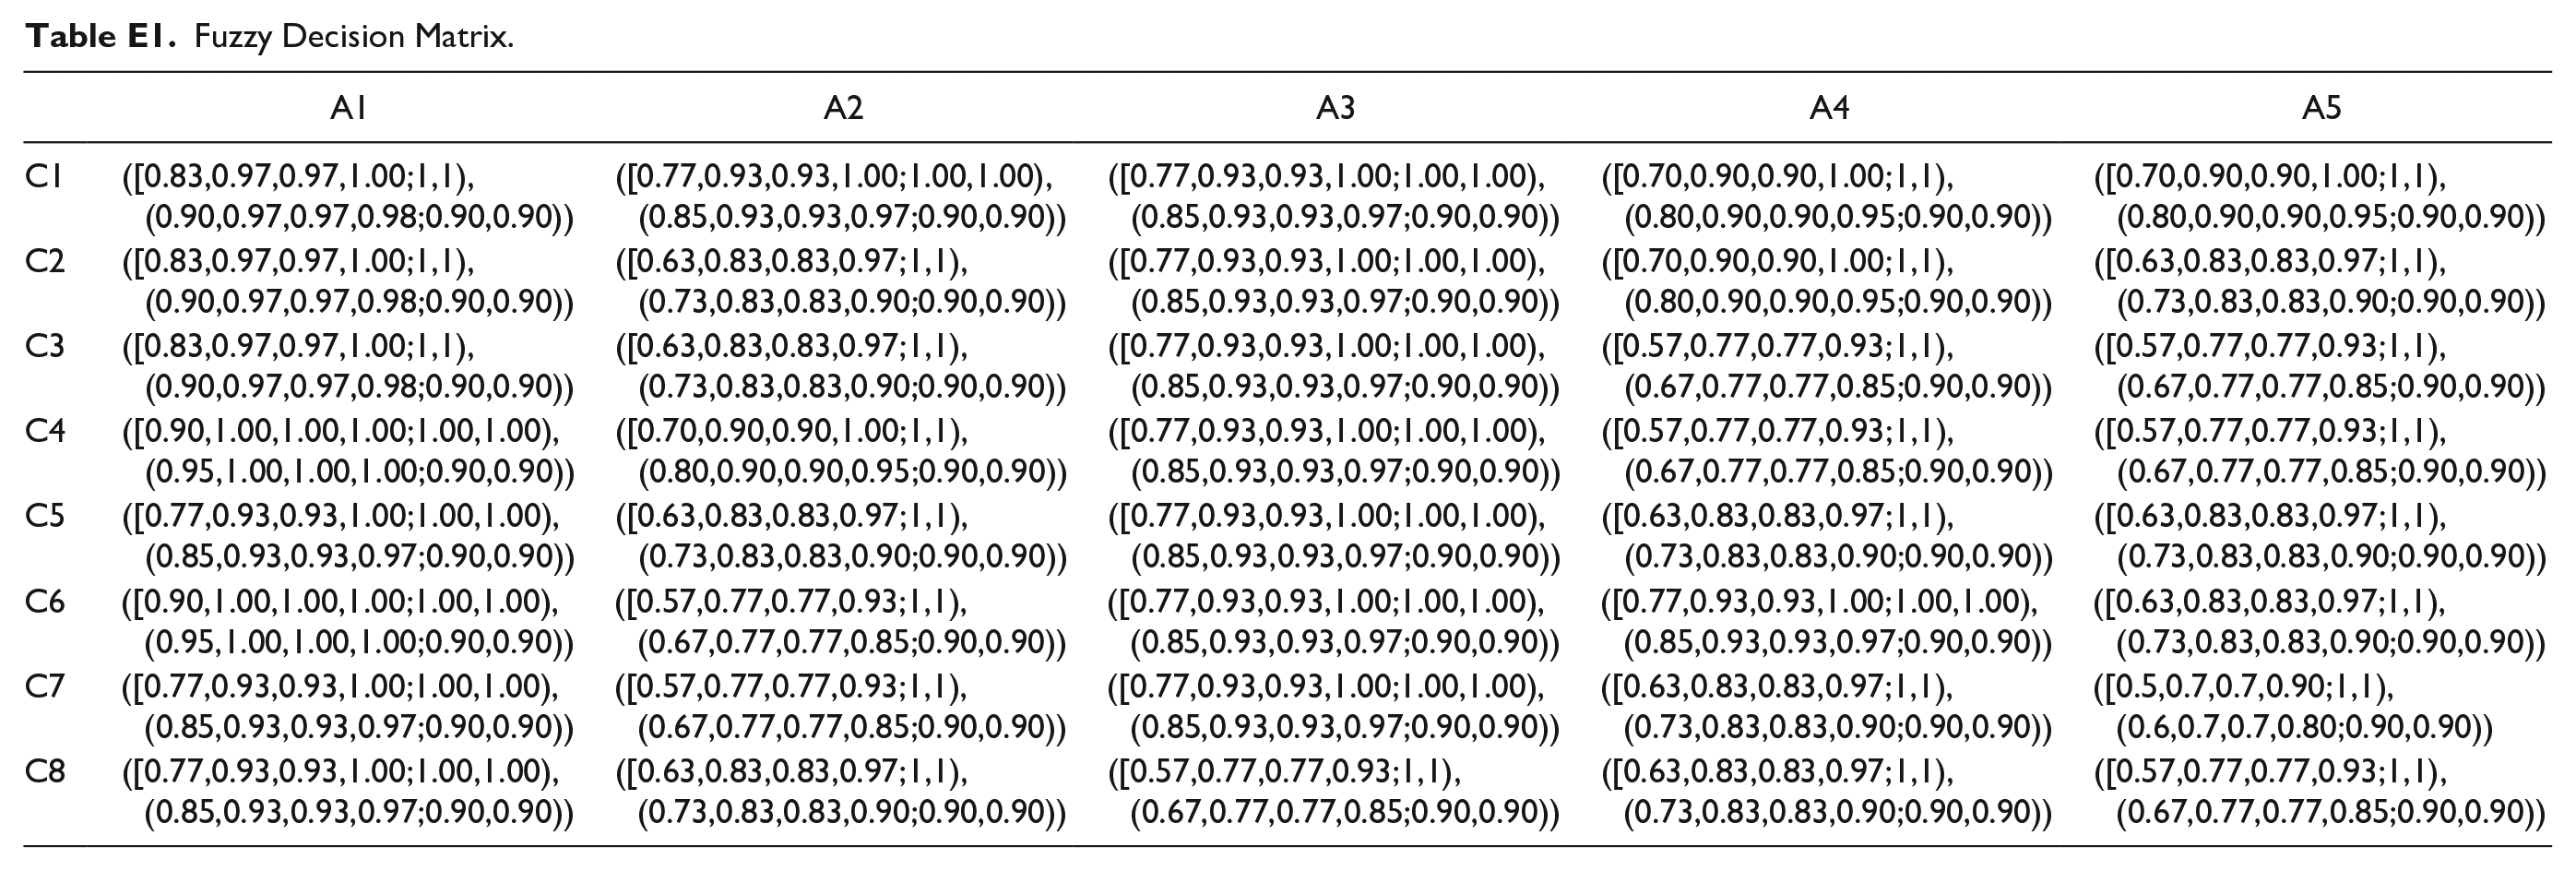
Table 4 states that the ratio of total assets for these five banks consists of 55% of total industry. In addition, this ratio is 53% for total loans and 59% of the total deposits. On the other side, total profit of these five different banks has 61% of Turkish banking industry. Linguistic evaluations for the alternatives are obtained by considering Table 2 and the linguistic results are seen in Appendix D. IT2 FS–based evaluations for the alternatives are presented with formula A19 in Appendix E. The defuzzified matrix is weighted by considering the results of IT2 fuzzy DEMATEL and the weighted results, and Si, Ri, and Qi values are calculated by formulas A20 to A29. Table 5 defines the analysis results of IT2 FVIKOR method.
Weighted Defuzzified Values and Ranking Results.
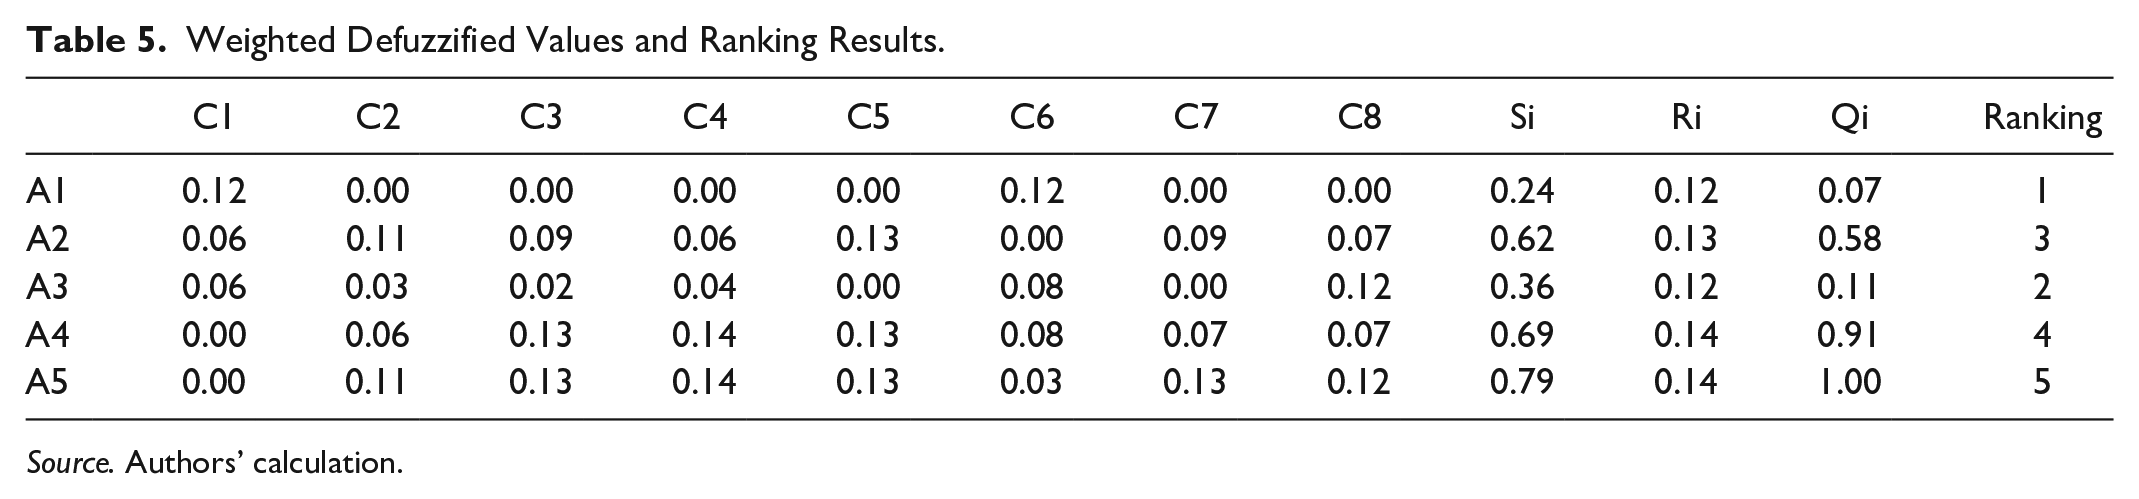
Source. Authors’ calculation.
The results of IT2 FVIKOR demonstrate that Alternative 1 (A1) is best performing bank in the innovation performance of Turkish retail banking services. However, Alternative Bank 5 (A5) has the worst performance among the alternative set. Accordingly, the ranking results are listed as Alternative 1 (A1), Alternative 3 (A3), Alternative 2 (A2), Alternative 4 (A4), and Alternative 5 (A5), respectively. This situation gives information that the bank that has higher market share is more successful to make innovation. Another important point is that there is a positive relationship between profit amount and the innovation performance of the banks. This conclusion was also identified by many different researchers, such as Rajapathirana and Hui (2018) and Esmaeilpour et al. (2016).
Discussion and Conclusion
In this study, it is aimed to evaluate the innovation performance of the Turkish banking industry. First, eight different financial and nonfinancial criteria are identified as a result of the literature review. In addition, five biggest Turkish deposit banks are selected as alternatives. These banks represent the significant parts of the Turkish banking industry. IT2 FDEMATEL approach is taken into consideration to weight the criteria. Hence, the impact relation map between these factors can be generated. However, these selected banks are ranked by using IT2 FVIKOR method. Owing to this situation, it can be understood which banks are more successful with respect to the innovation capacity. Thus, it can be possible to generate strategies for the banks to improve their capacities regarding this condition.
The results explain that market share and return on investment are the most important factors in the innovation performance of retail banking services. In other words, it is seen that the banks with higher market volume are more successful in innovation. Similar to this situation, it is also concluded that more profitable banks are more successful than others in developing innovative products. On the other side, cost efficiency has the weakest importance among them. In addition to them, according to IT2 fuzzy VIKOR results, it is determined that the bank that has higher market share is more successful to make innovation. Another important point is that there is a positive relationship between profit amount and the innovation performance of the banks. Hence, it is understood that these results are quite coherent.
Many different researchers in the literature underlined the importance of these results. For example, Hu and Xie (2016) aimed to evaluate the relationship between competition and bank’s risk taking. For this purpose, the mediating role of innovation for the Chinese banking industry was examined. Structural equation modeling is employed to the data of Chinese banks. They reached the conclusion that the banks that have higher market share are very successful to generate innovative products. Similarly, Parameswar et al. (2017) also focused on the innovation in the Indian banking industry. They identified many different criteria to affect the performance of innovation, and concluded that market power is one of the most significant factors for this situation. On the other side, Wachira and Ondigo (2016) did a study to understand the relationship between technological development and financial performance in the banking industry of Kenya. A survey analysis was conducted, and it is determined that banks with high financial performance are more successful in innovative products.
The main limitation of this study is that the analysis is conducted only for the Turkish banking industry. Hence, in future studies, different countries can be taken into account, such as the European Union; Brazil, Russia, India, China, and South Africa (BRICS); or Mexico, Indonesia, Nigeria, and Turkey (MINT) countries. The main reason is that these analysis results can differ according to the profiles of the countries. Another important limitation is that innovation performance is evaluated only for the banking industry. This situation is also important for different industries such as manufacturing and tourism. Making an examination for these industries can also provide beneficial results to make improvement. In addition to these issues, different methodologies can also be considered in the new studies. For instance, hesitant fuzzy logic can be used with MCDM methods.
Footnotes
Appendix A
Appendix B
Linguistic Choices for the Criteria.

| Criterion 1 |
Criterion 2 |
Criterion 3 |
Criterion 4 |
|||||||||
|---|---|---|---|---|---|---|---|---|---|---|---|---|
| DM1 | DM2 | DM3 | DM1 | DM1 | DM2 | DM3 | DM2 | DM3 | DM1 | DM2 | DM3 | |
| Profit of services (C1) | — | — | — | MH | H | MH | ML | ML | M | ML | L | ML |
| Cost efficiency (C2) | L | ML | ML | — | — | — | L | L | ML | L | L | L |
| Return on investment (C3) | MH | MH | M | H | VH | MH | — | — | — | M | MH | M |
| Market share (C4) | VH | VH | VH | VH | H | VH | H | MH | MH | — | — | — |
| Organizational competency (C5) | ML | L | ML | M | ML | M | L | L | ML | ML | L | L |
| Meeting the customer expectations (C6) | M | ML | M | L | ML | ML | M | M | ML | ML | L | ML |
| Innovation potential in the market (C7) | M | MH | M | MH | MH | MH | M | ML | ML | ML | ML | ML |
| Technological infrastructure (C8) | ML | ML | L | ML | M | M | ML | ML | ML | ML | L | L |
| Criterion 5 |
Criterion 6 |
Criterion 7 |
Criterion 8 |
|||||||||
| DM1 | DM2 | DM3 | DM1 | DM1 | DM2 | DM3 | DM2 | DM3 | DM1 | DM2 | DM3 | |
| Profit of services (C1) | M | MH | H | M | M | ML | MH | M | M | MH | MH | M |
| Cost efficiency (C2) | M | M | ML | ML | L | L | ML | ML | L | ML | ML | M |
| Return on investment (C3) | H | VH | H | MH | M | M | MH | H | MH | MH | H | H |
| Market share (C4) | VH | VH | H | MH | MH | M | MH | H | H | VH | VH | VH |
| Organizational competency (C5) | — | — | — | M | ML | ML | M | M | ML | M | ML | M |
| Meeting the customer expectations (C6) | H | VH | MH | — | — | — | H | VH | MH | H | VH | H |
| Innovation potential in the market (C7) | MH | H | MH | M | ML | ML | — | — | — | M | MH | M |
| Technological infrastructure (C8) | M | M | ML | ML | ML | L | ML | ML | L | — | — | — |
Note. DM = decision making; MH = medium high; ML = medium low; VH = very high; H = high; M = medium; L = low.
Appendix C
Initial Direct Relation Fuzzy Matrix.

| C1 | C2 | C3 | C4 | |
|---|---|---|---|---|
| C1 | ((0,0,0,0;1,1], (0,0,0,0;0.90,0.90)) | ((0.57,0.77,0.77,0.93;1,1], (0.67,0.77,0.77,0.85;0.90,0.90)) | ((0.17,0.37,0.37,0.57;1,1], (0.27,0.37,0.37,0.47;0.90,0.90)) | ((0.07,0.23,0.23,0.43;1,1], (0.15,0.23,0.23,0.33;0.90,0.90)) |
| C2 | ((0.07,0.23,0.23,0.43;1,1], (0.15,0.23,0.23,0.33;0.90,0.90)) | ((0,0,0,0;1,1], (0,0,0,0;0.90,0.90)) | ((0.03,0.17,0.17,0.37;1,1], (0.10,0.17,0.17,0.27;0.90,0.90)) | ((0.00,0.10,0.10,0.30;1,1], (0.05,0.10,0.10,0.20;0.90,0.90)) |
| C3 | ((0.43,0.63,0.63,0.83;1,1], (0.53,0.63,0.63,0.73;0.90,0.90)) | ((0.70,0.87,0.87,0.97;1,1], (0.78,0.87,0.87,0.92;0.90,0.90)) | ((0,0,0,0;1,1], (0,0,0,0;0.90,0.90)) | ((0.37,0.57,0.57,0.77;1,1], (0.47,0.57,0.57,0.67;0.90,0.90)) |
| C4 | ((0.90,1.00,1.00,1.00;1,1], (0.95,1.00,1.00,1.00;0.90,0.90)) | ((0.83,0.97,0.97,1.00;1,1], (0.90,0.97,0.97,0.98;0.90,0.90)) | ((0.57,0.77,0.77,0.93;1,1], (0.67,0.77,0.77,0.85;0.90,0.90)) | ((0,0,0,0;1,1], (0,0,0,0;0.90,0.90)) |
| C5 | ((0.07,0.23,0.23,0.43;1,1], (0.15,0.23,0.23,0.33;0.90,0.90)) | ((0.23,0.43,0.43,0.63;1,1], (0.33,0.43,0.43,0.53;0.90,0.90)) | ((0.03,0.17,0.17,0.37;1,1], (0.10,0.17,0.17,0.27;0.90,0.90)) | ((0.03,0.17,0.17,0.37;1,1], (0.10,0.17,0.17,0.27;0.90,0.90)) |
| C6 | ((0.23,0.43,0.43,0.63;1,1], (0.33,0.43,0.43,0.53;0.90,0.90)) | ((0.07,0.23,0.23,0.43;1,1], (0.15,0.23,0.23,0.33;0.90,0.90)) | ((0.23,0.43,0.43,0.63;1,1], (0.33,0.43,0.43,0.53;0.90,0.90)) | ((0.07,0.23,0.23,0.43;1,1], (0.15,0.23,0.23,0.33;0.90,0.90)) |
| C7 | ((0.37,0.57,0.57,0.77;1,1], (0.47,0.57,0.57,0.67;0.90,0.90)) | ((0.50,0.70,0.70,0.90;1,1], (0.60,0.70,0.70,0.80;0.90,0.90)) | ((0.17,0.37,0.37,0.57;1,1], (0.27,0.37,0.37,0.47;0.90,0.90)) | ((0.10,0.30,0.30,0.50;1,1], (0.20,0.30,0.30,0.40;0.90,0.90)) |
| C8 | ((0.07,0.23,0.23,0.43;1,1], (0.15,0.23,0.23,0.33;0.90,0.90)) | ((0.23,0.43,0.43,0.63;1,1], (0.33,0.43,0.43,0.53;0.90,0.90)) | ((0.10,0.30,0.30,0.50;1,1], (0.20,0.30,0.30,0.40;0.90,0.90)) | ((0.03,0.17,0.17,0.37;1,1], (0.10,0.17,0.17,0.27;0.90,0.90)) |
| C5 | C6 | C7 | C8 | |
| C1 | ((0.50,0.70,0.70,0.87;1,1], (0.60,0.70,0.70,0.78;0.90,0.90)) | ((0.23,0.43,0.43,0.63;1,1], (0.33,0.43,0.43,0.53;0.90,0.90)) | ((0.37,0.57,0.57,0.77;1,1], (0.47,0.57,0.57,0.67;0.90,0.90)) | ((0.43,0.63,0.63,0.83;1,1], (0.53,0.63,0.63,0.73;0.90,0.90)) |
| C2 | ((0.23,0.43,0.43,0.63;1,1], (0.33,0.43,0.43,0.53;0.90,0.90)) | ((0.03,0.17,0.17,0.37;1,1], (0.10,0.17,0.17,0.27;0.90,0.90)) | ((0.07,0.23,0.23,0.43;1,1], (0.15,0.23,0.23,0.33;0.90,0.90)) | ((0.17,0.37,0.37,0.57;1,1], (0.27,0.37,0.37,0.47;0.90,0.90)) |
| C3 | ((0.77,0.93,0.93,1.00;1,1], (0.85,0.93,0.93,0.97;0.90,0.90)) | ((0.37,0.57,0.57,0.77;1,1], (0.47,0.57,0.57,0.67;0.90,0.90)) | ((0.57,0.77,0.77,0.93;1,1], (0.67,0.77,0.77,0.85;0.90,0.90)) | ((0.63,0.83,0.83,0.97;1,1], (0.73,0.83,0.83,0.90;0.90,0.90)) |
| C4 | ((0.83,0.97,0.97,1.00;1,1], (0.90,0.97,0.97,0.98;0.90,0.90)) | ((0.43,0.63,0.63,0.83;1,1], (0.53,0.63,0.63,0.73;0.90,0.90)) | ((0.63,0.83,0.83,0.97;1,1], (0.73,0.83,0.83,0.90;0.90,0.90)) | ((0.90,1.00,1.00,1.00;1,1], (0.95,1.00,1.00,1.00;0.90,0.90)) |
| C5 | ((0,0,0,0;1,1], (0,0,0,0;0.90,0.90)) | ((0.17,0.37,0.37,0.57;1,1], (0.27,0.37,0.37,0.47;0.90,0.90)) | ((0.23,0.43,0.43,0.63;1,1], (0.33,0.43,0.43,0.53;0.90,0.90)) | ((0.23,0.43,0.43,0.63;1,1], (0.33,0.43,0.43,0.53;0.90,0.90)) |
| C6 | ((0.70,0.87,0.87,0.97;1,1], (0.78,0.87,0.87,0.92;0.90,0.90)) | ((0,0,0,0;1,1], (0,0,0,0;0.90,0.90)) | ((0.70,0.87,0.87,0.97;1,1], (0.78,0.87,0.87,0.92;0.90,0.90)) | ((0.77,0.93,0.93,1.00;1,1], (0.85,0.93,0.93,0.97;0.90,0.90)) |
| C7 | ((0.57,0.77,0.77,0.93;1,1], (0.67,0.77,0.77,0.85;0.90,0.90)) | ((0.17,0.37,0.37,0.57;1,1], (0.27,0.37,0.37,0.47;0.90,0.90)) | ((0,0,0,0;1,1], (0,0,0,0;0.90,0.90)) | ((0.37,0.57,0.57,0.77;1,1], (0.47,0.57,0.57,0.67;0.90,0.90)) |
| C8 | ((0.23,0.43,0.43,0.63;1,1], (0.33,0.43,0.43,0.53;0.90,0.90)) | ((0.07,0.23,0.23,0.43;1,1], (0.15,0.23,0.23,0.33;0.90,0.90)) | ((0.07,0.23,0.23,0.43;1,1], (0.15,0.23,0.23,0.33;0.90,0.90)) | ((0,0,0,0;1,1], (0,0,0,0;0.90,0.90)) |
Appendix D
Linguistic Choices for the Alternatives.

| Alternative Bank 1 |
Alternative Bank 2 |
Alternative Bank 3 |
Alternative Bank 4 |
Alternative Bank 5 |
|||||||||||
|---|---|---|---|---|---|---|---|---|---|---|---|---|---|---|---|
| DM1 | DM2 | DM3 | DM1 | DM1 | DM2 | DM3 | DM2 | DM3 | DM1 | DM2 | DM3 | DM1 | DM2 | DM3 | |
| Profit of services (C1) | VG | B | B | VG | VG | B | B | VG | VG | VG | VG | VG | VG | VG | VG |
| Cost efficiency (C2) | B | VG | B | G | VG | VG | B | VG | VG | VG | VG | VG | VG | G | VG |
| Return on investment (C3) | B | B | VG | G | VG | VG | VG | VG | B | G | VG | G | G | VG | G |
| Market share (C4) | B | B | B | VG | VG | VG | B | VG | VG | G | VG | G | G | VG | G |
| Organizational competency (C5) | VG | VG | B | G | VG | VG | B | VG | VG | VG | VG | G | G | VG | VG |
| Meeting the customer expectations (C6) | B | B | B | G | VG | G | B | VG | VG | B | VG | VG | VG | G | VG |
| Innovation potential in the market (C7) | VG | B | VG | VG | G | G | VG | VG | B | G | G | B | G | G | G |
| Technological infrastructure (C8) | B | VG | VG | VG | G | VG | G | VG | G | VG | VG | G | VG | G | G |
Note. DM = decision making; VG = very good; B = bad; G = good.
Appendix E
Fuzzy Decision Matrix.
| A1 | A2 | A3 | A4 | A5 | |
|---|---|---|---|---|---|
| C1 | ([0.83,0.97,0.97,1.00;1,1), (0.90,0.97,0.97,0.98;0.90,0.90)) | ([0.77,0.93,0.93,1.00;1.00,1.00), (0.85,0.93,0.93,0.97;0.90,0.90)) | ([0.77,0.93,0.93,1.00;1.00,1.00), (0.85,0.93,0.93,0.97;0.90,0.90)) | ([0.70,0.90,0.90,1.00;1,1), (0.80,0.90,0.90,0.95;0.90,0.90)) | ([0.70,0.90,0.90,1.00;1,1), (0.80,0.90,0.90,0.95;0.90,0.90)) |
| C2 | ([0.83,0.97,0.97,1.00;1,1), (0.90,0.97,0.97,0.98;0.90,0.90)) | ([0.63,0.83,0.83,0.97;1,1), (0.73,0.83,0.83,0.90;0.90,0.90)) | ([0.77,0.93,0.93,1.00;1.00,1.00), (0.85,0.93,0.93,0.97;0.90,0.90)) | ([0.70,0.90,0.90,1.00;1,1), (0.80,0.90,0.90,0.95;0.90,0.90)) | ([0.63,0.83,0.83,0.97;1,1), (0.73,0.83,0.83,0.90;0.90,0.90)) |
| C3 | ([0.83,0.97,0.97,1.00;1,1), (0.90,0.97,0.97,0.98;0.90,0.90)) | ([0.63,0.83,0.83,0.97;1,1), (0.73,0.83,0.83,0.90;0.90,0.90)) | ([0.77,0.93,0.93,1.00;1.00,1.00), (0.85,0.93,0.93,0.97;0.90,0.90)) | ([0.57,0.77,0.77,0.93;1,1), (0.67,0.77,0.77,0.85;0.90,0.90)) | ([0.57,0.77,0.77,0.93;1,1), (0.67,0.77,0.77,0.85;0.90,0.90)) |
| C4 | ([0.90,1.00,1.00,1.00;1.00,1.00), (0.95,1.00,1.00,1.00;0.90,0.90)) | ([0.70,0.90,0.90,1.00;1,1), (0.80,0.90,0.90,0.95;0.90,0.90)) | ([0.77,0.93,0.93,1.00;1.00,1.00), (0.85,0.93,0.93,0.97;0.90,0.90)) | ([0.57,0.77,0.77,0.93;1,1), (0.67,0.77,0.77,0.85;0.90,0.90)) | ([0.57,0.77,0.77,0.93;1,1), (0.67,0.77,0.77,0.85;0.90,0.90)) |
| C5 | ([0.77,0.93,0.93,1.00;1.00,1.00), (0.85,0.93,0.93,0.97;0.90,0.90)) | ([0.63,0.83,0.83,0.97;1,1), (0.73,0.83,0.83,0.90;0.90,0.90)) | ([0.77,0.93,0.93,1.00;1.00,1.00), (0.85,0.93,0.93,0.97;0.90,0.90)) | ([0.63,0.83,0.83,0.97;1,1), (0.73,0.83,0.83,0.90;0.90,0.90)) | ([0.63,0.83,0.83,0.97;1,1), (0.73,0.83,0.83,0.90;0.90,0.90)) |
| C6 | ([0.90,1.00,1.00,1.00;1.00,1.00), (0.95,1.00,1.00,1.00;0.90,0.90)) | ([0.57,0.77,0.77,0.93;1,1), (0.67,0.77,0.77,0.85;0.90,0.90)) | ([0.77,0.93,0.93,1.00;1.00,1.00), (0.85,0.93,0.93,0.97;0.90,0.90)) | ([0.77,0.93,0.93,1.00;1.00,1.00), (0.85,0.93,0.93,0.97;0.90,0.90)) | ([0.63,0.83,0.83,0.97;1,1), (0.73,0.83,0.83,0.90;0.90,0.90)) |
| C7 | ([0.77,0.93,0.93,1.00;1.00,1.00), (0.85,0.93,0.93,0.97;0.90,0.90)) | ([0.57,0.77,0.77,0.93;1,1), (0.67,0.77,0.77,0.85;0.90,0.90)) | ([0.77,0.93,0.93,1.00;1.00,1.00), (0.85,0.93,0.93,0.97;0.90,0.90)) | ([0.63,0.83,0.83,0.97;1,1), (0.73,0.83,0.83,0.90;0.90,0.90)) | ([0.5,0.7,0.7,0.90;1,1), (0.6,0.7,0.7,0.80;0.90,0.90)) |
| C8 | ([0.77,0.93,0.93,1.00;1.00,1.00), (0.85,0.93,0.93,0.97;0.90,0.90)) | ([0.63,0.83,0.83,0.97;1,1), (0.73,0.83,0.83,0.90;0.90,0.90)) | ([0.57,0.77,0.77,0.93;1,1), (0.67,0.77,0.77,0.85;0.90,0.90)) | ([0.63,0.83,0.83,0.97;1,1), (0.73,0.83,0.83,0.90;0.90,0.90)) | ([0.57,0.77,0.77,0.93;1,1), (0.67,0.77,0.77,0.85;0.90,0.90)) |
Acknowledgments
The authors would like to thank the Information Industry Development Research Center (IIDR) at Xi’an University of Posts and Telecommunications for supporting and funding this research.
Authors’ Contributions
All the authors contributed equally to the article.
Declaration of Conflicting Interests
The author(s) declared no potential conflicts of interest with respect to the research, authorship, and/or publication of this article.
Funding
The author(s) disclosed receipt of the following financial support for the research, authorship, and/or publication of this article: The authors would like to thank the Information Industry Development Research Center (IIDR) at Xi’an University of Posts and Telecommunications for supporting and funding this research under the project of Shaanxi Philosophy and Social Science Key Research Base (19JZ055).