
Abstract
One of the major worries vis-à-vis the phasing out of the multifiber arrangements (MFA)/agreement on textile and clothing (ATC) in 2005 was that the textile and apparel (T&A) production would shift from the developed to the developing countries and have significant impacts on particularly the female workers, as apparel is a female intensive sector in the world. We explore the effect of MFA/ATC on female laborer by examining the predictions of the theoretical model of Robertson and Trigueros-Argüello in the case of Pakistan. It predicts, based on the assumption that the T&A sector is female intensive, such that an adverse (beneficial) shock to product price will be transformed into a comparative decline (rise) in the T&A wages relative to other sectors in the short run (SR) and a relative drop in wages of female workers compared with wages of male workers across all sectors in the long-run (LR). Our empirical findings of the post-MFA/ATC variations support the predictions of the theoretical model.
Introduction
The multi-fiber arrangement (MFA/ATC) was the key policy regulating the textile and clothing (T&C) trade with the objective of helping industrialized economies adjust to the growing productive capacity of the developing economies. This arrangement was eliminated on January 1, 2005, and the quotas were no more in the textile and clothing trade. Trade is regulated by the general rules of the World Trade Organization (WTO) and General Agreement on Tariffs and Trade (GATT). The termination of the MFA/ATC caused a considerable redistribution of the global apparel production (Lopez-Acevedo & Robertson, 2012; Staritz, 2011). Trade openness and growing exports, particularly in textile and apparel (T&A), engender more openings for female workers to move from either informal employment or agriculture to formal jobs (Bezuidenhout et al., 2007; Lopez-Acevedo & Robertson, 2016; Kabeer & Mahmud, 2004; Robertson et al., 2009).
According to Adhikari and Yamamoto (2008), the T&C industry is important for three reasons. First, it played a vital role in the development course of economies. Second, market access was easy due to low capital requirement and relatively less-skilled workers and resulting in a competitive market. Third, this industry is the most protected industry, among all manufacturing industries in all economies of the world.
The phasing out of MFA had important insinuations not only for exports but also for T&A laborers in general and women in particular. Generally, the apparel sector is considered as both female- and labor-intensive in many less-developed countries. For reasons of low-skilled workers requirements, this sector is considered as the “gateway” into manufacturing for labor whose substitute is informal market (for definition and more details on informality, please see Kugler, 2004, Williams et al., 2016, Koujianou Goldberg and Pavcnik, 2003, Wu et al., 2019, Kahyalar et al., 2018, and Basu, 2015) (including child care, construction work, and domestic job) or agriculture. With similar characteristics, the apparel sector was competitive and also revenue and employment generating to semi- and unskilled labor, especially female workers.
As per the traditional trade theory, countries with a rich labor supply move resources toward labor-intensive goods, leading to an upsurge in the labor demand, and amalgamation of employment and earnings. This phenomenon is supported by the experience of East Asian economies (Taiwan, Singapore, Korea, and Hong Kong), as more recent occurrences of liberalization seem not to have been linked with huge advances in prospects for the typical worker (Robbins, 1996; Wood, 1997).
The theoretical model developed by Robertson and Trigueros-Argüello (2011) predicts that a negative price shock to a specific sector would lead to (a) a decrease in wages in that sector in relation to other industries in the short run (SR) and (b) a relative decline of wages to a sector-specific factor (in our case, female workers) in the overall economy in the long run (LR). Mussa (1974) showed that a change in output prices will have two effects on the earnings that are rewarded to each factor of production: an SR effect and an LR effect.
The effect of the MFA/ATC on the wages of the low-skilled/educated workers in the textile and clothing sector of Pakistan is still overlooked. Chen et al. (2019) studied the impact of MFA/ATC on working conditions using labor force survey data in case of Pakistan. Liaqat (2013a, 2013b) investigated the impact of MFA on firm’s productivity using Karachi stock–listed firms data in case of Pakistan. This study will fill this research gap by examining the impact of globalization on female worker’s wages in the T&C sector in the case of Pakistan. It will further test the prediction made by the theoretical model developed by Robertson and Trigueros-Argüello (2011) in the case of Pakistan.
The next section of this article presents a brief background of T&A. Section “Data and Method” describes the data and method. Section “Empirical Results” shows the descriptive and empirical findings, and section “Conclusion” concludes the article.
Background of the T&A Sector in Pakistan
Pakistan is ranked fourth in global cotton production and contributes 5% to global spinning capacity, and is the third-biggest cotton consumer. Of the 521 textile and clothing units in Pakistan, 50 are composite and 471 are spinning units. Table 1 shows the global performance of the Pakistani T&A sector from 1988 to 2009. A major limitation of the study is that all these categories have been merged into one category in the labor force (henceforth LFS) data. The proportion of T&A in global export from 1988 to 2009 shows a rising trend. The T&A sector is not only the backbone of Pakistani exports but also a major source of foreign exchange earnings. Textile industry alone accounts for almost 40% of the overall employment in the manufacturing sector. The details of employment generation of textile sector in the economy over the years are presented in Table 2. Pakistan total T&A exports doubled from 1996 to 2005, and in 2007, it was more than double. The performance of T&A is presented in Figure 1 over the sample period. The performance of T&A overall and individually is quite reasonable throughout the sample period.
Pakistan’s Share of T&A in Global Export.

Source. Hussain (2010).
Share of Employment of T&A in the Manufacturing Sector in Sample Period.

Source. Author’s calculation based on LFS.

Pakistan’s textile and apparel exports over 1996–2006.
Keeping the MFA/ATC elimination in 2005 in mind, a large investment has been made in T&A sector under balancing, modernization, and replacement (BMR) and Textile Vision 2005 of the government of Pakistan announced in 2000. The main objectives of Textile Vision 2005 and BMR were to transform the T&A sector into the open, innovative, market-driven, and dynamic textile industry, which would be integrated globally, fully loaded to capture the opportunities generated after the phasing out of the MFA/ATC and can compete in the world T&A market. The share of value-added products of T&A industry in total T&A exports of Pakistan in the year 2002–2003 was 68.47% compared with 54% in the year 2001–2002 (Raza, 2010). From 2000 to 2009, with the collective efforts of public and private sectors, the T&A sector has shown rapid development. The import of textile machinery was significant from 2000 to 2010. The impact of these investments is clearly observed from the performance of the sector. According to Werner’s labor cost per hour, the labor cost in Pakistan is quite low as compared with many competitors, which make it more competitive in the world market.
Share of T&A Export of Total Exports Over 1996–2006.

As a result of significant investment on BMR and expansionary programs, the ability of the T&A sector to manufacture exportable products of requisite quality and at competitive prices has improved considerably. Pakistan’s ranking in T&A exports among Asian economies improved significantly from 1995 to 2007. Pakistan improved its ranking considerably in T&A exports from 10th in 1995 to sixth in 2007 among Asian countries (for details, see Table 7 in appendix).
The key competitors of Pakistan also obtained considerable progress. For instance, P.R. China and Hong Kong sustained their positions from 1995 to 2007. Turkey stepped up from fifth rank in 1995 to third rank in 2007. India moved to fourth and Republic of Korea to fifth rank in 2007. Bangladesh made significant progress and stepped up from 14th rank in 1995 to the eighth rank in 2007 (for details, see Table 7 in appendix). Food & Beverages, textile, and chemical product industries faced big losses due to energy crises in Pakistan that started in 2007. The overall loss of the industrial sector in volume ranges between PKR269 and 819 billion (Siddiqui et al., 2011). Energy crises started in 2007, and since then, the gap between demand and supply has widened (Aziz & Ahmad, 2015).
Data and Method
Method
Our study adopts the theoretical model of Robertson and Trigueros-Argüello (henceforth RTA) (2011), that is a modified form of the model used by Do et al. (2012). Do et al. (2012) model acclimatizes Mussa (1974) to “engendered trade.” RTA (2011) differs from Do et al. (2012) in two ways. First, it is simpler in the application. Second, it decomposes the various wage effects of liberalization.
It is assumed as a two-sectors-and-two-factors economy and that the first sector is the T&A industry represented by “T” and the second sector is other manufacturing industries represented by “O.” The first factor is female (f) and second factor is men (m). The production of the two commodities

We presume full employment of both women and men, and that the latter is completely mobile among sectors:

We presume that women are a comparatively sector-specific factor. The rationale behind this supposition is to factor in the extraordinary social pressure that females in developing economies often encounter to enter peculiar sectors (e.g., T&A) and stay away from others (e.g., heavy industry). Men, though, seem more probable to be mobile among sectors.
The change in the price of the product will affect the earnings of each factor that they received in two epochs: an SR effect and an LR effect (Mussa, 1974). Postulating females as the specific factor, the SR connotation for womens’ earnings are straight:

This representation presumes that commodity “O” is numeraire and that females are paid the difference remnant between the value of the product and the amount paid to males. The key connotation of Equation 3 is that the earnings of females are directly related to the price shock in the SR in a given sector. Any alteration in the price of apparel product will definitely influence female’s earnings in the T&A (T) sector but will not in Sector O. The implication here is that there will be a change in women’s returns in T&A sector relative to other sectors.
As Mussa (1974) depicts, the effect of product price shock to males, the fully mobile factor, depends on the factor concentration of each industry and the extent of substitutability of factor in each sector. On the whole, however, the wage rate of each worker rises (declines), but not as much, as the increases (decreases) in apparel product price. The direction of change depends on the nature of price shock.
In the LR, both men and women are mobile among sectors, and the problem described in Equations 1 and 2 reduces to well-known Stolper–Samuelson theorem, in which the impact of the change on the earnings of each factor depends on the relative factor intensities within a particular sector. Defining θ ij as a share of factor i in industry j, this familiar result is expressed as:

and

Otherwise stated, if T&A is female-intensive, and the price of T&A goes up (goes down), the LR effect is a real increase (decrease) in the relative wage of females (in all sector).
The results in Equations 3 and 5 can simply be applied to the empirical framework through the conventional Mincerian earning function. The Mincerian equation regresses the log of the individual worker’s wage,
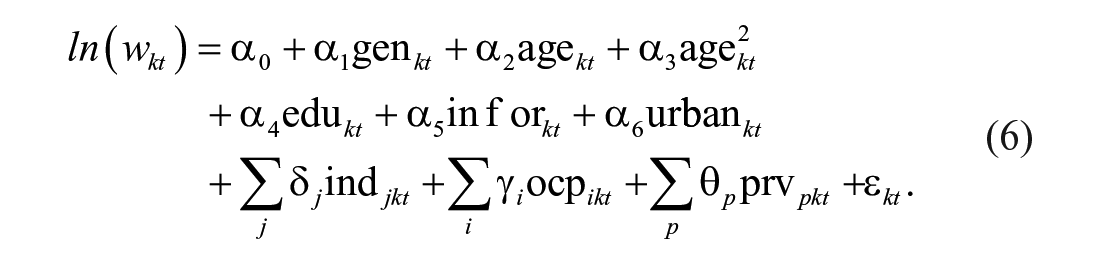
We estimate Equation 6 separately for each cross section in our sample. Our empirical methodology is similar to Robertson et al. (2020). Following Robertson et al. (2020), we add informality variable in the above model.
In the case of this article, the effect of an increase (decrease) in the price of j industry would have both SR and LR effects. The SR effect of the increase (decrease) in product price is on the industry-specific part of the wage and would come up as a contemporaneous increase (decrease) in the calculated industry-specific coefficient
In the LR, the increase (decrease) in apparel price would affect the “general” component of earning. In our T&A application, as long as j industry is women-intensive, an increase (decrease) in the price of j industry will affect
One setback with this method is what time frame comprises “the long-run (LR)” or how is “the long-run (LR)” determined? Robertson (2004) gives one of the few estimates for what is the relevant time frame for LR and proposes that Stolper–Samuelson effects commence between 3 and 5 years’ time.
We have two estimation problems. The first concern directly relates to the industry wage differentials, which is our estimates of interest. Our estimated coefficients are sensitive to omitted industry. Following Krueger and Summers (1988), the calculated industry wage premiums are expressed as deviations from employment-weighted-mean premiums. We can interpret these normalized industry wage premiums as proportional variation in wages for a worker in a given industry relative to the average worker having same observable characteristics in all industries. The standardized wage differentials and their exact standard errors for the industry wage premiums are estimated using restricted least squares (RLS) proposed by Haisken-DeNew and Schmidt (1997). (The two approaches [i.e., RLS by Greene and Seaks, 1991, and two-step RLS by Haisken-DeNew and Schmidt, 1997] produced identical output.) For more theoretical, pedagogical, and applied discussions, see Suits (1984), Greene and Seaks (1991), Wiggins (1998), Anderson et al. (2001), Koujianou Goldberg and Pavcnik (2003), Goldberg and Pavcnik (2005), and Wu et al. (2019).
The second issue relates to sample selection bias. It is believed that woman earnings are often censored; therefore, a correction is needed for possible sample selection bias whenever females are included in the sample. We employ standard two-step Heckman approach (Heckman, 1979) to address this issue.
National Household Data of Pakistan
The sources of data are from the National Household survey. Our study uses all the available surveys of LFS conducted from 1996 to 2007 by the Pakistan Bureau of Statistics, which represents nationally cross-sectional survey data. LFS also helps to check the seasonal variations as an annual survey is conceded out in quarters. The crucial objective of the LFS is to collect data on vast-ranging statistics on numerous aspects of the economy’s noncombatant labor force. The data on the labor force in almost all aspects are provided by LFS in the country. The demographics contain information on such a variable as the head of household, gender, nuptial status, age and literacy, level of education, movement of population, occupation, and industry affiliation. The characteristics of labor force comprise information on (a) formal and informal industry, employing force classified by sector, job status, education level, and number of working hours; (b) working person health statistics and safety at workplace; and (c) unemployed workforce by education level and earlier work experience. The industries employment is described at two-digit International Standard Industrial Classification (ISIC) codes in labor force survey, which offers almost 33 sectors overall and nine sectors of manufacturing per year.
We created several variables using the household survey. We calculate weekly and monthly wage based on reported earnings and working hours data in a week. We create seven indicators for education level and nine indicators for occupations based on the International Standard Classification of Occupations 2008.
Empirical Results
Characteristics of Labor Force
The characteristics of the T&A labor force of Pakistan are illustrated in Table 4. Table 4 has two parts; the employment and education characteristics of the labor force. There is an upward trend in the percentage of the labor force in the T&A industry from 1996 to 2005, but this trend falls in 2007. However, the gradual increase in agriculture sector persists in 2007. Female participation rate is much lower as compared with the other Asian competitors. But the point to be noticed is that it has upward trend throughout and beyond the sample periods. The share of employed labor in T&A trended upward from 1996 to 2005, but a reduction is observed in 2007. The share of employed labor in 2007 is higher as compared with 1996 level. The low average of female’s years of schooling also indicated the skill picture of female workers.
Characteristics of Pakistan Labor Force.

Source. Author’s calculations based on Pakistan LFS (Various Issues) data.
The years of education in all sectors show a slightly rising trend. Female’s years of education is almost maintained throughout the sample period. Contrary to females, there is a minor rise in years of education of males. There is difference in male and female years of education. Male average-year of schooling is more than the female. Overall, a minor rise in average years of schooling is observed. Average years of schooling in Pakistan is less than other competitors (i.e., Cambodia and Sri Lanka) (Savchenko & Acevedo, 2012). Average-year of schooling in T&A is less than the overall mean value of education in Pakistan. This is in contrast to Cambodia and Sri Lanka.
Unit Values
The unit values of overall T&A products declined till 2000–2001. In other words, unit values fall gradually till second phase of agreement on textile and clothing (ATC). From 2000 to 2001, there is rising trend in overall T&A products, which is reflection of the introduction of latest technology in textile sector. The quality of products increased, which results in better prices and rising demand in the world market. The share of value-added products of T&A industry in total T&A exports of Pakistan in the year 2002–2003 was 68.47% compared with 54% in the year 2001–2002 (Raza, 2010). The main objectives of Textile Vision 2005 and BMR program were to transform the T&A sector into an open, innovative, market-driven, and dynamic textile industry, which would be integrated globally, fully equipped to capture the opportunities generated after the phasing out of MFA/ATC and can compete in the world T&A market. The tendency of textile sector toward high value-added products results in increasing unit values. The unit values of major T&A products exported over the sample period are presented in Figures 2 and 3. The unit values of apparel exports from Pakistan to European Union (EU) are lower than India and Sri Lanka (Tewari, 2008). The upward trend in unit values of the apparel sector reflects the bigger value-added production of apparel products that Pakistan specializes.

Unit values over time.

Unit values over time (garments and hosiery).
Wages of Labor Force
In this part, we examine the changes in worker’s wages as well as the wage gap between man–woman and T&A wage premiums before and after the MFA (ATC) phasing out. Log weekly wage in T&A (on average) is less than the national log weekly wage in Pakistan. This gap is explained by a difference in years of schooling between National and T&A, but higher than agriculture sector. Wage differential exists between male and female in the sample period. Male workers are paid higher wages than female workers in T&A. The differentials in wages could be explained by differentials in years of education. The details of wage levels in Pakistan are presented in Table 5.
Weekly Wage Levels for Pakistan.

Source. Author’s calculations based on Pakistan LFS (Various Issues) data.
Note. All values are in real log weekly wages in 2001 prices.
Table 6 depicts the results of the wage Equation 6 for each cross section of our sample period using labor force survey data sets. The regression analysis based on the methodology illustrated in the empirical strategy section for Pakistan. For analysis purposes, we used six data sets of labor force surveys that covered 1996–2008 time periods.
Estimates of Regression Equation 6 for Cross Sections of the Sample Period.

Source. Author’s calculations based on LFS for the years 1996, 1999, 2001, 2003, 2005, and 2007.
Note. The dependent variable is real log weekly wages in 2001 prices in all models. Standard errors are presented in parenthesis and are clustered at sector level. Forestry and logging industry, Elementary occupation, and Baluchistan province are omitted categories (whenever it is required). *, **, and *** show significance at 10%, 5%, and 1%, respectively.
In Pakistan, a worker working in the T&A industry earns positive wage premiums except in 2001 and 2007. The wage premiums gradually decline till 2001 following the trend in unit values of T&A sector. Even it becomes negative in 2001, but statistically insignificant. The reason behind this phenomenon is that most of the developed countries removed quantitative restriction against Pakistan in third phase of the ATC. Second, the accession of China into WTO changes the scenario of world trade. China is not only big economy but also a low-cost competitor in world trade as well as in world T&A market. After phasing out of the MFA/ATC, the wage premium of T&A is positive and statistically significant.
Our finding in the case of Pakistan is in contrast to Cambodia and Sri Lanka (Savchenko & Acevedo, 2012) where wage premiums of the apparel sector fall significantly, but remain positive and statistically significant, after elimination of MFA/ATC in 2005. Wage premiums in Cambodia and Sri Lanka remain positive and statistically significant as compared with Pakistan in the sample period of studies. The wage premiums of T&A in Pakistan are much lower as compared with Cambodia and slightly smaller than Sri Lanka.
The sign of wage premium reversed from positive to negative, but similar in magnitude. The possible reason behind the reversal of the sign is a slowdown in developed countries, particularly the United States and EU as they are major trade partners of Pakistan. The second reason is the accession of Vietnam, a new and low-cost competitor to Pakistan in world T&A market, into the WTO in 2007. The third reason is energy crises in Pakistan that started in 2007 (Aziz & Ahmad, 2015). The correlation between unit values and the wage premium of T&A is in line with the theory. According to theory, a negative price shock will result in a reduction of wage premium and vice versa in T&A sector in the SR.
The change in women’s relative earnings shows the LR effects of the change in prices. The wage differential behaved in the way predicted by the theory—it broadened in 3 to 5 years following the MFA/ATC elimination, but then showed a decreasing pattern. Initially, it declined from 53.5% in 1996 to 29.4% in 1999, but it started to increase till 2005. In 2005, it was almost 64.5% and then it falls to a level of 33.4% in 2007. Our findings in case of Pakistan are much similar to Sri Lanka and Cambodia (Savchenko & Acevedo, 2012).
Conclusion
One worry about the phasing out of the MFA/ATC was that the T&A production would shift from the developed countries to the developing countries and have a significant impact on workers, particularly the female because apparel is a female-intensive sector in the world. Pakistan was one of the countries that seemed to have benefited from the elimination of the MFA/ATC in terms of T&A production. The T&A exports to the trading partners increased after the end of the MFA/ATC, and unit values declined initially due to rising competition, but it did not affect the volumes, instead volumes increased. Following the decline in unit values, our study documents a decline in T&A wage premiums and finds a small earning differential between men and women. After 2001, we observe a slight increase in the unit values of almost all the T&A products which resulted in a rise in wage premiums of the T&A sector, and consequently, a rise in the wage gap between male and female till the end of the MFA/ATC in 2005.
Based on the assumption that the females are more T&A-specific labor than the male and that the T&A industry is female-labor-intensive industry, the simple theoretical model developed by Robertson and Trigueros-Argüello (2011) anticipates that an adverse (positive) price shock will transform into a relative decline (rise) in the T&A wages in relation to other sectors in the SR and a relative drop in women wages compared with men wages across all sectors in the LR. The empirical findings of the post-MFA/ATC variations support the predictions of the theoretical model in the case of Pakistan.
Footnotes
Appendix
Performance of Asian Economies in Textile and Clothing Exports.

| Values in U.S. million dollars | |||||||||||||||||
|---|---|---|---|---|---|---|---|---|---|---|---|---|---|---|---|---|---|
| S. no. | Country | Exports in 1995 |
Exports in 2000 |
Exports in 2005 |
Exports in 2007 |
Rank in exports |
|||||||||||
| Textile | Clothing | Total | Textile | Clothing | Total | Textile | Clothing | Total | Textile | Clothing | Total | 1995 | 2000 | 2005 | 2007 | ||
| 1 | China a | 13,918 | 24,049 | 37,967 | 16,135 | 36,071 | 52,206 | 41,050 | 74,163 | 115,213 | 55,968 | 115,238 | 171,206 | 1 | 1 | 1 | 1 |
| 2 | Hong Kong | 13,815 | 21,297 | 35,112 | 13,441 | 24,214 | 37,655 | 13,830 | 27,292 | 41,122 | 13,417 | 28,765 | 42,182 | 2 | 2 | 2 | 2 |
| 3 | Turkey b | 2,527 | 6,119 | 8,646 | 3,672 | 6,533 | 10,205 | 7,076 | 11,833 | 18,909 | 8,731 | 14,001 | 22,732 | 5 | 6 | 3 | 3 |
| 4 | Republic of Korea | 12,313 | 4,957 | 17,270 | 12,710 | 5,027 | 17,737 | 10,391 | 2,581 | 12,972 | 10,373 | 1,914 | 12,287 | 3 | 3 | 5 | 5 |
| 5 | India | 4,358 | 4,110 | 8,468 | 5,570 | 5,960 | 11,530 | 8,285 | 8,595 | 16,880 | 9,446 | 9,655 | 19,101 | 6 | 5 | 4 | 4 |
| 6 | Taipei | 11,882 | 3,251 | 15,133 | 11,891 | 3,015 | 14,906 | 9,706 | 1,561 | 11,267 | 9,720 | 1,254 | 10,974 | 4 | 4 | 6 | 7 |
|
|
|
|
|
|
|
|
|
|
|
|
|
|
|
|
|
|
|
| 8 | Indonesia | 2,713 | 3,376 | 6,089 | 3,505 | 4,734 | 8,239 | 3,353 | 4,959 | 8,312 | 3,829 | 5,870 | 9,699 | 9 | 7 | 8 | 9 |
| 9 | Japan | 7,178 | — | 7,178 | 7,023 | 534 | 7,557 | 6,905 | 495 | 7,400 | 7,108 | 523 | 7,631 | 7 | 8 | 10 | 10 |
| 10 | Thailand | 1,937 | 5,008 | 6945 | 1,958 | 3,759 | 5717 | 2,764 | 4,085 | 6849 | 3114 | 4,073 | 7187 | 8 | 10 | 11 | 11 |
| 11 | Bangladeshb,c | 432 | 1,969 | 2,401 | 393 | 5,067 | 5,460 | 504 | 7,510 | 8,014 | 718 | 10,060 | 10,778 | 14 | 11 | 9 | 8 |
| 12 | Malaysia a | 1,129 | 2,266 | 3,395 | 1,270 | 2,257 | 3,527 | 1,356 | 2,479 | 3,835 | 1,470 | 3,159 | 4,629 | 11 | 12 | 12 | 12 |
| 13 | Philippinesa,c | 280 | 2,420 | 2,700 | 297 | 2,536 | 2,833 | 269 | 2,287 | 2,556 | 222 | 2,283 | 2,505 | 13 | 14 | 15 | 15 |
| 14 | Srilankaa,c | 164 | 1,758 | 1,922 | 244 | 2,812 | 3,056 | 136 | 2,874 | 3,010 | 176 | 3,283 | 3,459 | 15 | 13 | 13 | 13 |
| 15 | Singapore | 1,496 | 1,464 | 2,960 | 907 | 1,825 | 2,732 | 916 | 1,696 | 2,612 | 969 | 1,779 | 2,748 | 12 | 15 | 14 | 14 |
Source. Textile Asia, September–October 2008 and October 2004, from Sheikh (2009).
Includes significant exports from processing zones. bFigures refer to fiscal year. cEstimates.
Author Note
Jabbar Ul-Haq and Ahmed Raza Cheema is now affiliated to Department of Economics, University of Sargodha, Pakistan.
Declaration of Conflicting Interests
The author(s) declared no potential conflicts of interest with respect to the research, authorship, and/or publication of this article.
Funding
The author(s) disclosed receipt of the following financial support for the research, authorship, and/or publication of this article: This study was financially supported by China Scholarship Council (CSC No. 2013586101).