
Abstract
Self-service technologies (SSTs) fervently impact customer’s interaction with service firms to foster positive outcomes. This study intends to inspect the impact of SSTs service quality on loyalty and behavioral intention of Pakistani SSTs users directly and indirectly through technology trust. By using an anonymous survey questionnaire, this study collected the data from a sample of 421 mobile banking application users. This study applied structural equation modeling (SEM) by using the AMOS. Results revealed the partial mediation of technology trust between SSTs service quality and behavioral intention and loyalty. Finally, this study also provided theoretical and practical implications as well as limitations and directions for future research.
Keywords
Introduction
Our society stands on the brink of a fourth industrial revolution evolving at an exponential pace, characterized by technological revolution with the breakthrough in fields of robotics, artificial intelligence, the internet of things, and many more. The third industrial revolution transformed the agricultural societies into industrial and then into service-based societies (Helbing, 2015). Digital applications such as Information Communication Technologies (ICTs) and e-Commerce are facilitating millions of people including entrepreneurs and small businesses in developing economies and have produced new methods for income generation (United Nations Information Economy Report, 2017). Thus, service circumvents us and plays a significant part in our economies (Grönroos, 2007). The service sector establishes the foundation of growth and well-being of contemporary society by contributing more than 70% in the GDP of advanced economies (Ostrom et al., 2010). Accordingly, developing economies, traditionally viewed as manufacturing centers, are also increasing their proportion of GDP related to services (Central Intelligence Agency-US, 2017, for example, see Brazil—72%, India—45%, China—52%, Pakistan—56%).
Self-service technologies (SSTs afterward) is the technological interface that enables customers to get their services done without service employee involvement (Meuter et al., 2005). SSTs such as internet-based services, self-checkouts, interactive kiosks, automated airline check-in systems, e-Learning, e-Logistics, e-Commerce, e-Government, e-Purchasing, e-Finance, e-Travel, e-Communication, and TV shopping are growingly being applied in the service delivery processes (Lee, 2015). So, the conventional boundary between the service provider and customer has shifted toward self-service (Vargo & Lusch, 2008).
Furthermore, it is expected that SSTs services will continue to evolve and will show an imperative role in the transfer of services. This “Servitisation” highlights the growing significance of services to the economy and offers an indication of the aggregate recognition in the service research arena. It is likely to make a key influence on the economy as academic literature (Ranaweera & Sigala, 2015).
Based upon “Stimulus–Organism–Response (S-O-R) approach” (Eroglu et al., 2001, 2003; Hsu et al., 2012; Woodworth, 1928), technology trust acts as an intermediary psychological paradigm (Keinan & Zeidner, 1987; Liu, 2012; Muller et al., 2005). So, this study posits that SSTs service quality as a stimulus affects the internal organismic states of users of SSTs service quality in terms of their perceptions of technology trust processes that mediate between the SSTs service quality and the individual’s responses-SSTs users’ behavioral intention and loyalty in the Pakistani service sector.
The research context for this study is emerging Pakistani services sector-contributing currently 59.16% of GDP (Economic Survey of Pakistan, 2017–2018). Besides, through the substantial rise of nationwide telecommunications infrastructure in terms of mobile, fixed, and fiber connectivity, Pakistan with 141 million cellular subscribers as compared to past, with high technology diffusion rate in terms of 3G and 4G mobile internet subscriptions crossed 74 million users along with 76 million broadband subscribers in November 2019, is transforming itself into a knowledge-based economy and an information society (Pakistan Telecommunication Authority, 2019).
Moreover, recently a fundamental refurbishment of Pakistan’s communications framework—digital TV, a fiber optic cable, and submarine landing station for internet traffic flow—is envisioned by both Beijing and Islamabad under their “Long-Term Plan (LTP) for the China-Pakistan Economic Corridor” (CPEC Long-Term Plan, 2017). Besides, between 2012 and 2015, approximately 16 million Pakistanis went online enabling Pakistan one of the top 10 economies in terms of internet users (ninth as compared to India—first, Iran—seventh, and Bangladesh—10th) (United Nations Information Economy Report, 2017). So, with this background, it is significant to explore whether Pakistani consumers prefer SSTs services or some conventional service delivery method.
The previous empirical work (see Table 3) reports that while using the specific system, the consumers experience trust-related problems. Technology trust is a belief of competent and reliable performance that influences customers’ attitudes, behavioral intentions, and actual behavior perceptions with SSTs (Dimitriadis et al., 2011; Johnson, 2007; Schlosser et al., 2006). Moreover, the literature points out that studies on the SSTs adoption have majorly focused on developed economies and less scholarly attention has been devoted to the developing countries’ context (Lee, 2015; Smale, 2005). This results in the lack of understanding of the phenomena of SST adoption, usage intention, and trust in technology, particularly from the developing economies’ perspective. The technology user’s reaction to particular SSTs differs in comparison to the channels type, nature, and trust in technology. Therefore, to address this gap and to attain a more refined view regarding the trust implications in the technology-related services in terms of their acceptance and post-adoption behavior, it is needed to discover more about the users’ trust in technology applications (Mcknight et al., 2011).
Particularly, Pakistani banks are offering a high level of SSTs-based service quality to their customers to increase their attractiveness and cost-effectiveness (Aslam et al., 2019). Thus, considering the current technological epoch of the service sector in Pakistan, this study aims to know how digital banking-based service quality develops customer trust on SSTs and thereby customer loyalty and behavioral intention.
Therefore, from the emerging and developing economies’ perspective, this study contributes in the following ways: First, based upon “Stimulus–Organism–Response (S-O-R) approach (see, for example, Dashti et al., 2019; Kim & Park, 2019) and by applying structural equation modeling (SEM) (Jilani et al., 2020; Uddin et al., 2020), it probes how and why service quality of SSTs impacts on customer behavioral intention and loyalty directly and indirectly through the mediation of technology trust in the less researched context of developing country, that is, the evolving digital banking landscape of Pakistan. Second, by proposing and testing the mediating role of technology trust, this study enriches different theoretical paradigms presented in the literature as a theoretical background (see, for example, diffusion of innovations (DOI)—Rogers, 1995; technology readiness (TR)—Parasuraman, 2000; Technology Acceptance Model (TAM)—Davis, 1989; Technology Readiness and Acceptance Model (TRAM)—Lin et al., 2007; Service Profit Chain—Heskett et al., 1997; The Unified Theory of Acceptance and Use of Technology (UTAUT)—Venkatesh et al., 2003; Service Dominant Logic (S-D logic)—Vargo & Lusch, 2004b). Finally, practically, this study provides novel insights for the banking sector to know how to develop loyal customers’ base by nurturing the customers’ trust in digital banking through the provision of SSTs service quality. Thus, the results offer insights for the service firms especially relating to banking retail sector to advance their strategies in terms of how to serve their customers in a better way using the technological interface in the service delivery process.
Following the introduction, section “Theoretical Background and Conceptual Framework” introduces the theoretical background, and conceptual framework covering the S-O-R model in terms of SSTs service quality-technology trust-behavioral intention and loyalty followed by hypotheses development based upon the concerned theoretical lenses, and empirical findings. In the “Data and Methodology” section, the study delineates the data and methodology. Section “Data Analysis and Results” illustrates the data analysis and results of the measurement and structural model. Finally, section “Discussion” discusses the results followed by the conclusion in terms of both practical and theoretical implications as well as limitations and directions for future research.
Theoretical Background and Conceptual Framework
S-O-R Model
The S-O-R model advocates that an individual’s behavioral response is derived through some cognitive and emotional state incited by certain environmental features (Jacoby, 2002; Russell & Mehrabian, 1974). The S-O-R model has been extended to computer, website experience, and advertising context (Eroglu et al., 2003; Mollen & Wilson, 2010; Olney et al., 1991). It has also been found suitable to elucidate the tourist behavior in theme park context, motion pictures, and many other consumer behavior-related areas (Rajaguru, 2014; Reitz, 2012; Rose et al., 2012). The previous researches extended the S-O-R model by integrating some additional variables, that is, perceived service quality and cognition to envisage consumer behavior (Jacoby, 2002; Kim & Moon, 2009).
The S-O-R model widely captured the consumer behavior in relation to ICTs, innovative technologies, and impulsive buying behavior in the context of mobile auction (Chen & Yao, 2018), co-creation in a social media community context (Kamboj et al., 2018), user engagement with online brand communities (Islam & Rahman, 2017), loyalty in online social commerce (Wu & Li, 2018), and satisfaction and pleasure with smart watches (Cho et al., 2019).
In the S-O-R model, the stimulus is defined as the factor affecting the user’s internal state (Eroglu et al., 2001). In a virtual environment context, stimuli is the consumer internal state that is affected by the characteristics of the online brand community infrastructure (Mollen & Wilson, 2010). The organism refers to an individual’s affective and cognitive state consisting of the entire process that mediates between stimuli and response. The response is referred to as the consequences of the user’s behavior toward a certain object or brand (Kim et al., 2020).
Stimulus-SSTs Service Quality
Baron et al. (2014) outline the development of the service marketing research domain in four phases. During Phases 1 and 2 (pre-1988 and 1988–1997), the focus is to conceptualize and develop valid and reliable measures of the overall domain of services marketing such as service quality, self-service, service design, service encounter, customer satisfaction, and relationship marketing. For example, both SERVQUAL and SERVPERF’s operationalization treat service quality with its five core dimensions (reliability, tangibility, responsiveness, empathy, and assurance) (Parasuraman et al., 1988). Phases 3 and 4 (1998–2003 and 2004–to date) are about the evolution and commercialization of the World Wide Web to provide self-service alternatives in the context of an organization (Meuter et al., 2000).
Moreover, DOI (Rogers, 1995) especially toward SSTs in terms of customers’ innovation adoption behavior has attracted researchers for decades (Curran & Meuter, 2005; Lin & Chang, 2011). Rogers (2003) provides six phases of innovation adoption behavior (awareness, investigation, evaluation, trial, repeated use, and commitment). However, most previous studies have focused on the two stages (evaluation and trial stage). So, a vital question is “what forces constant SSTs usage over time?” In this regard, Parasuraman (2000) explains the advantages and disadvantages of technologies along with the favorable/unfavorable opinion of technology users. Therefore, customer’s innovativeness and optimism and little discomfort and insecurity to use SSTs depend upon the beliefs that SSTs are convenient, effective, flexible to use, and can be controlled.
The personality dimensions of technology readiness (TR) are initially applied as a predictor of TAM (Perceived Usefulness—PU, Perceived Ease of Use—PEOU) originated from TRA as antecedents to attitude variables (Ajzen & Fishbein, 1975; Davis et al., 1989). However, later on, associated with PU and PEOU, a Technology Readiness and Acceptance Model (TRAM) was introduced in SSTs adoption literature considering E-Services, ATM services, online delivery system, and so on (Chen et al., 2009; Kaur & Gupta, 2012; Kumar & Zillur, 2017; Walczuch et al., 2007).
Given the service science perspective, Vargo and Lusch (2004a) proposed that firms should concentrate on their products concerning the services offered to their customers. The S-D Logic is concerned with “the service is exchanged for service and the uses of competences, knowledge, and skills for the advantage of another party.” So, all firms, markets, societies, and economies are service-based (“Service-Dominant Logic,” 2017). Furthermore, “co-creation is intrinsic in service businesses in which market offerings based on quantity, quality, and attributes truly shape the service encounter” (Bitner et al., 2000; Solomon et al., 1985). Therefore, currently, a greater focus is on a unifying approach toward marketing through service (Vargo & Lusch, 2004a) in different E-Service applications context and to measure different SSTs service quality dimensions. As shown in Tables 1 and 2, in terms of squared multiple correlations (R2), and beta coefficient (β), these SSTs service quality dimensions together and individually explain variance in SSTs service quality, satisfaction, behavioral intention, and loyalty significantly (p ≤ .05).
SSTs Service Quality With Nonhierarchical Measurement Models.
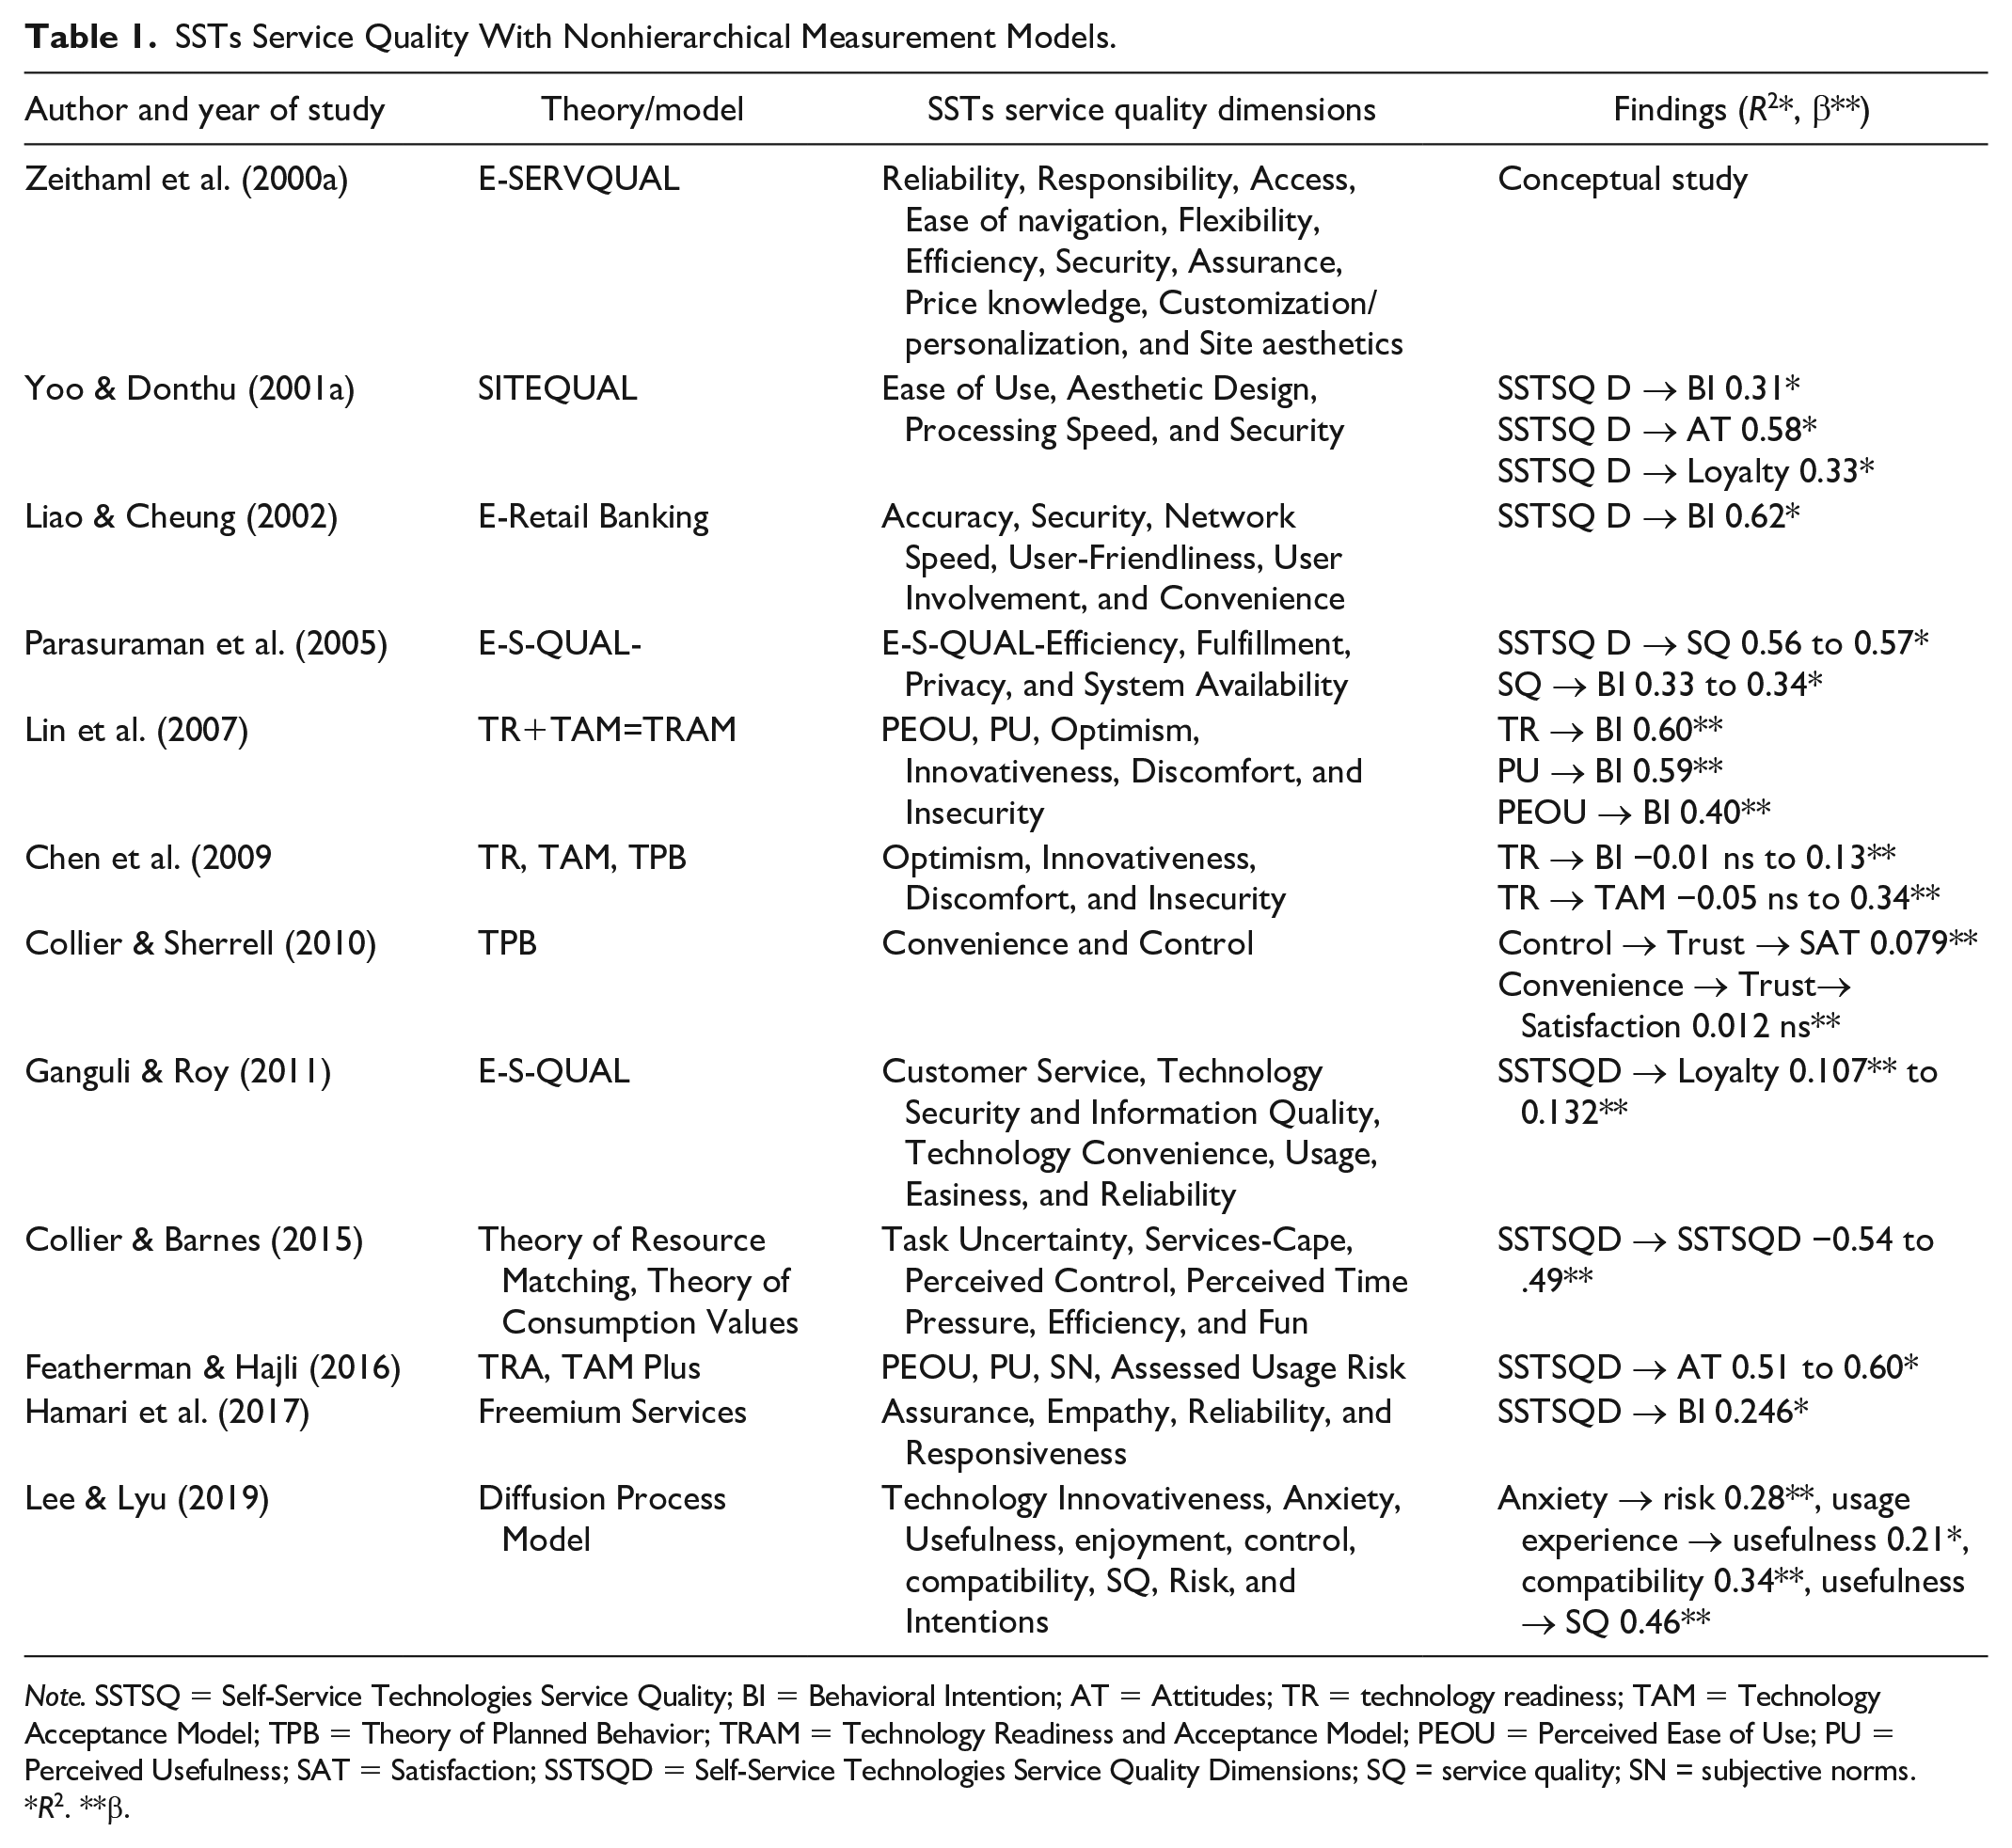
Note. SSTSQ = Self-Service Technologies Service Quality; BI = Behavioral Intention; AT = Attitudes; TR = technology readiness; TAM = Technology Acceptance Model; TPB = Theory of Planned Behavior; TRAM = Technology Readiness and Acceptance Model; PEOU = Perceived Ease of Use; PU = Perceived Usefulness; SAT = Satisfaction; SSTSQD = Self-Service Technologies Service Quality Dimensions; SQ = service quality; SN = subjective norms.
R2. **β.
SSTs Service Quality With Hierarchical Measurement Models..
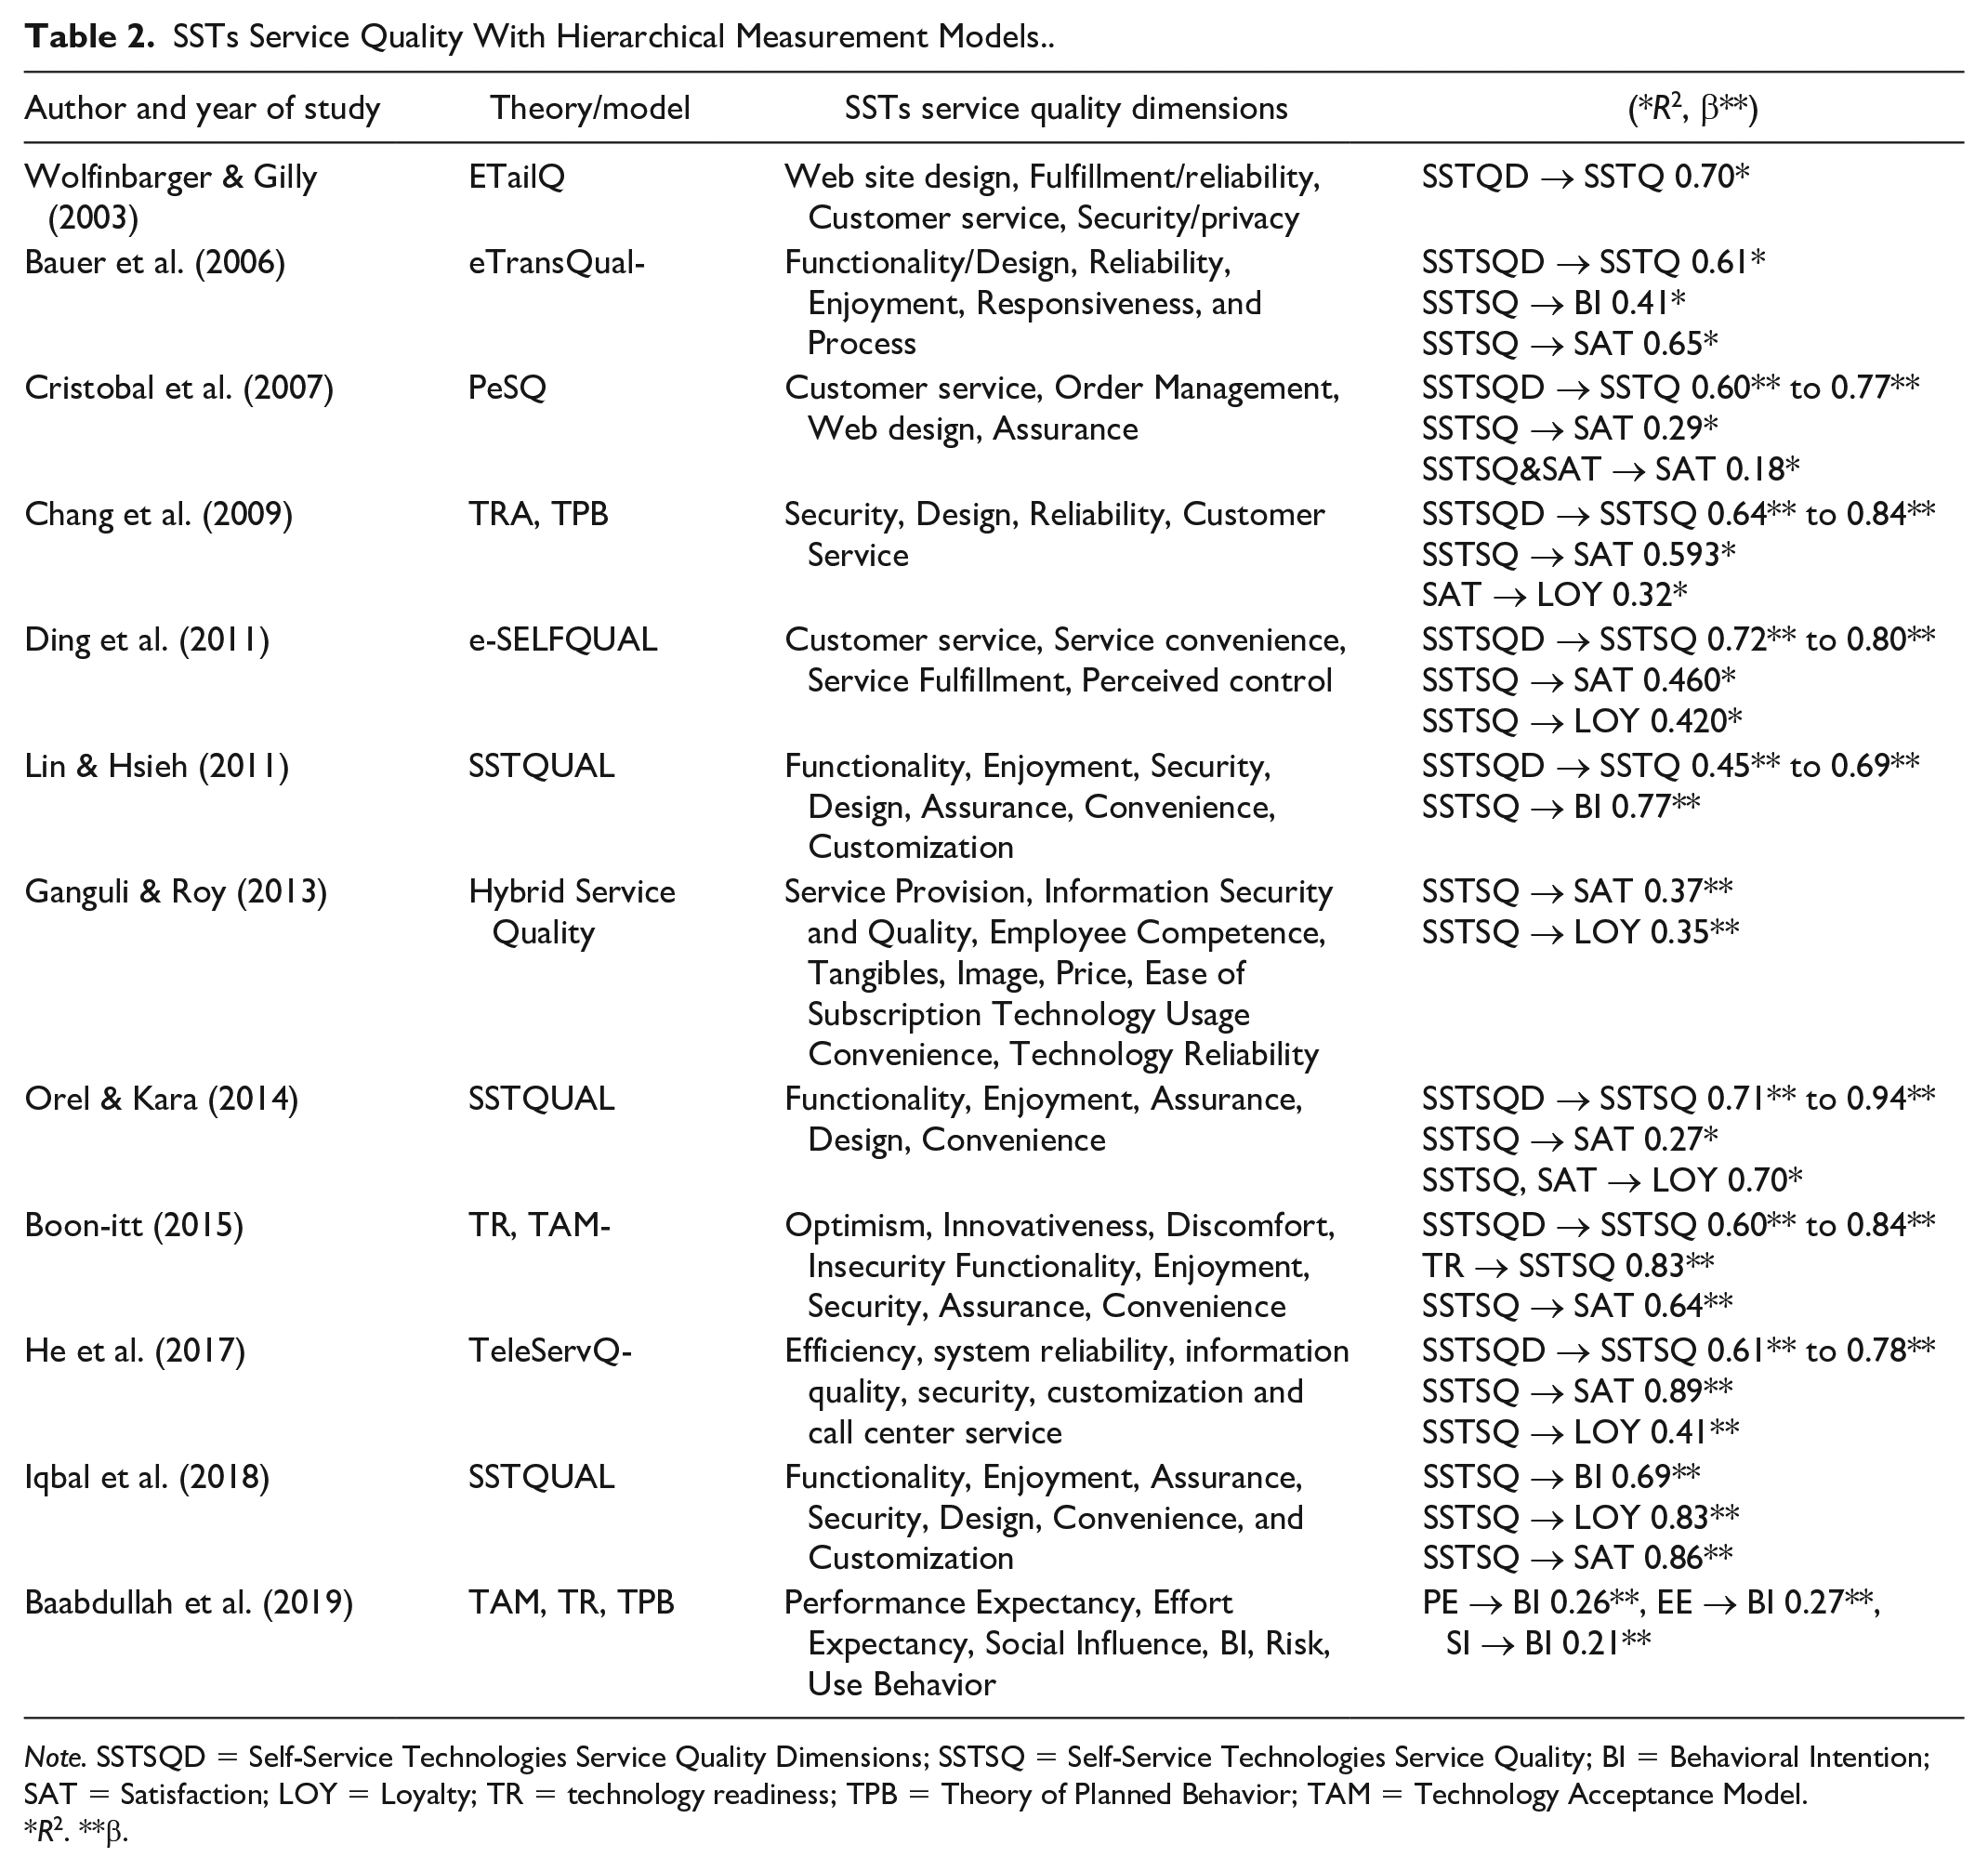
Note. SSTSQD = Self-Service Technologies Service Quality Dimensions; SSTSQ = Self-Service Technologies Service Quality; BI = Behavioral Intention; SAT = Satisfaction; LOY = Loyalty; TR = technology readiness; TPB = Theory of Planned Behavior; TAM = Technology Acceptance Model.
R2. **β.
However, among the SSTs service quality studies, as shown in Table 1, most of the studies are based on non-hierarchical measurement models, and limited studies as shown in Table 2 have developed the hierarchical models to conceptualize SSTs service quality in terms of multiple first-order dimensions and their manifest items to fully capture the entire domain of SSTs service quality—the second-order construct.
Therefore, by following the unifying approach toward marketing through service (Vargo & Lusch, 2004b) and Service Profit Chain (Heskett et al., 1994), this study considers the SSTs service quality variable as a second-order latent construct with seven multidimensional first-order constructs representing a distinctive facet of the inclusive latent construct of SSTQUAL—functionality, enjoyment, security, design, assurance, convenience, and customization (Lin & Hsieh, 2011) to explain the variance in technology trust, and thereby behavioral intention and loyalty significantly.
Stimulus-Organism: SSTs Service Quality and Technology Trust
To formulate a successful SSTs’ marketing management strategy, corporations need an in-depth understanding of how technology trust is created and how it impacts consumer’s behavioral intention in the SSTs’ context. Bart et al. (2005) found that privacy and order fulfillment in travel sites followed by navigation and brand strength in sports, automobile, and financial services sites are regarded as an important antecedent of online trust and online trust partially account for a Website, consumer characteristics, and behavioral intention. Therefore, SSTs service quality dimensions represent trust cues that transmit the trustworthiness of the SSTs to customers’ minds (Chiu et al., 2019; Corritore et al., 2003; Grabner-Kräuter & Kaluscha, 2003; Ribbink et al., 2004) in terms of their beliefs in SSTs provider’s honesty, benevolent, and integrity in the provision of consistent, well-established, reliable, and credible SSTs service quality (Kantsperger & Kunz, 2010). Thus, technology trust refers to reliance kept by clients on SSTs service quality as a consequence of her or his perceptions regarding SSTs quality features (e.g., see Table 3). As shown in Table 3, in terms of squared multiple correlations (R2), and beta coefficient (β), these SSTs service quality dimensions together and individually explain variance in technology trust, behavioral intention, and loyalty significantly (p ≤ .05).
Trust Studies in Technology Settings.

Note. SSTSQD = Self-Service Technologies Service Quality Dimensions; BI = Behavioral Intention; SAT = Satisfaction; LOY = Loyalty; n.s. = non-significant; SSTSQ = Self-Service Technologies Service Quality; PEOU = Perceived Ease of Use; PU = Perceived Usefulness; SST = Self-Service Technologies; TAM = Technology Acceptance Model.
R2. **β.
Thus, from the findings mentioned above, this study asserts that trust in technology is the willingness to depend on technology to undertake certain tasks as technology hold the positive features of functionality (capabilities to execute a job or accomplish an outcome), effectiveness (capabilities to perform and operate when needed), and reliability (capabilities to work constantly without failure), thus reflecting SSTs customer’s beliefs regarding SSTs service quality to perform when needed (Mazey & Wingreen, 2017; Mcknight et al., 2011). Therefore, this study hypothesizes:
S-O-R
SSTs service quality-technology trust-behavioral intention and loyalty
Originally, Service Profit Chain (Heskett et al., 1997; Heskett & Schlesinger, 1994) posits that the growth and profitability of an organization depend on its capability to generate loyal customers. By illustrating how the company inside, that is, employees and organization, impacts the outside, that is, customers’ experiences and performance (Andreassen et al., 2016). However, the precise precursors of customer loyalty have not been generally agreed upon within the SSTs service quality context (Froehle & Roth, 2004). Parasuraman and Grewal (2000) posed the question about the relevant factors involve in achieving customer retention/loyalty when customers interact with technology rather than employees. Failure to answer these research questions could impair the marketing strategies and their effectiveness to increase customer loyalty from SST-based services.
Therefore, within the SSTs context, attainment of customers’ loyalty remains one of the critical management issues of the current scenario (Luarn & Lin, 2003). However, in prior research within the context of SSTs (see Tables 1 and 2), behavioral intention and loyalty are attributed directly and indirectly through satisfaction with SSTs service quality (Aw Eugene, 2019; Iqbal et al., 2018; Paul & Jacob, 2019). However, customers are skeptical that how SSTs could satisfy their needs unmet. Moreover, customers are uncertain about the SSTs’ technological feasibility and security. Therefore, this uncertainty compels them to doubt the integrity of SSTs. Furthermore, without the personal interaction and social cues such as the observation, body language of buyers, ability to feel, touch, and inspect products, and have to hand over sensitive information, customers could perceive SSTs as riskier in nature (Reichheld & Schefter, 2000; Ribbink et al., 2004). Thus, this study further hypothesizes:
Due to the differences in human-technology exchanges, many customers trust the SSTs-technological artifact itself by showing their reliance on the ability, character, strength, or truth of SSTs. In this technology-mediated environment, trust in technology is a challenge for managers and a key research issue for academia (Chiu et al., 2019; Dimitriadis & Kyrezis, 2010; Hassan & Semerciöz, 2010; Schlosser et al., 2006; Semerciöz et al., 2011). However, the extent of SSTs’ trustworthiness in terms of having the capability to complete a task, and work consistently, makes customers ready to accept the potential susceptibility linked to their interactions with SSTs (Chiu et al., 2019; Mcknight et al., 2011).
Therefore, trust in technology as a condition for exchange is believed to increase customer loyalty toward SSTs use (Cyr, 2008). However, cultivating trust in SSTs is a time-consuming process, involves initial formation and engendering of trust by demonstrating SSTs’ self-service quality features (Fung & Lee, 1999). Therefore, the proposed model in Figure 1 postulates that trust in SSTs establishes a psychological coping response to “performance ambiguity.” Therefore, technology trust is the potential mediator of the SSTs service quality features’ impact on overall SST users’ Loyalty and behavior. Keeping in view the above discussion, this study hypothesizes:

Conceptual framework.
Theory of Planned Behavior (TPB; Ajzen, 1985, 1991) postulates that a stimulus for example, customer’s belief as well as their rational cognitive assessments of the contact episode (SSTs Service Quality) influence various customer attitudes (e.g., Trust in Technology). Fishbein and Ajzen (1975) pronounce attitude as “a person’s general feelings of favorableness or un-favorableness towards some stimulus object” and it has been found that attitude is manifested as one or more combinations of enduring characteristics including trust (Jamal & Adelowore, 2008; Malhotra & Mukherjee, 2004; Yagil, 2001). As a result, these attitudes drive customer intention and loyalty to a service provider (Froehle & Roth, 2004; Heskett & Schlesinger, 1994; Kellogg & Chase, 1995). Thus, this study asserts that people behave under their attitudes (Fishbein & Ajzen, 1975; Michelle Bobbitt & Dabholkar, 2001).
The attitude–behavioral intention relationship directs that to perform certain behaviors people formulate intention (Davis et al., 1989). This attitude–behavioral intention relationship has been tested by the researchers and is also valid in the technology adoption literature (see Tables 1–3). Especially, relationship marketing is based on the footing of trust and views it as an instrument to grow and keep profitable mutual relations and thus considers it as mediating construct (Berry, 2000; Ganesan, 1994; Kantsperger & Kunz, 2010; Palmatier et al., 2006). Therefore, keeping in view the SSTs’ relational nature, this study expects that trust in SSTs mediates the impact of paradoxical experiences on SST users’ behavioral intention.
Therefore, this study posits that SSTs service quality along with technology trust is important for effective Self-Service outcomes, the SSTs users’ behavioral intention and loyalty. Thus, further hypothesizes that:
Putting in a nutshell, this study is grounded on the S-O-R model (see Figure 1). In devising the S–O–R approach, Woodworth (1928) argues that the “stimulus-response relationship is mediated by Organism and assumed as a dynamic processor in a stimulus-response association.” This psychological mediator helps to elucidate this mechanism (Johnson et al., 2008; Keinan & Zeidner, 1987). Following this S-O-R framework, this study incorporates the SSTs service quality as the stimulus, technology trust as organism and loyalty and behavioral intention as a response. Furthermore, SSTs service quality is measured by its seven core dimensions proposed by (functionality, enjoyment, security, assurance, design, convenience, and customization) (Lin & Hsieh, 2011).
Data and Methodology
Sampling and Data Collection Procedure
The studied population consists of Pakistani users of SSTs (i.e., Mobile Banking Application users). Due to the large population of SSTs users, randomization was impossible, so, to draw the sample of subjects from the SST users; this study by adopting the non-probability sampling technique uses purposive sampling. The sample size for AMOS-LISREL methodologies was assessed through Christopher Westland (2010) formula. In this regard, Soper (2015) prior sample size calculator for structural equation models was utilized to calculate the required sample size to detect the effect. Moreover, as shown in the conceptual framework, technology trust mediates the effect of SSTs service quality on loyalty and behavioral intentions; therefore, in this study, for the joint significant test where measurement error exists, required sample size to detect the mediated effect of more than 405 was targeted for .80 power (Fritz & MacKinnon, 2007).
Data collection is done through an anonymous online survey using Google Docs (Google Inc.). The survey questionnaire includes a brief description of the research project followed by SSTs users’ demographics and then variables of the study. Respondents are mobile banking application users and they were invited through emails and social media. The respondents were sent a reminder to complete the survey through emails and social media to enhance the response rate. To enable quick and easy input of data and to generate quantitative data, predominantly closed-ended, multiple-choice questions and Likert-type scale ranges from strongly disagree (1) to strongly agree (5) were used. The rationale behind using Google survey form was that it summarized the survey results and response times automatically.
Respondent’s Characteristics
Table 5 offers the relevant data about the sample characteristics of a total of 421 respondents, of which 317 (75.3%) were male while 104 (24.7%) were female. The education level indicates that most of the respondents have Bachelor’s and master’s level degree. The respondent’s computer knowledge revealed that most of the respondents possess the average (58.7%) while 26% and 15% of respondents were having basic and advance levels of computer knowledge, respectively. The 262 (62.2%) respondents were single while 159 (37.8%) were married. The larger portion of the respondents belongs to 18 to 35 years of age group which indicates that this age group prefers the SSTs services more.
SSTs Measurement Scales
Measurement scales are taken from the prior literature. The SSTs service quality is measured by SSTSQUAL scale developed by Lin and Hsieh (2011). This scale measures SSTs service quality with seven dimensions, including functionality, enjoyment, security, assurance, design, convenience, and customization. The scale is modified following the context of this study. Pilot testing is conducted on 50 users of mobile banking applications. Four dimensions of the instrument (functionality, enjoyment, assurance, and customization) are found to be reliable (α > .70). However, the rest of the three dimensions (security, design, and convenience) are found to be low in reliability (α < .6). Keller and Dansereau (2001) provided that while adding new items in an existing scale, the validity, as well as reliability, should be considered. Therefore, to resolve this low-reliability issue, one extra item is added in security, 1 design, 2 and convenience. 3 The additional question is developed based on reviewing relevant literature and interviewing the focused group of mobile banking application users. After the second phase of pilot testing, reliability of all dimensions is found as reliable (α > .70) (see Table 4). To measure the behavioral intention and customer loyalty, measurement scales are adopted from Cronin et al. (2000). To capture technology trust, the measurement scale is adapted from Johnson (2007).
Demographic Characteristics.

Data Analysis and Results
Validity and Reliability Analysis
Cronbach alpha (α) and first-order confirmatory factor analysis (CFA) are performed to measure the psychometric properties of each research variable. CFA is applied instead of exploratory factor analysis (EFA), as the research model is not exploratory rather theory-driven. With the help of SPSS version 21, for measuring the validity, factor analysis for the independent variable (IV; seven dimensions of SSTs service quality), mediating (Technology Trust) and dependent variables (DV; loyalty and behavioral intentions) was performed individually. The principal component analysis with varimax rotation was employed. As shown in Tables 5 to 7, all items were loaded significantly well into their respective dimensions. Besides, high values of the KMO measure of sampling adequacy (0.913, 0.674 and 0.859) along with significant Bartlett’s test of sphericity (p > .01) showed that data were suitable for structure detection and indicated the proportion of the variances in SSTs service quality, technology trust, and behavioral intentions and loyalty were caused by the underlying factors.
Factor and Reliability Analysis: (Independent Variable—Seven Dimensions of SST).

Note. SST = self-service technologies; FUN = Functionality; ENJ = Enjoyment; CUS = Customization; CON = Convenience; SEC = Security; DES = Design; ASU = Assurance; KMO = Kaiser–Meyer–Olkin.
Factor Analysis Mediating Variable.
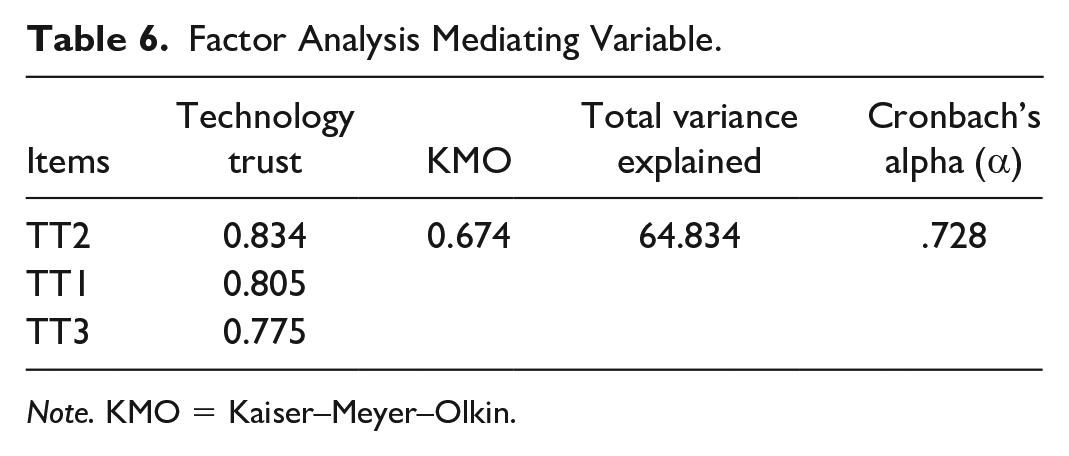
Note. KMO = Kaiser–Meyer–Olkin.
Factor Analysis Dependent Variables.

Note. KMO = Kaiser–Meyer–Olkin; LOY = Loyalty; BI = Behavioral Intention.
Besides, to access reliability, Cronbach’s alpha was used as an internal consistency measure. Cronbach alpha values for all seven dimensions except assurance of SSTs service quality along with technology trust, behavioral intentions, and loyalty were greater than the minimum threshold level of .70 showing that the scales used in this study were reliable. To assess the relative importance of each SSTs Service quality dimension, the second-order CFA is performed. This second-order SSTs service quality variable is then incorporated into the research model. AMOS-based SEM is used to estimate the path weights and overall model fit.
Correlation Analysis
Table 8 presents mean, standard deviation, and correlation analysis for all the constructs studied. All constructs show a positive and significant correlation, as indicated in Table 8. The significant Pearson correlation coefficient (r)-bivariate correlation values between the constructs ranges from .464 to .618 (p > .001 level).
Mean, Standard Deviation, and Correlation Analysis.

Note. SSTSQ = Self-Service Technologies Service Quality; BI = Behavioral Intention.
p < 0.05.
SEM
Measurement model
The second-order CFA is performed for SSTs service quality dimensions which indicate a good model fit (χ2 = 504.531, df = 223, χ2/df = 2.262, p = .000, non-normed fit index [NNFI] = 0.91, comparative fit index [CFI] = 0.92, goodness-of-fit index [GFI] = 0.90, adjusted goodness-of-fit index [AGFI] = 0.88, and root mean square error of approximation [RMSEA] = 0.055), providing evidences for SST as a second-order construct (see Table 9 and Figure 2). Furthermore, results show that standardized path weights (β) and R2 of all seven dimensions of SSTSQ were ≥.70 and ≥.50, respectively, on their latent variable, that is, SSTs service quality. In other words, this shows that the dimensions of SSTs service quality: enjoyment (β = 95, R2 = 90), assurance (β = 90, R2 = 82), security (β = 81, R2 = 65), and convenience (β = 80, R2 = 65) each having highest causal linkage and reliability with SSTs service quality followed by customization (β = 75, R2 = 57), design (β = 74, R2 = 55), and convenience (β = 73, R2 = 53) (see Table 4). The first-order CFA for other latent variables such as loyalty, behavioral intention, and technology trust is also performed. The results of CFA of loyalty and behavioral intention indicate that all items are loaded well into their respective dimensions. Similarly, the CFA of technology trust indicates that all the items loaded perfectly into one factor. The model fit indices indicate that each model is saturated, and the fit is perfect for all these three constructs. (χ2 = 0, df = 0, p = 1.00, and RMSEA = 0). Moreover, reliability analysis shows that loyalty, behavioral intention, and technology trust scales are reliable having α values equal to .759, .723, and .728, respectively, in the present sample.
SST Service Quality Dimensions Measurement Model.

Note. χ2 = 504.531, df = 223, χ2/df = 2.262, GFI = 0.90, AGFI = 0.88, TLI = 0.91, CFI = 0.92, RMSEA = 0.055, p = .000. SST = self-service technologies; GFI = goodness-of-fit index; AGFI = adjusted goodness-of-fit index; TLI = Tucker–Lewis index; CFI = comparative fit index; RMSEA = root mean square error of approximation.
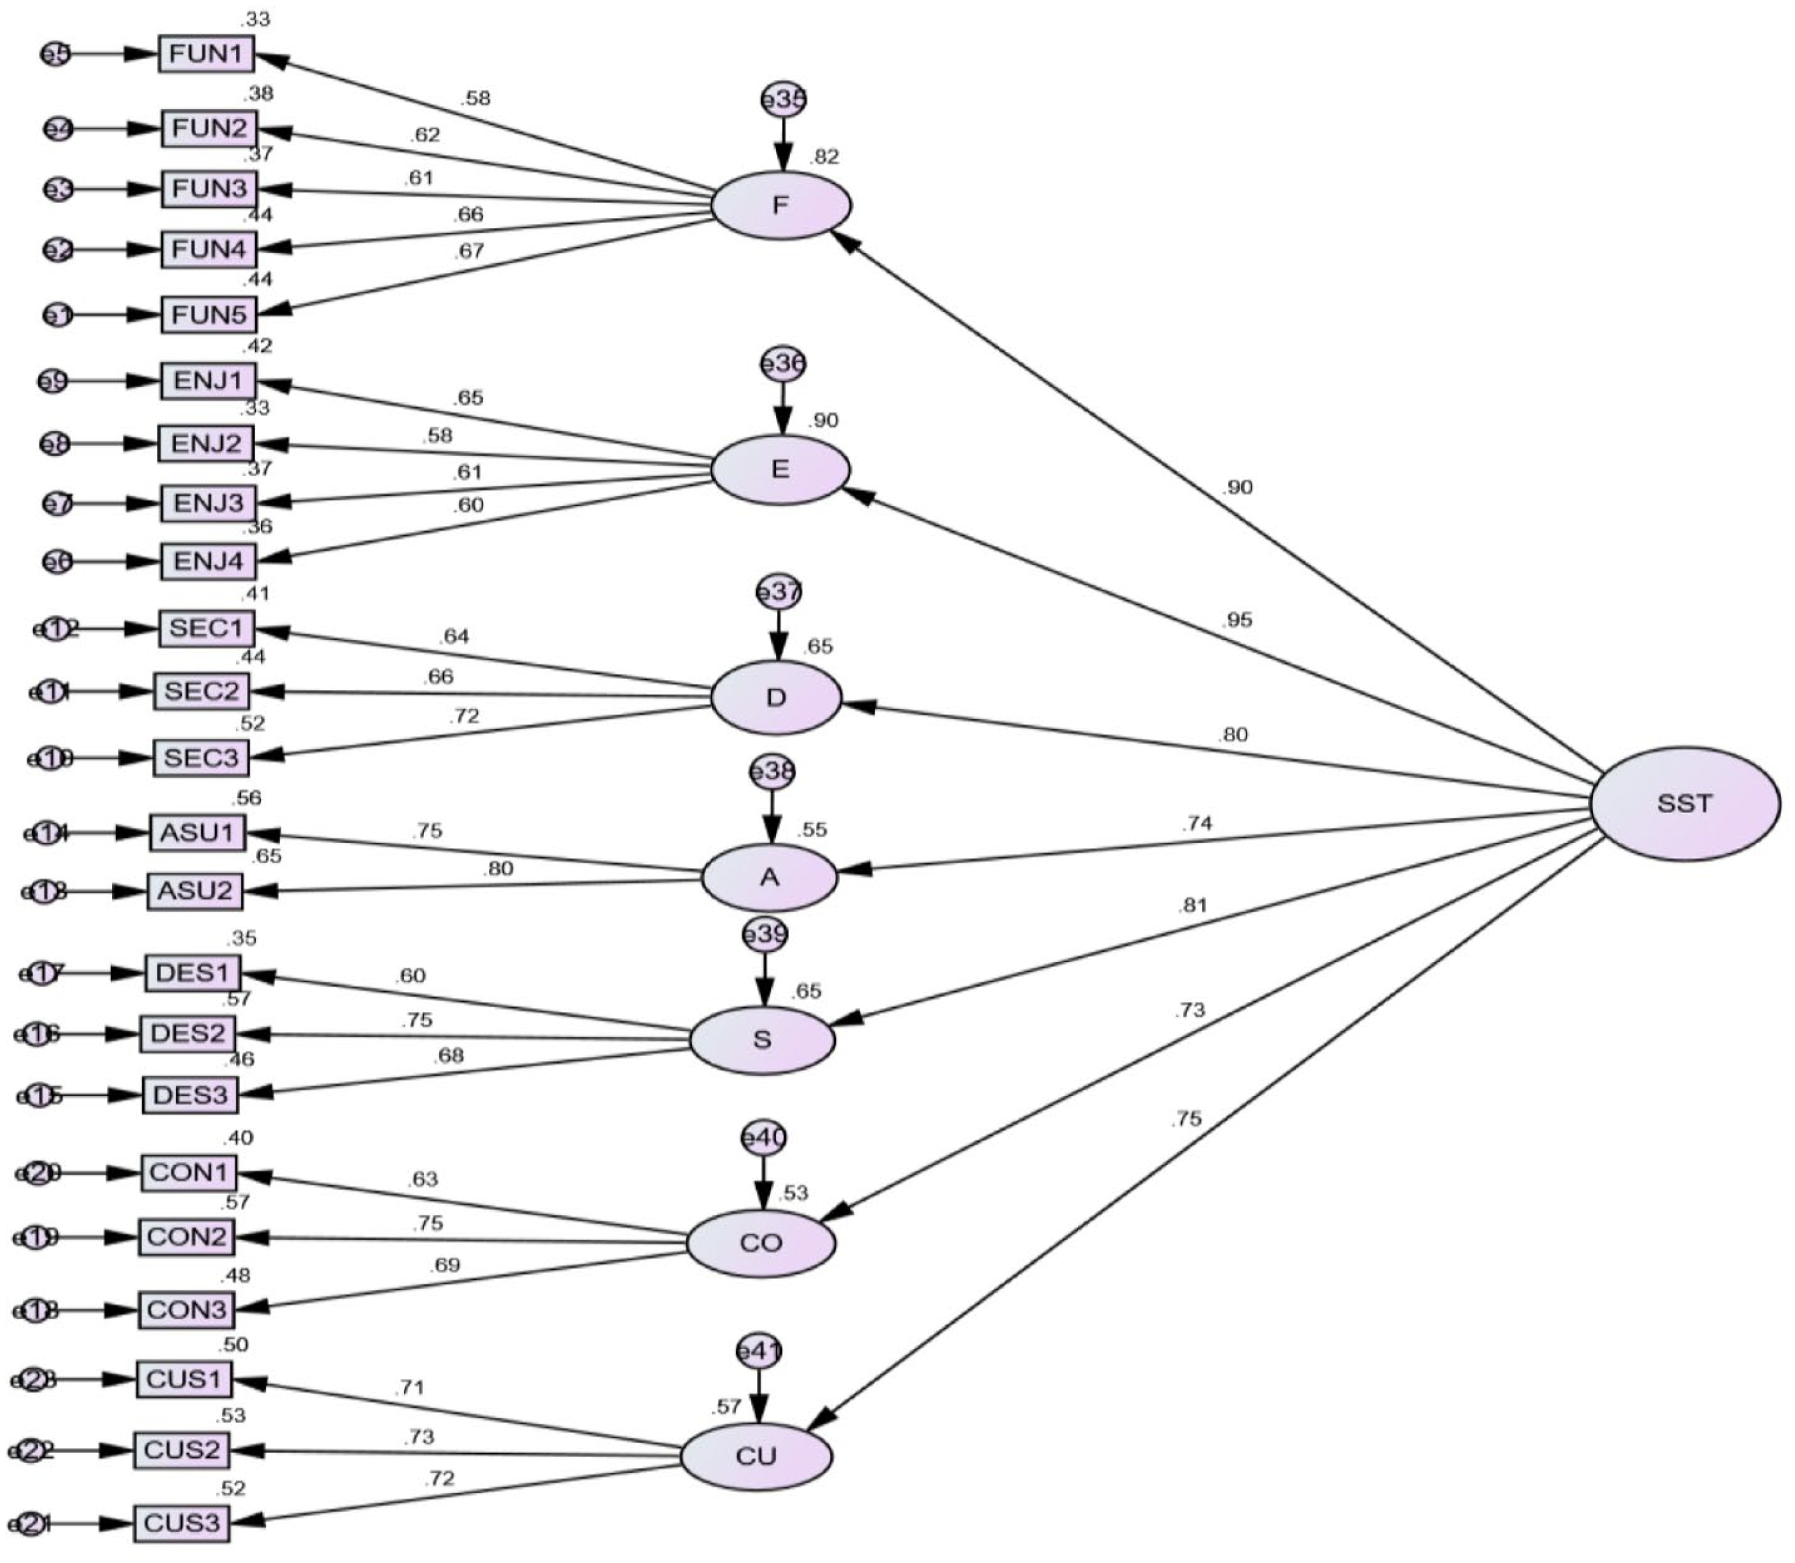
Measurement model; SST service quality dimensions.
Structural model
To investigate the relationships among SSTs service quality, technology trust, behavioral intention, and loyalty, the structural model is assessed through the covariance matrix by employing the maximum likelihood estimation (MLE) approach (Chou & Bentler, 1996). Table 10 presents the model fit indices of structural model of SSTs service quality, technology trust, loyalty, and behavioral intention (χ2 = 815, df = 497, χ2/df = 1.640, p = .000, NNFI = 0.93, CFI = 0.94, GFI = 0.90, AGFI = 0.88, and RMSEA = 0.039) which presents a good/acceptable fit. The criteria of a good and acceptable model fit were χ2/df ≤ 5, RMSEA ≤ 0.8, CFI ≥ 0.95, and TLI = 0.95 (Hooper et al., 2008).
Structural Model Results.

Note. χ2 = 815.305, df = 497, χ2/df = 1.640, RMSEA = 0.039, NNFI/TLI = 0.93, CFI = 0.94, GFI = 0.90, AGFI = 0.88, p value = .000. SSTSQ = Self-Service Technologies Service Quality; RMSEA = root mean square error of approximation; NNFI = non-normed fit index; TLI = Tucker–Lewis index; CFI = comparative fit index; GFI = goodness-of-fit index; AGFI = adjusted goodness-of-fit index.
Figure 3 illustrates the MLE parameters. The constructs in this study are analyzed from SSTs service quality to behavioral intention and customer loyalty directly and through the mediating impact of technology trust. All the hypothesized relationships are accepted as the standardized coefficient (β) values for SSTs service quality, technology trust, behavioral intention, and customer loyalty and as shown in Table 10 are significant at 1% (also see Fig. 3).

Structural model tested.
For example, Hypothesis 1 states that there exist a positive and significant impact of SSTs service quality on technology trust and the significant results prove this relationship (β = .80, t = 9.96, R2 = .63), hence supporting this hypothesis. Moreover, Hypotheses 2 and 3 state that “SSTs Service quality positively and significantly associated with Behavioral Intention and Customer Loyalty” and the results prove these relationships (β = .28, .32, t=2.65, 2.80, R2 = .75, .59), hence supporting the Hypotheses. Moreover, Hypotheses 6 and 7 state that “a positive and significant association exists between technology trust and behavioral intention & customer loyalty” and the results proved these relationships (β = .49, .63, t = 2.48, 3.41), hence supporting these hypotheses. Hypotheses 4 and 5 are related to mediation; their analysis and results are provided in section Mediation Analysis.
From Table 10, it can be observed that the R2 values range from .55 to .85, defining the predictive accuracy. Henseler et al. (2009) recommended a rule of thumb for acceptable R2 with .75 as substantial, .50 as moderate, and .25 as weak, respectively. The R2 value is adopted in various disciplines of research, but there exist no standard guidelines to determine the level of acceptance (Henseler et al., 2009).
Mediation Analysis
To test the mediation of technology trust between SSTs service quality and behavioral intention and loyalty, path analysis is performed. R. M. Baron and Kenny (1986) method is fallowed for mediation analysis. It can be observed from Table 11 that in the first step, IV: SSTs service quality is significantly and positively associated with DV: loyalty (β = .77, .69, p < .001). Moreover, in the second step, the IV: SSTs service quality is significantly and positively associated with the mediator variable: technology trust (β = .78, p < .001). However, in the third step, when SSTs service quality (IV) and Behavioral Intention and Loyalty (DV) were regressed in the presence of mediator, technology trust, the impact on a DV by independent is decreased in magnitude but it remains significant which indicates the partial mediation of technology trust between SSTs service quality and Behavioral Intention and Loyalty (β = .40, .46, p < .001), hence supporting Hypotheses 4 and 5.
Mediation Analysis.
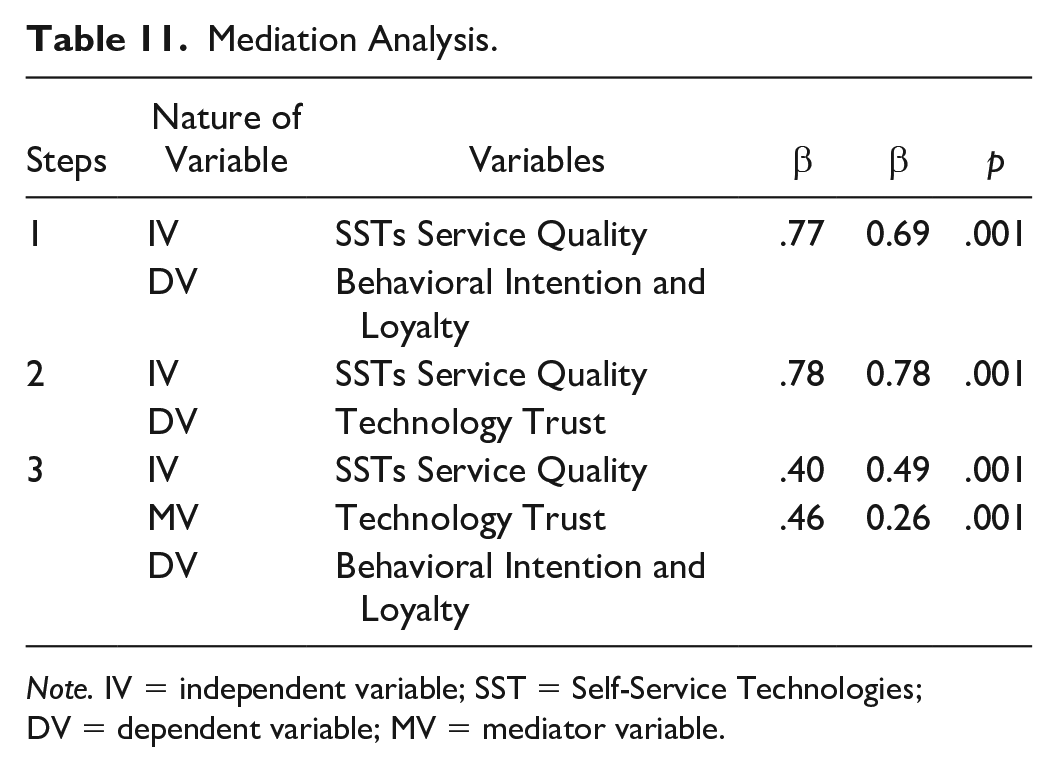
Note. IV = independent variable; SST = Self-Service Technologies; DV = dependent variable; MV = mediator variable.
Discussion
The seven-factor structure is proposed and tested in this study indicating that SSTs service quality is a multidimensional latent construct and the core dimensions that contribute significantly to predicting SSTs service quality seem to be the enjoyment followed by functionality, assurance, security, customization, design, and convenience. These results confirm the existence of the hedonic value of SSTs service quality as well as utilitarian and instrumental ones (De Keyser, 2019; Lee & Lyu, 2016).
The seven core dimensions of SSTs service quality highlight that service quality for SSTs systems (Mobile Banking applications) as a second-order latent construct has some broader set of first-order SSTs service quality dimensions—enjoyment, functionality, assurance, security, customization, design, and convenience. Thus, these findings confirm the Technology Readiness Theory that SSTs positively offer the people interfaces with a belief of flexibility, control, and efficiency (Parasuraman & Colby, 2001). Moreover, these findings also validate an extension of TAM by enriching it either with new determinants of attitude and intention (Kaushik & Rahman, 2015, 2016) or TRAM (Lin et al., 2007) and service quality model (Xu et al., 2013). Besides, these results also validate the UTAUT model put by Venkatesh et al. (2003) in terms of “performance and effort expectancy and facilitating conditions,” thus helping the marketing managers to examine the success factors of technology acceptance to design planned intervention as well as marketing and training.
Moreover, within the context of SSTs service quality → technology trust relationship, this study also validates the findings of Mou and Cohen (2015) which imply that “structural assurance, reputation, PU, system quality, and service quality” are proved as strong predictors of trust in electronic service providers, hence suggesting them to put their attention on the strategies of building trust. Moreover, these findings in the shape of significant SSTs service quality → technology trust relationship reply to the research question raised by Bart et al. (2005) that what STTs’ characteristics influence consumer trust in SSTs applications. Finally, these findings also validate the TPB (Ajzen, 1985, 1991) and its predecessor, TRA (Fishbein & Ajzen, 1975) by proving that SSTs users’ belief about SSTs service quality as a stimulus influence their persistent positive feelings or attitude including trusting toward SSTs (Jamal & Adelowore, 2008; Malhotra & Mukherjee, 2004; Yagil, 2001).
Moreover, this study within the context of “quality-value-loyalty chain” replies to (Parasuraman & Grewal, 2000) that when customers experience technology interaction, both SSTs service quality and technology trust emerge as significant predictors of SSTs users’ behavioral intention and loyalty, respectively, hence paving the way for marketing strategist to formulate effective strategies to increase loyalty.
Moreover, as loyalty has been a contemporary management issue (Iqbal et al., 2017), therefore, within the context of Pakistani SSTs users, to understand how or why a sense of loyalty and intention develop, this study also empirically tests the mediating impact of technology trust, and the findings reveal the partial mediation of Technology Trust. In other words, SSTs service quality directly and indirectly through technology trust predicts 75% of the variance in SSTs users’ loyalty and 59% of the variance in SSTs users’ behavioral intention positively and significantly.
These findings endorse the results of the prior studies (Iqbal et al., 2018; Paul & Jacob, 2019) which are conducted in SSTs context: Bart et al. (2005)—online trust for all websites; Cyr (2008)—design-trust-e-loyalty in online shopping; Palvia (2009)—trust in e-commerce relational exchange; Dimitriadis and Kyrezis (2010)—trusting beliefs-trusting intention-intention to use SSTs bank channels; and Skard and Nysveen (2016)—trusting belief in B2B Self-service. The findings of these studies imply that within the context of swift technological changes, to keep the existing customers loyal, the SSTs service providers may position or reposition their service strategies from standardized to personalized and from transactional to relational over time. Furthermore, the firms should be watchful to maintain the customers and trustworthy relationships with their customers (Huang & Rust, 2017). However, to materialize that, SSTs providers need to incorporate a paradigm of service-ecosystem to understand the dynamic nature of SSTs’ Service Quality/value that is derived and examined by the customer (Vargo & Lusch, 2008) in terms of her or his expectations, helpfulness, functionality, and reliability because they depict how a SST exhibits trust in human-like technology trustworthiness facet: functionality to competence, helpfulness to benevolence, and reliability to integrity (Lankton et al., 2014)
Conclusion: Implications, Limitations, and Future Research
Theoretically, this study offers empirical evidence of testing and enriching the SSTSQUAL (Lin and Hsieh, 2011) in the Pakistani evolving digital banking context. The results on seven core dimensions of SSTs service quality highlight that service quality for SSTs systems as a second-order latent construct with all of its seven dimensions has some broader set of first-order SSTs service quality dimensions—enjoyment, functionality, assurance, security, customization, design, and convenience in emerging Pakistani digital banking landscape. Hence, this seven-factor SSTQUAL enriched model is better than five-factor SSTQUAL models yielded by (a) Orel and Kara’s (2014; assurance, design, functionality, convenience, and enjoyment) study conducted in Turkey within the context of super market self-Checkout, and (b) Radomir and Nistor’s (2012; assurance, design, functionality, customization, and security) study conducted in Romania banking industry. Moreover, recently within the context of financial services firm, Considine and Cormican (2017) validated only four SSTQUAL dimensions—functionality, security, design, and customization. Thus, these findings imply that seven-factor SSTQUAL enriched and validated with 23-item scale in this study is a more reliable and valid one as compared with the original 20-item SSTQUAL (Lin & Hsieh, 2011).
Finally, the study is unique in that it probes how and why service quality of SSTs impacts on customer behavioral intention and loyalty directly and through technology trust. Hence, the suggested and tested SEM model provides important insights into partially intermediary mechanism of technology trust that, to the best of the knowledge of the authors, this study was very limited within the context of SSTs service quality literature. Thus, establishing the partially mediating role of technology trust enriches different theoretical paradigms presented in the literature as a theoretical background.
Besides the implications and contributions of this study, some limitations also exist which need to be fairly acknowledged. First, until recently, in terms of skewed attributes, internet population including internet and e-mail users were considered as demographically skewed relative to the general population as the lack of representativeness in many countries is changing every year as more people getting access to the internet. In Pakistan, offline and online populations differential is closing quickly due to 3G and 4G mobile internet subscriptions crossed 74 million users in 2019. This has included Pakistan among the top 10 economies in terms of the amount of population going online, so the limitation of the skewed population will not be significant in this study (Evans & Mathur, 2005).
Second, although this study was targeted to users of SSTs based in Pakistan (Mayer et al., 1995), it provided that facets of trustworthiness in terms of trusting beliefs will develop over time and vary between non-users, early users, and experienced users and within the context of SSTs; the same is proved in the study of Arts et al. (2011) which found antecedents to innovation adoption varies for consumers’ intention to adopt an actual adoption. Thus, in our overall current model, future researches should investigate the impact of technology trust on the adoption of SSTs among both non-users and users (Nysveen & Skard, 2017).
Third, although a current study by following the other studies measure SSTs users’ perception by adapting previous reliable and valid scales, such perceptions-based scales are featured by fuzziness and uncertainty as differences in human personality and perceptions. Therefore, by following Carrasco et al. (2017), the future studies should incorporate a “linguistic multi-criteria decision-making model” for the accumulation of heterogeneous scales with sentiments related to the quality of SSTs presented by different SSTs providers via SSTs websites considering the experience of SSTs’ users on world-wide-web (www).
Fourth, this study as other studies conducted within the context of SSTs comes under B2C, so future studies should examine the role of trust in our overall model when using SSTs in B2B and C2C contexts. Finally, to attain more understanding of technology trust’s role in SSTs usage to explain how trust, satisfaction, loyalty, and behavioral intention are interrelated, future studies should integrate the current model with Expectation Disconfirmation Theory (EDT; Lankton et al., 2016), Service Dominant (S-D) Logic and Co-creation experience Model.
Footnotes
Declaration of Conflicting Interests
The author(s) declared no potential conflicts of interest with respect to the research, authorship, and/or publication of this article.
Funding
The author(s) received no financial support for the research and/or authorship of this article.