
Abstract
Tourist congestion is a significant issue in Jiuzhai Valley World Heritage Site (JVWH). The “demand-driven” approach of alternative transportation system (ATS) has led to the issues related to visitor crowding, visitor safety, and visitor experience quality. JVWH requires a more efficient approach to achieve a suitable tourist distribution while preserving the quality of visitors’ experiences. Accordingly, this study examines descriptive data, which are collected in 2015 regarding visitor use of the ATS in JVWH to spatially model current and future distribution scenarios. Researchers developed four theoretical scenarios by using the computational model which imitate the current ATS system. Imitation results indicate Scenarios 3 and 4, which adjust spot combination and tourist duration are the two most effective methods for balancing tourist distribution, and are, therefore, the most effectively ways to optimize the current ATS system. This research provides a glimpse into potential management strategies for the tourist distribution of JVWH and possibly other parks in China.
Keywords
Introduction and Research Objectives
China is a populous country, and millions of people flock to its national parks every year, which leads to tremendous tourist congestion and negatively impacts the natural structure of these parks (Pedersen, 2002; Tourism Administration of People’s Republic of China, 2005). Hence, tourism management is one of the most important issues affecting Chinese national parks. Tourist congestion and imbalance are the most popular problems in more than 80% of Chinese national parks. The Jiuzhaigou Valley Scenic and Historic Interest Area (the official Chinese name for the Jiuzhai Valley World Heritage Site [JVWH]) is a national park located in the southwest part of China (Figure 1). Covering 72,000 hectares in the northern part of Sichuan Province, the JVWH preserves a series of important forest ecosystems, including old-growth forests, which provide important habitats for numerous threatened species of plants and animals, such as the takin and the giant panda. Due to the increasing demand of tourists, in 1999, the JVWH became the first Chinese national park to adopt an alternative transportation system (ATS), which initiated a shuttle bus system throughout the national park. To adjust the spatial–temporal imbalance of their tourist congestion and streamline their tourist management, the JVWH administration department developed a strategy to regulate tourist transportation and visitation distributions. Although the ATS system contributes to the recent tourist imbalance, the JVWH still has three main tourists imbalance issues as follows:
The first concern is temporal imbalance. The second concern is a time-related imbalance. Almost all the travelers in the JVWH are 1-day travelers. According to the official data and field observations, the tourist congestion at the park gate is the highest between 8:30 and 10:00 a.m. (Figure 2) because there is a large population waiting to be distributed by different shuttle buses. Based on the field observations in this study, the highest peak of congestion occurred between 8:50 and 9:00 a.m. in the Forests and between 12:10 to 12:20 p.m. at the Colorful Lake. From random interviews of tourists at these attractions, we found that visitors are intensely frustrated about the extreme crowding and the limited duration time at each spot during these peak times.
The second concern is tourist spatial imbalance. Based on the data collected from the scenic attractions of the JVWH, we know that some areas, such as the Colorful Pool and the Colorful Lake, are congested all day long. At these attractions, the tourist instantaneous capacity far exceeds the ideal capacity, and thus the quality of the tourist experiences decreases. In contrast, some attractions are visited less frequently during the day and have low utility rates, such as the Sparks Sea. These three imbalances all lead to less satisfactory tourist experiences. Furthermore, the increasing number of tourists has already affected the natural environment, and new tourist facilities, such as shuttle bus stations, trails and restrooms, negatively influence the natural beauty and integrity of the JVWH. On October 3, 2013 (a national holiday in China), some of the failings of the current ATS were revealed at the JVWH. Tourists were annoyed by a 2-hr wait time at the Rhinoceros Sea bus station. This led to the paralysis of the entire ATS in JVWH. As a result, thousands of tourists had to walk nine miles to get out of the park. In response to issues such as this, research on the temporal and spatial distribution of tourists in the JVWH is crucial.
The third concern is seasonal imbalance. As shown in Figure 3, the JVWH’s peak season lasts through June, July, and August, and the highest point of their visitation occurs from October 1 to 10 due to a national holiday. The daily tourist flow skyrockets in the peak season, and more than 40,000 tourists flood into the national park per day. In contrast, during the off-season period, there are only a few thousand visitors per day. This seasonal imbalance also causes congestion at popular attractions, which leads to an increase in noise and a decrease in visitation time. In extreme situations, the high population density at these popular attractions would not only be inconvenient but might pose a serious threat to visitors.

Location and map of Jiuzhaigou Valley National Park.

Tourist congestion on October 3 from 2001–2007 at park gate (JVNP Management Committee, 2007b).

Tourist visitation rates from 2001–2007 in JVWH (full year) (JVNP Management Committee, 2007a).
Hence, this study is based on the JVWH ATS system’s real and demanding tourist congestion problem. The aim of this study is to determine efficient ATS distribution methods based on an analysis of the available visitation data. This study uses computational modeling imitation to suggest methods for improving ATS management and for achieving tourist satisfaction. As such, this study will contribute to the spatial–temporal tourist management of the JVWH in a number of ways.
Literature Review
In recent years, a number of tourism scholars have explored the ability of effective methods (modeling methods) to reduce spatial–temporal tourist imbalances and increase the quality of tourist experiences in national parks. The transportation mode, which involves taking shuttle buses between attractions and walking in each attraction, is the common mode of transportation in the JVWH and other national parks. In this article, the ATS system is the transportation system that is used for tourist distribution in national parks. Based on the common ATS system, some indicators should be included, such as the tourist number, the duration time, the waiting time, the number of attractions, and the connections between all attractions. These indicators are important variables that affect the spatial–temporal tourist distribution and the tourist satisfaction related to tourist congestion. The ATS system mentioned above has a direct impact on tourists’ experience, and its most important element is crowd perception. This element presents as methods of blocking under the context of scenic areas. It can be described mainly by indicators of the interaction between tourists’ recreational behaviors and the environment, which can reflect the degree of congestion indicated by tourists in the spatial–temporal diversion management system.
Some research focuses on exploring spatial structure optimization methods through the indicators related to ATS (connectivity, visiting attractions, etc.). For example, Xue et al. (2013) used several connectivity indicators to evaluate the internal tourist routes of the Mianshan Scenic Spot, pointing out its the lack of connectivity within the internal network; Peng et al. (2014) analyzed the spatial network pattern of tourist destinations from the perspective of tourist flow by obtaining the spatial trajectory data of tourists and clarified the close relationship between the tourist nodes’ visitation rate and passenger flow, which was affected by the ATS between the nodes. Wu et al. (2014) discussed the spatial distribution of the Confucius Temple Scenic Spot in Nanjing from the aspects of spatial structure, the local spatial characteristics, and spatial and social relations. The influence of the layout of the walking path for tourists is likely to lead to crowding in scenic attractions.
The above are summaries pertaining to a certain perspective on structural optimization based on ATS-related indicators. However, other scholars believe that there is a more systematic way to optimize the internal spatiotemporal distribution. Therefore, the optimization of scenic spot spatial–temporal distribution can be discussed from the systematic model of tourists’ spatial–temporal distribution. Qiu, Ge, Lai, et al. (2010) divided the space-time shunt problem into three phases. Then, based on the real demands of the JVWH, Qiu et al. (2011; Qiu, Ge, & Ren, 2010) transferred tourists from the gate to the scenic spots in a short time through the operational clustering method of the hierarchical clustering method to transform the initial diversion area and proportions. Liu et al. (2012) used the stepwise regression method and back-propagation neural network to establish a daily tourist forecast model for the Jiuzhaigou Scenic Area. For the steady-state distribution of the whole ATS system, Feng et al. (2010b) used the management entropy and the management dissipative structures to establish a mathematical model, which aims to transform the load of all the attractions at an optimal moment into an optimal equilibrium state. He also established the application framework of space-time shunt navigation management and thoroughly introduced its theories and relevant techniques, which generated a broad academic impact (Feng et al., 2010a). Later, to release the tourist capacity that does not satisfy the tourist scale, Qiu, Ge, and Ren (2010) used system dynamics attractors to simulate the flow of tourists in the scenic area. Inspired by this approach, Xiao et al. (2013) proposed a gravitational shunt distribution model for tourist demand, which guided H. W. Zhang et al. (2013) to achieve the gravitational shunt distributing model through multiobjective constraints. Ge et al. (2013) tried to simulate the fluctuation of the load rates of the attractions in different diversion schemes in the case of the “Five Distribution Flows” of the JVWH. For other national parks, X. Y. Yu, Sha, et al. (2012) used an empirical decomposition mode, the Time series Regression with ARIMA noise, Missing values and Outliers/Signal Extraction in ARIMA Time Series (TRAMO/SEATS) seasonal adjustment method, and the wavelet method (X. Y. Yu & Wang, 2014; X. Y. Yu, Zhu, et al., 2012) to analyze the characteristics of passenger flow fluctuations in the Huangshan Scenic Area. Thus, the passenger flow of the scenic area is predicted by the historical monthly passenger flow data and the least squares support vector machine (LS-SVM) combination method.
In addition, based on tourists’ perceptions, such as congestion, some scholars have studied the related methods of optimizing the existing spatiotemporal distributions and ATS. For example, Tsai and Chung (2012) added the demand of tourists into the algorithm design of the tourist route and obtained the optimal route based on the top tourist experience for the same attractions and current queuing information. Zheng (2012) proposed an intelligent dispatch algorithm by calculating the waiting time of tourists and guiding tourists to the next attraction within the current minimum waiting time; later, other factors were added to the design of the algorithm (Zheng, 2015). Hu and Song (2013) used Happy Valley as a case to design a prototype of an intelligent guiding system via the simple sorting of three influencing factors. L. Zhang and Wang (2012) studied the intelligent tour guide system of the Tianping Mountain Scenic Spot through the combination of context perception and intelligent reasoning. W. Li (2014) constructed a scenic spot tourist behavior simulation system by using agent technology, which revealed the sensitivity of the three parameters of the simulation system to the number of visitors in each attraction and so on. Huang (2009) studied the time and space behavior of tourists inside the Summer Palace Scenic Area and found that time information, spatial information, path information, and activity information can be used as cluster elements and can be thus divided into six types. Later, she used GPS (Global Positioning System) survey data and log survey data to study the activity processes, rhythm, and rules of tourists on the spatial scale of the scenic area (F.-C. Yu et al., 2018). Recently, she also studied the characteristics of the tourism behavior of mainland tourists in overseas scenic attractions (Huang & Ma, 2011) based on their time and space behaviors and analyzed the emotional experiences and processes of tourists in the Hong Kong Ocean Park through time and space.
To solve the imbalance of tourist distribution via the management of the dissipative structure theory, research has attempted to optimize the spatial–temporal distribution of tourists in Jiuzhaigou based on the simulation of the radio-frequency identification (FIRD) system. However, first, the existing studies are less likely to apply directly to planning, and second, they barely discuss the spatiotemporal distribution based on the value of the scenic area itself. At present, the research frontier of tourists’ spatiotemporal distribution in scenic areas lies in explaining and estimating, and the descriptive research has been relatively mature. While there is currently no research or corresponding adjustment methods focusing on the ideal tourist capacity in scenic areas, neither is there scenario analyses or simulations focusing on tourist will and resource endowments.
To fill this gap in the literature, the researchers involved in this study gathered crucial information about the JVWH’s tourist distribution (tour duration times, shuttle bus delivery routes, numbers of tourists delivered at each stop) and performed a modeling imitation of the distribution. This imitation will identify the proper solutions to the uneven spatial–temporal tourist distribution in the JVWH and will provide useful suggestions for park managers.
Research Methods
The research was completed in two steps to reach the objective. (a) Researchers collected tourist distribution and visitation data and analyzed the relationships between the different variables of the ATS system. This analysis indicated the key or direct variables related to ATS tourist management. (b) Researchers imitated and adjusted tourist distribution and visitation data to determine the most effective methods for improving the ATS system. Comparative and qualitative methods were used to perform the different scenario analyses. This study makes use of the analysis conducted to present more promising potential adjustments to the ATS system. First, the different scenarios presented clarify our understanding of the laws of tourist distribution and the key indicators that affect the tourist spatial–temporal distribution. Second, the imitation model and its related imitation results help to predict tourist spatial–temporal congestion. In cooperation with the tourist investigations, the results from the imitation will help to predict tourist satisfaction. The research team conducted participant observation, tourist interviews, and computational modeling research. The participant observation and tourist interviews took place in three periods. The first period was from August 15 to 20, 2011, during the summer holidays, when tourist congestion was slightly higher. The second period was from September 12 to 15, 2011, in the off season when tourist visitation numbers were normal. The third period was from October 1 to 5, 2012, during the national holiday, when tourist visitation numbers were extremely high. Key information was collected, and interviews were conducted to determine (a) when and where tourist congestion took place during the three different participant observation periods, (b) the most congested attractions in each period, and (c) the tourist responses to the extent of the congestion at each spot. To conduct the computational modeling research, a computer imitation model was built with the help of computational professionals in computer science.
To use the model, key factors affecting the tourist distribution were identified: (a) the type of routes offered, (b) the amounts of tourists distributed on each route, (c) the tourist duration time at each attraction, and (d) the distribution zones (district). To address these factors, the ATS imitation model was designed to measure the four indicators above.
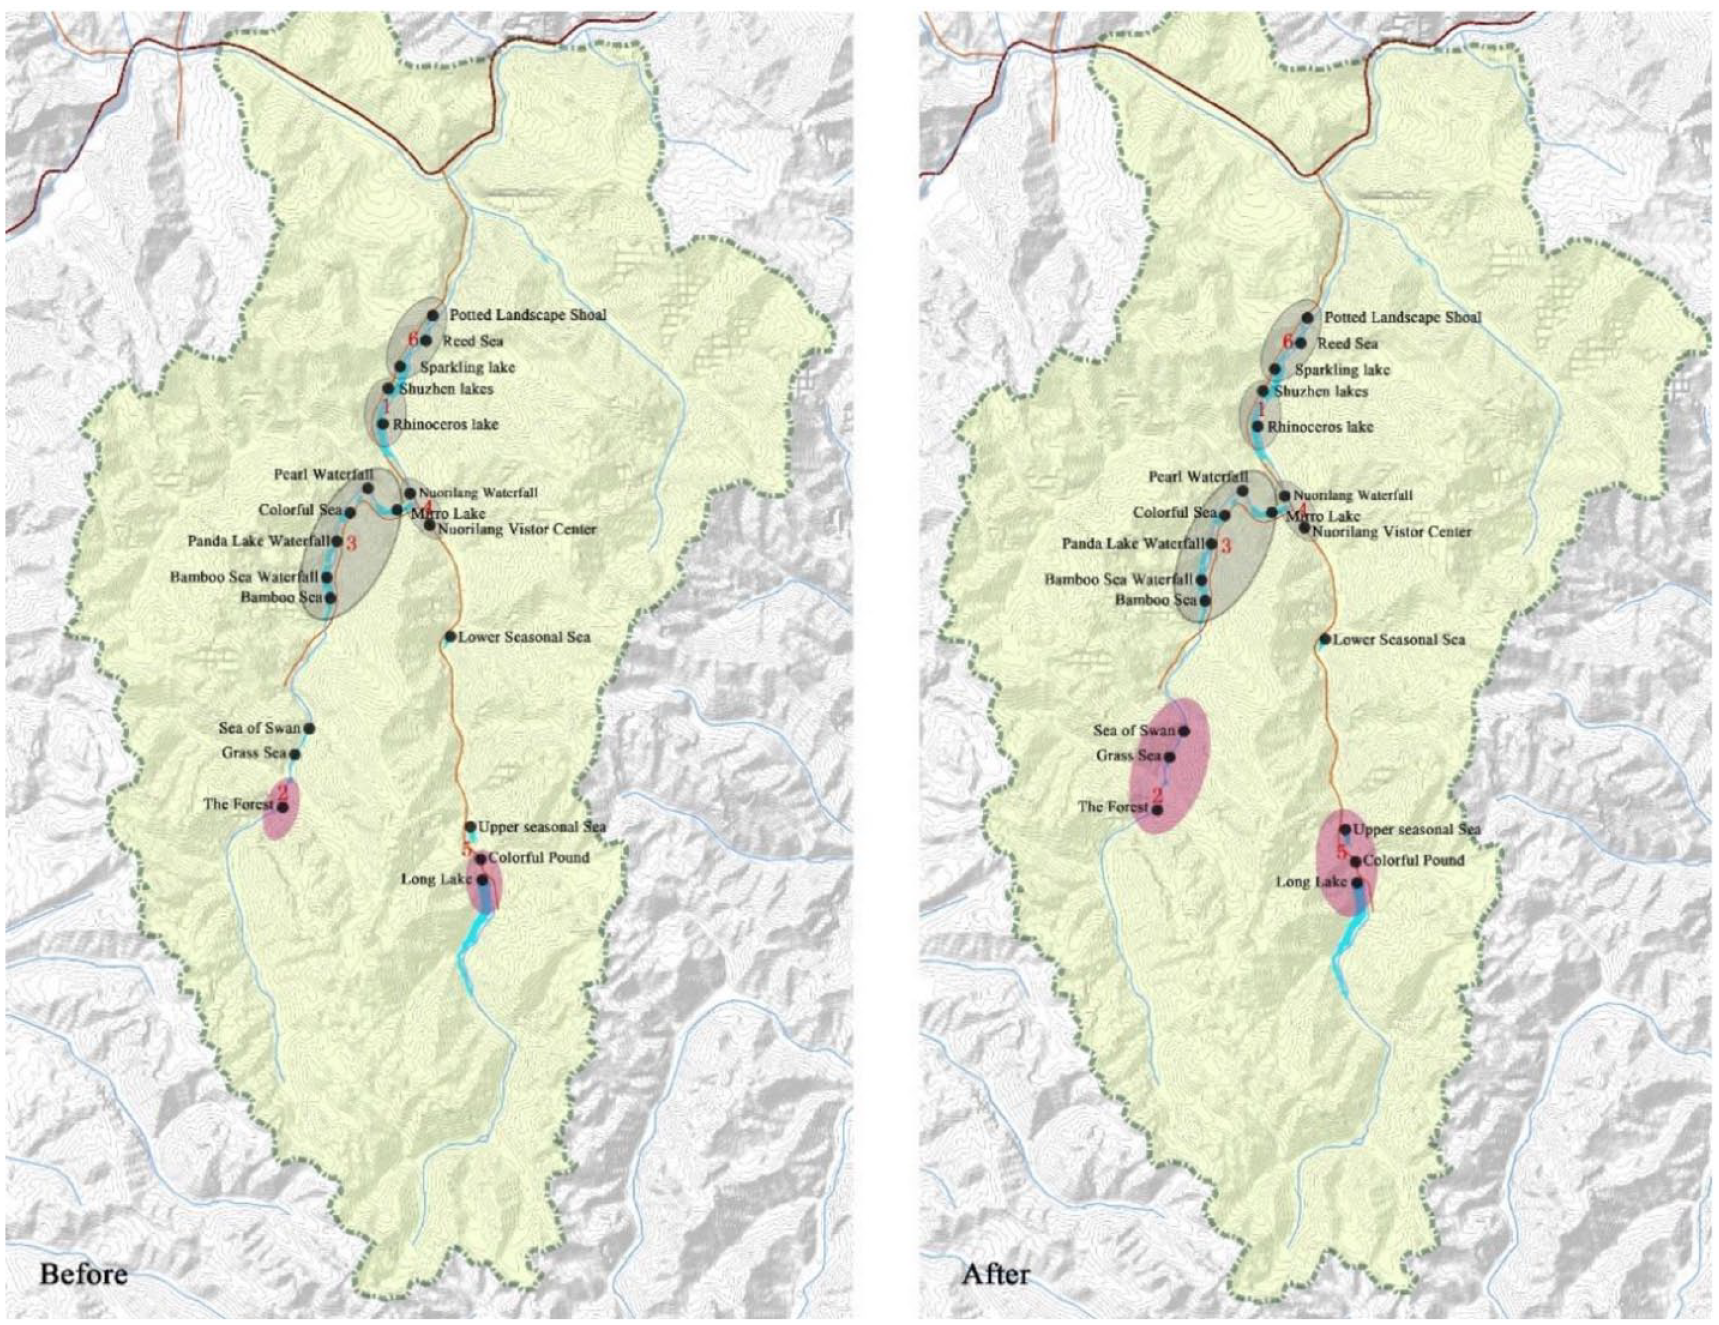
Tourist visitation numbers and the current ATS routes were provided by the park management committee. The current ATS distribution models in the JVWH consist of one three-zone model and one six-zone model. In both models, the zones represent the areas where the tourists are delivered. In the three-zone model, the districts are larger; these larger districts are broken down into smaller districts in the six-zone model. For instance, District 3 in the three-zone model is divided into Districts 2 and 3 in the six-zone model (Figure 4). Based on the six-zone partition, the JVWH administration developed the seven ATS distribution routes shown below. They are Route 1: 5-2-3-4-1, Route 2: 5-4-3-1, Route 3: 2-3-4-5-1, Route 4: 1-5-4-2-3, Route 5: 1-2-3-4-5; Route 6: 6-1-5-4-2-3, and Route 7: 6-1-4-2-3-5. There are two differences between each route: the order in which attractions are visited and the number of stops. The following is the explanation of the zone numbers (according to the six-zone distribution model) in the ATS routes. Number 1 corresponds to Zone 1, which contains the attractions from the Shuzheng Lakes to the Rhinoceros Sea. Number 2 corresponds to Zone 2, which contains the Forest area. Number 3 corresponds to Zone 3, which contains the attractions from Arrow Bamboo Lake to Mirror Lake. Number 4 corresponds to Zone 4, which contains the Nuorilang Restaurant and the Nuorilang Waterfall. Number 5 corresponds to Zone 5, which contains the attractions from the Long Sea to the Colorful Pound. Number 6 corresponds to Zone 6, which contains the attractions from the Sparkling Lake to the Potted Landscape Shoal.

Three- and six-zone tourist districts.
Research Analysis
Tourist experience is strongly related to the number of people occupying a given space. For instance, 10 people in a 10 m2 area will feel much more crowded than two people in the same area. Because people in different countries with different cultural and social backgrounds feel differently about personal space, an analysis of tourist satisfaction at JVWH makes it necessary to determine how much space the average Chinese citizen needs to feel comfortable. The Chinese National Code for Planning of Scenic Area (GB 50298-1999, 1999) designates that tourists are most comfortable when they have 5 m2 of space to themselves. Using this number, we calculated the tourist capacities of each spot according to the square calculation method (Formula 1) and trial calculation method (Formula 2). After calculating the tourist capacity of each spot, we calculated the instantaneous capacity of the whole national park. The results of these calculations are the suitable instantaneous capacities of each zone (Table 1). The suitable tourist capacity of the whole national park is 16,471 people.
Instantaneously Tourist Capacity in Each Zone.
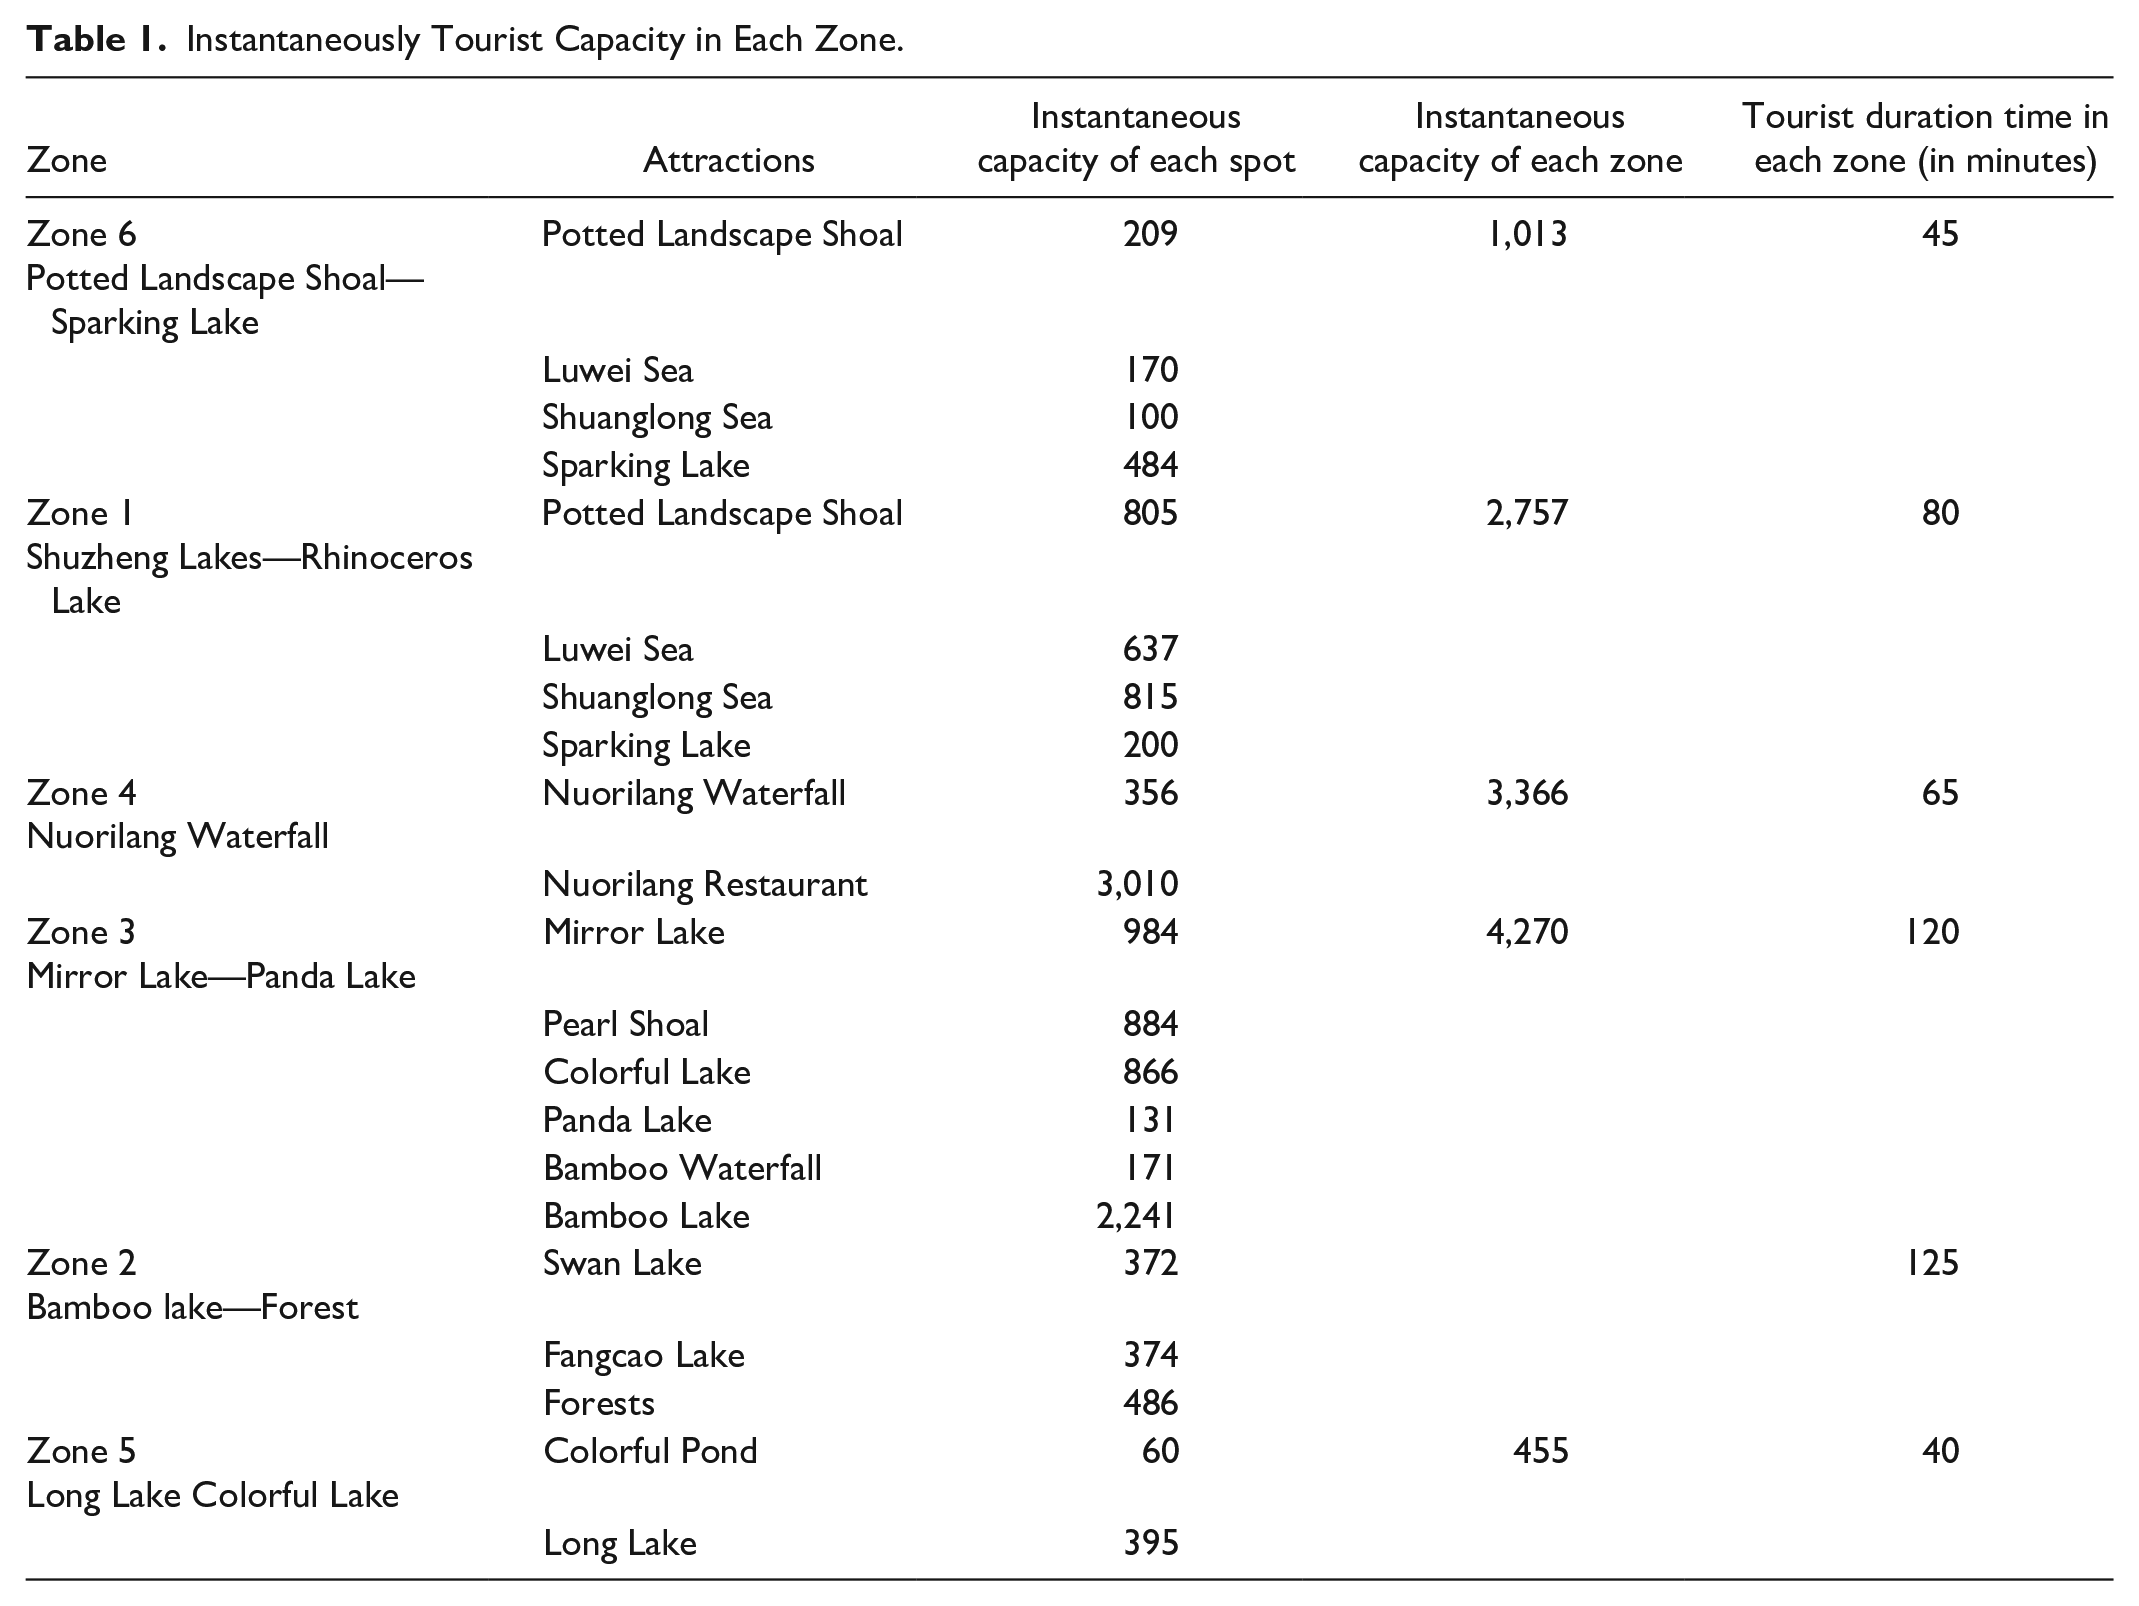

where Xi = the tourist areas in JVWH, Yi = m2/per tourist (based on the < Chinese National Code for planning of scenic area>), Zi = daily tourist turnover.

where C0 = L / L0, L = the length of tourist trail (m), L0 = length occupation per person; t0 = tourist duration time per trial, t = operating hours of all trails in JVWH.
To optimize the ATS tourist distribution model, researchers explore four different scenarios (listed in Table 2) to determine the ideal temporal–spatial distribution of each spot. The goal of the modeling imitation was to keep tourist numbers at each spot constantly close to but always smaller than the spot’s optimal tourist capacity. Working from the current ATS model, researchers altered one or two of the four variables in each of four different scenarios. The adjustments made in each scenario were based on those made in the previous scenario(s). This allowed them to compare the effects of altering different variables and to determine which variable or combination of variables should be altered to make the ATS at JVWH most efficient. The four variables altered are (a) amount of tourists distributed to each spot, (b) tourist routes, (c) combination of attractions in each route, (d) tour duration. During the ATS modeling imitation, one variable was adjusted in each scenario. In the following table, the scenarios for adjusting the ATS are detailed. The changed indicators are bolded in each scenario.
Four Scenarios Compared to Current ATS System.

Note. ATS = alternative transportation system.
After conducting multiple simulations, we pinpointed the most effective scenarios to address the problems related to temporal and spatial tourist distribution and congestion. The scenarios we worked on could be implemented without making too many changes to the ATS system and would not significantly increase JVWH’s management budget. The simulation conducted in this study proved that our modeling methods can effectively achieve the ideal tourist temporal–spatial distribution goals of JVWH, which the previous research on the subject has not been able to do.
Scenario 1: Alter the Tourist Distribution Numbers
Scenario 1 is based on the current six-zone ATS distribution. To satisfy the variety of tourist requirements, the ATS offers seven different routes. Some routes visit all stops, whereas others only visit half of them (see “Research Methods” section, third paragraph). This means the order and number of attractions tourists visit vary for each route. Currently, the way in which tourist are distributed among these routes leads to congestion in certain areas. For instance, in current ATS model, about 20% of the tourists (around 8,000 tourists) for each day are delivered to Zone 5 and Zone 2 from the park entrance between 7:30 and 8:30 a.m. This distribution causes severe tourist congestion in these two zones. To address congestion problems such as this, the numbers of tourists distributed to each spot was changed in Scenario 1.
To adjust the temporal–spatial distribution of tourists, the researcher extended the current morning distribution time by 2 hr. At current JVWH’s ATS distribution, the buses distribute tourist from 7:30 to 9:30 a.m. In the simulation for Scenario 1, the buses deliver tourists between 7:30 to 11:30 a.m. In addition to adjusting the delivery time, the researcher also distributed tourists more evenly among the routes (Figure 5). This adjustment ensures a more ideal temporal–spatial distribution by increasing the distribution hours and decreasing the amount of tourists delivered in each hour.

Scenario 1 current and modeling imitation and results (C = tourist capacity).
After multiple modeling simulations and tests, we pinpointed the instantaneous visitation in all zones and found that the number of tourists still exceeded the zones’ optimum capacities. Hence, the researchers draw the conclusion that, though altering the number of tourists distributed to each spot may help to some degree, the peak instantaneous tourist numbers at each spot still surpass their optimum capacities. Therefore, we cannot solely adjust the number of tourists distributed to each spot.
Scenario 2: Alter the Distribution Routes and Times
Based on the results of Scenario 1, the number of attractions visited and the tourist routes were changed in Scenario 2 (Table 3). In the current ATS system, not all tourists stop at every spot. In Scenario 2, tourists are encouraged to visit all attractions of JVWH. In addition, a number of steps were taken to change the tourist routes. First, the researchers added more attractions to some of the existing routes. For instance, we added Zone 6 and Zone 2 and their attractions to Route 2. Then, we added Zone 6 to Route 1 and Route 6. In addition to adding more attractions to the existing routes, an entirely new route was added to the existing ATS. Just as in Scenario 1, the tourist distribution hours extended from 7:30 to 11:30 a.m., and the amount of tourists was more evenly distributed in each hour. In the ATS model for Scenario 2, each of the numbers stands for a particular combination of attractions. Number 1 represents attractions from the Shuzheng lakes to the Rhinoceros sea. Number 2 represents the Forest; Number 3 represents attractions from the Arrow Bamboo Lake to the Mirror Lake. Number 4 represents the Nuorilang Restaurant and the Nuorilang Waterfall. Number 5 represents attractions from the Long Sea to the Colorful Pound. Number 6 represents the Sparkling lake to the potted landscape shoal. Through multiple simulations, the researcher discovered that with the changes made in Scenario 2 only Zone 2 and Zone 5’s instantaneous visitation were overloaded. The remaining zones met their proper tourist capacity.
Tourist Routes Altered.
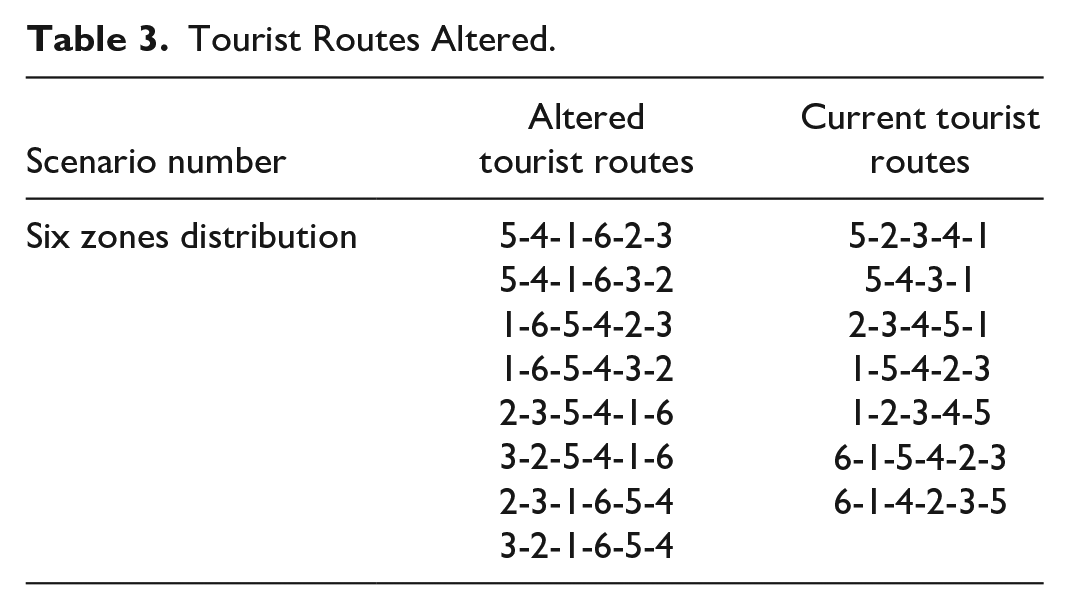
From the imitations performed in Scenarios 1 and 2, we can safely draw the conclusion that stretching the distribution time, changing the number of tourists distributed to each spot, and changing the number of attractions visited could effectively reduce the tourist temporal–spatial distribution imbalance of JVWH.
Scenario 3: Alter the Combination of Attractions
From the simulations of Scenario 2, we found that adjusting the tourist distribution times and routes could decrease the instantaneous tourist capacity of each zone, but could not completely solve the capacity limitations of Zone 2 and Zone 5. After multiple simulations, we found the instantaneous tourist numbers at Zone 5 and Zone 2 indicated that these zones were most heavily overloaded regardless of the methods we used. Therefore, it is necessary to enlarge the tourist capacity of Zone 5 and Zone 2. This could be achieved by adding more attractions and trails to both zones, enlarging their tourist areas, and extending their trail lengths. This way, people touring these two zones would be encouraged to hike more trails than in other zones. To enlarge the tourist capacity of these two zones, the researcher incorporated the Upper Seasonal Lake into Zone 5, and added the Swan Lake to Zone 2 (Table 4, Figure 6). Consequently, the hiking areas of these two zones were expanded and their spatial capacities were increased.
Spot Combination.

Changes in attractions combination.
In Scenario 3, the tourist duration time was also changed by adjusting the location of certain bus stations. Changing the locations of these bus stations forces, tourists to hike more trails than before and leads tourists to spend more time in certain areas of the park. For example, the researcher added the Upper Seasonal Lake to Zone 5 so that tourists would get off the shuttle buses at the Upper Seasonal Lake station and hike the trail from the Upper Seasonal Lake to the Long Lake. When they finish the tour of Zone 5, they get on the next shuttle bus at the Long Lake station. In this scenario, the tourist duration time is extended because people are encouraged to hike throughout the whole zone instead of just stopping at a few attractions. This way the occupancy pressure to the Long Lake can be relieved.
In addition to the aforementioned changes made in Scenario 3, we employed the same tourist distribution methods as in Scenario 2 which combined various attractions. After multiple simulations, we finally reduced the tourist numbers at each spot to satisfy its proper capacity. For the peak day imitation, almost all the attractions’ instantaneous capacities were under the optimum capacity except Zone 6 (attractions from the Sparkling Lake to the Potted Landscape Shoal; Figure 7). After this simulation, the temporal–spatial tourist distribution became more reasonable which indicates that altering spot combination is a positive method for adjusting the tourist temporal–spatial distribution.

Scenario 3 instantaneous visitation imitation results.
Scenario 4: Alter the Tour Duration
JVWH is a popular national park in China, and millions of tourists all over the world flood it every year. During extreme peak days, tourist visitation numbers reach 40,000. Accommodating this number of tourists is a huge challenge to the ATS system and other tourist services. During the extreme peak days, crowding even jeopardizes tourists’ safety. To handle the extreme peak days safely and efficiently, Scenario 4 divides a whole tour day into two half tour days. Based on Scenario 3, with its successful alteration of spot combinations, this model redistributes half of tourists’ visitation times across 2 days, and leaves other tourists’ visitation times unaltered. In this scenario, the research reveals two methods to disperse tourist duration time across two half days. One method requires that topological landscape attractions be combined, and the other method requires that tourists be divided into a single-day tour groups and a cross-day tour groups.
In the first method, the researcher designated new tourist routes and attractions according to the landscape typologies of the park. This method is intended to reduce the tourist duration time of the national park while maintaining a high level of tourist satisfaction and ensuring that tourists are exposed to the great variety of natural features JVWH has to offer. JVWH can be divided into many different landscape categories: lake, pond, waterfall, forest, cave, and beach stream. To reorganize the 1 day tour into 2 half-day tours without negatively affecting tourist experience, we selected unique features from each route and formed entirely new routes. Researchers condensed the original seven routes into six half-day routes, and shortened the route length and tourist duration time by decreasing the repeated landscape features on each route. For instance, the original Route 1, which allows tourist to encounter all the landscape features and all the attractions of JVWH, takes at least 6 hr to complete. But, in the new Route 1 developed in Scenario 4, tourists experience three landscape types and visit five attractions of JVWH instead. Their tour time is reduced to 3½ hr. The researcher chose different landscape topologies from each route to create six new half-day tour routes (Table 5, Figure 8) and provided shuttle bus interpretation programs for each route future more.
New Tourist Routes in Scenario IV.


Tourist routes with different combinations of landscape types.
In the second method, researchers assigned tourists to two different types of tours (a single 1-day tour or a pair of 2-day tours) to balance the temporal–spatial distribution of tourists during extreme peak days. In the scenario, tourists assigned to the pair of half-day tours are taken on their first half-day tour in the afternoon of Day 1 (1:30–4:30 p.m.) and their second in the morning of Day 2 (8:30–11:30 a.m.). The scenario applies to 18,000 of the tourists visiting JVWH on an extreme peak day: 6,000 tourists are assigned to the 1-day tour, and 12,000 tourists are assigned to the pair of half-day tours. Tourists are distributed averagely among all routes (Table 6).
Tourist Duration and Routes.

After multiple simulations, we obtained an appropriate spatial–temporal model for each of the two methods employed (Figure 8). As is shown in Figure 9, only the instantaneous capacity of Zone 6 (which reaches from Long Lake to Upper Seasonal Sea) exceeded its ideal capacity. Hence, we conclude that designating half-day tour routes is an effect method, which can reduce the tourist duration time in JVWH. To encourage tourists to participate in the half-day tours, we propose to discount their park ticket. Although this strategy is sound, it also has certain weaknesses. Because tourists who take the half-day tours will not experience all of the park’s features, they may be less satisfied. This strategy may also put additional pressure on tourism management as it requires them to provide more information of hotels and restaurants for the two half-day tourist group to maintain JVWH’s high standards of service. Due to these weaknesses, it may be difficult for JVWH to implement Scenario 4 in the short term.

Tourist amount-service capacity graph after tour duration alteration.
Conclusion and Discussion
Based on the computational modeling methods, this research provides the solutions of how to adjust the tourist spatial–temporal imbalance by applying the computational models. Four different scenarios were applied and analyzed with a model used to imitate the park’s current ATS. In Scenario 1, the tourist duration time and the number of tourists distributed to each spot were adjusted. In Scenario 2, the sequences and numbers of the tourist routes were altered. In Scenario 3, the combination of attractions in some districts was changed. In Scenario 4, the tourist duration time in the national park was redistributed. The adjustments made in each scenario were based on those made in the previous scenario(s). After multiple simulations, the researchers concluded that only altering the numbers of tourists distributed to each spot (as in Scenario 1) could not solve the spatial–temporal imbalances in each zone. While altering the route sequences and the combination of attractions in Scenario 2 balanced the spatial–temporal distribution of four of the zones, it did not remedy the imbalances in Zones 2 and 5. Applying Scenarios 3 and 4, which involved altering the combinations of the attractions and the tourist duration times, was the most effective in decreasing each zone’s instantaneous capacity. When applied together, these scenarios achieved a more reasonable tourist spatial–temporal distribution.
Most research focused on the theoretical models of spatial–temporal adjusted, do not address the special resources and spatial patterns of the sites; thus, the significance of their theoretical applications is limited. Although a large number of studies predict the size and spatial and temporal distribution of tourists through mathematical model predictions and visitor behavior research, they are not directly linked to planning and management. Thus, they can rarely be used directly by management. Besides, a large number of researches based on FRID technology have been taken on to discuss the model for optimizing the spatiotemporal distribution of tourists. However, as it requires a lot of hardware equipment and funds, this technology has been gradually phased out in the protected lands, and more convenient two-dimensional code identification technology has been adopted. Thus, the research on the spatial–temporal distribution of heritage sites will be ultimately facing toward the actionable regulations, whereas this research has built a bridge between theoretical models and practices.
By analyzing the effectiveness of the four scenarios discussed above, the researchers have determined which approaches can be employed most effectively to adjust the current ATS. As such, this research contributes to the body of work focused on addressing the issues of crowding and transportation in the JVWH. Even more importantly, it suggests approaches to tourism management that might be implemented successfully in other parks in China.
The study was approved at an expert review meeting in November 2015 and was commissioned for planning and implementation. Through the planning, implementation, and postplanning assessment, the Jiuzhaigou administration adopted the research proposal and adjusted the original second and fifth zone attractions. According to the research proposal, the Forest area attraction in the previous second zone was changed to the Forest-Sea of Swan, and the Long Lake-Colorful Pond attraction from the previous fifth zone was changed to the Long Lake-Upper Seasonal Sea. The space capacity of the original plan was expanded. In the specific implementation, by guiding tourists to walk in the second and fifth zones, the walking time was extended, and the congestion of tourists at the attractions was decreased. Based on the outcomes of the implementation, the simulation effectiveness of Scenario 3 is thus proven.
For seasonal imbalances, research also proposed solutions. The JVWH is flooded with tourists during the peak season (from June to August) but lacks visitors during the off season (from November to January). To solve the seasonal imbalance, the researchers suggest that the JVWH offer discount tickets during the off season. It is recommended that park and shuttle tickets be sold at half price (which would save tourists $30.00 a day) during this time and that a special tour guide be provided in certain popular attractions.
Although this study provides many valuable findings, it does have some limitations. First, it employs a theoretical method to solve a practical problem. The successful adjustment methods shown in this research should be adjusted for application in the field. The probabilities and feasibilities of the suggested strategies should be examined in future research. Second, the tourist data provided by the park managers were limited to tourists at the park entrance and did not take into account those in other areas of the park. For future research, tourist data from other areas of the park should be collected and used to reanalyze the findings presented herein. Hence, researchers will pinpoint the attractions that are crucial for further analyses of tourist distribution, and adjusted strategies for addressing imbalances will be provided in the future.
Footnotes
Acknowledgements
The authors are grateful to the administration of Jiuzhaigou Valley National Park, for their field observation support. The authors are also grateful to Mr. Dong of computer science in Tsinghua University, for his technical support.
Declaration of Conflicting Interests
The author(s) declared no potential conflicts of interest with respect to the research, authorship, and/or publication of this article.
Funding
The author(s) disclosed receipt of the following financial support for the research, authorship, and/or publication of this article: This research is supported by the National Science Foundation for Young Scholars of China (Grant No.51808394) and Shanghai Pujiang Program (18PJC113).