
Abstract
Due to the increasing importance of human capital for economic growth, this article aims to clarify the relationship between economic growth and human capital by concentrating on the growth effects of an average number of brands in the economy. An endogenous growth model where branding emerges as the “growth engine” of the economy is followed by a quantitative analysis regarding the relationship between brands and economic growth. The findings suggest that developing countries should shift from traditional mass production to high value-added production, such as brand development, to achieve a similar economic performance in developed countries.
Introduction
Growth has always been a major motivation for both companies and national economies all around the world. In the industrial period, driving forces behind the economic growth were primarily physical resources, whereas in the 21st century, the importance of these resources has decreased leading to a shift from tangible and physical resources to intangible and intellectual resources in both microeconomic and macroeconomic levels.
The importance of intangible capital was recognized in “Lisbon process” (European Commission, 2010) and has been acknowledged for sustainable, smart, and inclusive growth by the European 2020 strategy. An analysis by World Bank Group with regard to the total wealth of countries states that 78% 1 of the world’s wealth is created by intangible capital. Although there is a consensus on the rising importance of intangible capital for economic growth, there is still an ongoing debate on the methodology for measuring the degree, timing, and duration of the relation between intangible capital and the economic growth. On one hand, some studies 2 find intangible or intellectual capital as an important economic driver and indicate the positive effect of intangible capital on economic growth in different countries. 3 On the other hand, some studies, 4 still argue that there is a lack of support to prove the economic effects of intangible capital. These contradictory findings point out a necessity for more research on the relation between economic growth and intangible capital using alternative methodologies and metrics. Hence, in this article, we aim to shed light on this relationship by concentrating on the growth effects of an average number of brands in the economy.
According to the Organization for Economic Co-Operation and Development report (OECD, 2011), intangible assets, knowledge asset, and intellectual capital terms can be used interchangeably, and the content of intangible assets gets broader, ranging from computerized information (i.e., databases and software), economic competencies, such as human capital, brand equity, and know-how to innovative property including trademarks, R&D, and copyrights. Following this, the current study uses branding as a form of human capital so that the analysis regarding the effects of branding on economic growth can be conducted. In doing so, the theoretical framework introduces branding to the Uzawa-Lucas–type growth model as the additional sector, contributing to manufacturing (i.e., goods production) as an input. Intuitively, for brands to appear, first, there has to be a standard goods production. This, in turn, will transform the economy into a certain development level allowing for the allocation of educated agents and more time to sectors other than goods production (i.e., branding). Once this additional sector of human capital is established and grows, it further affects the output growth by positively influencing the average branding in the economy in the form of a positive externality. For a positive externality to exist, the production is required to generate spill-over benefits to the economy. In this sense, this article argues that branding with high-quality differentiated products that are produced by well-educated, creative know-how contributes to the overall economic growth.
From the quantitative perspective, our aim is, first, to justify the formation of human capital as brands. The positive correlation coefficient of human capital index (HCI) and the number of brands supports the argument that brand development is a factor input of the goods production firms. Then, the effect of valuable brand development on GDP per capita is analyzed highlighting the strength of the relationship. The positive correlation on this relation is demonstrated in all categorizations in terms of countries. Considering that there are only eight emerging market economies, 4 almost all having only one brand, in the Brand Finance Global 500 List, the positive linear co-movement in this relation suggests that the commitment to an increased brand development process for the emerging markets is vital for achieving greater economic performance.
The remainder of the article is organized as follows. Next section introduces the endogenous growth model where branding emerges as the “growth engine” of the economy. It is followed by a quantitative analysis section. Finally, the last section concludes with a policy recommendation.
Theoretical Model
Anholt (2005) points out that brands are the sum of intangible competitive assets of countries or organizations which resemble the distinctive character of the promises. Intangible resources, that is, human capital, include assets that create values contributing to and sustaining economic growth. In this respect, Uzawa-Lucas–type growth model is extended to embody branding as a form of human capital so that the analysis regarding the effects of branding on economic growth can be conducted. The agents have to choose how to allocate their human capital between two production sectors due to the rivalry property of the human capital. In goods production sector, there is one good used for consumption and physical capital investment; and brands are created in brand sector. While production sector uses brands and physical capital as inputs, brand development does not rely on physical capital. This assumption, other than simplification, is made to emphasize the intensity of the human capital input, which refers to a skill level of individual acquired via formal education, learning by doing and know-how, in the brand sector. 5
A representative firm in the goods production sector produces according to
The remaining non-leisure time,
The physical capital accumulation equation is given by


Since the benevolent social planner internalizes the effects from the average branding (i.e., takes into account the externality related with branding),

where


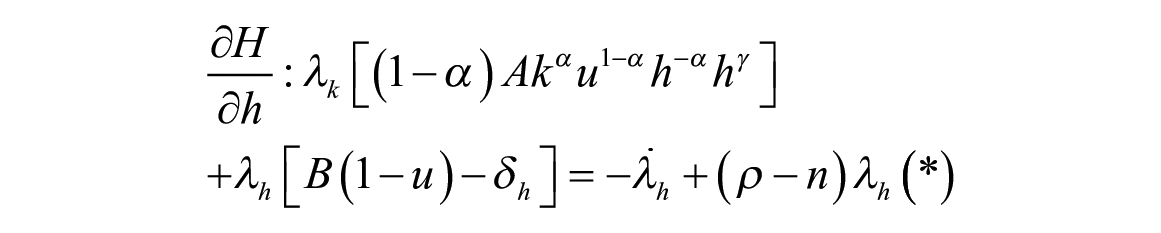

First two equations are first-order conditions with respect to control variables, whereas the first-order conditions with respect to


Finally, the necessary transversality conditions ensure that over-accumulation of assets cannot occur:


To find the output growth in terms of parameter values, a balanced growth path analysis is required. By utilizing logarithmic differentiation with respect to time (i.e., calculating growth) and combining the resulting equations, balanced growth expressions can be attained. Starting from equation (1) and combining the logarithmic time differentiation of it with equation (3), one would get

where growth of consumption
Suppose that ratio of shadow prices (i.e., equation (2)) is denoted by

Taking logarithm, differentiating with respect to time and combining the fact that constant

Notice that by applying the same approach, equation (2) gives
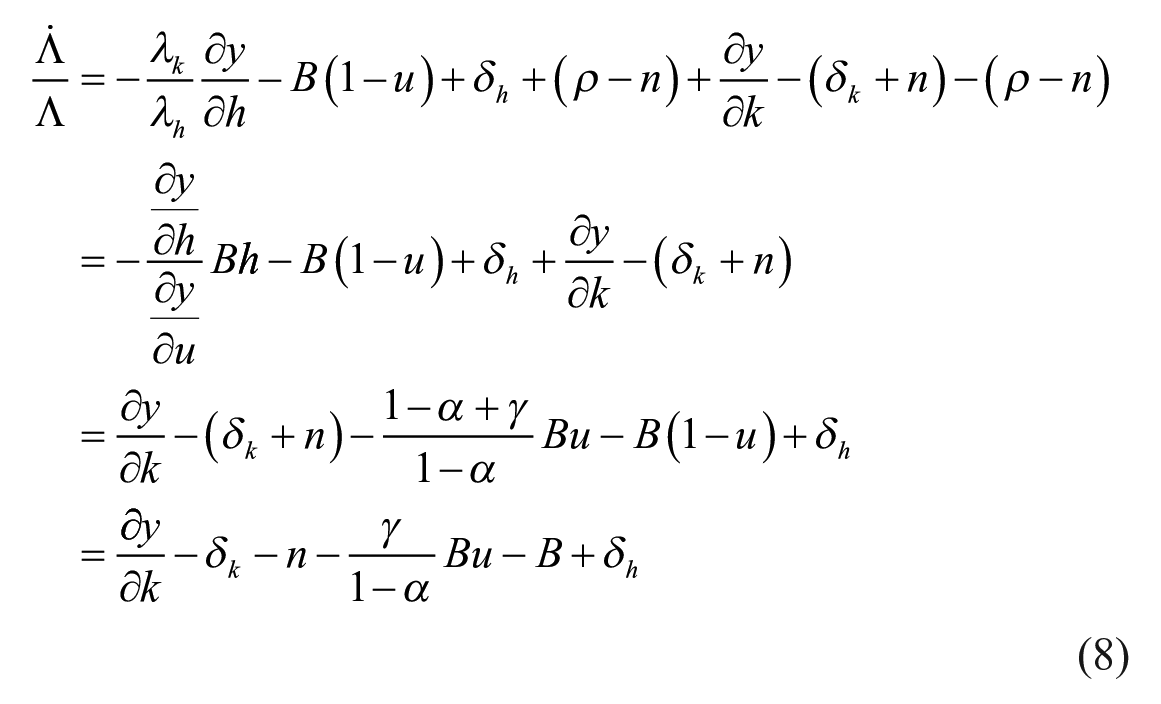
Since the right-hand sides of equations (7) and (8) have to be the same:

Law of motion for physical capital can be transformed into
Growth rate of number of brands can be found from
Using the production function, growth rate of output implies that

which can be expressed as

Finally, by combining equations (10) and (11), the equation for growth of output can be expressed as

Note that the parameters
In order to evaluate the effect of average number of brands, that is, external effect, on per capita growth rate, one would take the derivative with respect to productivity externality from average human capital in the economy, that is,

implying that, with positive net productivity, per capita output growth is an increasing function of the average number of brands in the economy. Intuitively, devoting more time to brand creation decreases the time that is left for producing output, indicating a negative impact on the goods production. However, that allocation augments brand development more intensively, which raises the average number of brands in the economy, translating into a positive indirect effect on the output. In other words, effectiveness in branding influences the output growth by positively affecting the average number of brands in the economy in the form of a positive externality. It is important to keep in mind that branding, patent laws, and trademarking emerged as a shift from simple products to quality products in an attempt of firms to differentiate their production from the production of competitors. As a result, this article argues that high-quality differentiated products that are produced by well-educated, creative know-how (i.e., valuable and effective brands) contribute to overall economic growth.
Quantitative Analysis
This section presents the quantitative analysis regarding the relationship between brand and economic growth. As stated in the theoretical model, branding is the “growth engine” of the economy, which is used as a form of human capital. Hence, the aim of this section is twofold. First, we want to discuss the strength of our assumption on the approximation of brand as human capital. Second, it attempts to explore the effect of branding on gross domestic product (GDP) per capita quantitatively in an attempt to support our theoretical results.
Since the World Bank data on HCI indicate the level of the knowledge, skills, and health that people accumulate throughout their lives, enabling them to realize their potential as productive members of the countries, we first check the correlation between the number of brands and HCI. The data on the world’s 500 most valuable brands across all sectors and countries are retrieved from the Brand Finance Global 500 report for 2017. HCI is gathered from the World Bank data and is only available for 2016 and 2018. It is an index ranging between 0 and 1, where a value of 0.5 shows that a child born today in that country will be half as productive as a future worker compared to its complete education and full health version. In 2018, the world average for HCI is 0.57, while it is close to 0.80 and 0.30 in developed and emerging markets, respectively. Finally, the annual data on the number of researchers in R&D per million people, GDP per capita and government expenditure per student for secondary education percentage of GDP per capita are also obtained from the World Bank covering years 2012 to 2018.
A simple comparison of HCI for developed and emerging markets gives rise to the argument that the emerging markets should invest in people through nutrition, health care, quality education, jobs, and skills to recover from poverty and to achieve the development level that the high-income countries have. As the theoretical model suggests, investing in people, in return, creates brands over the years, leading to a higher growth through the development process. Hence, for the legitimacy of our assumption, we check the correlation between HCI and brand for 18 countries. 7 According to the left panel of Figure 1, as the trend line indicates, there is a positive relation between the number of 18 countries’ brands in top 500 brands list and their HCI for 2018.
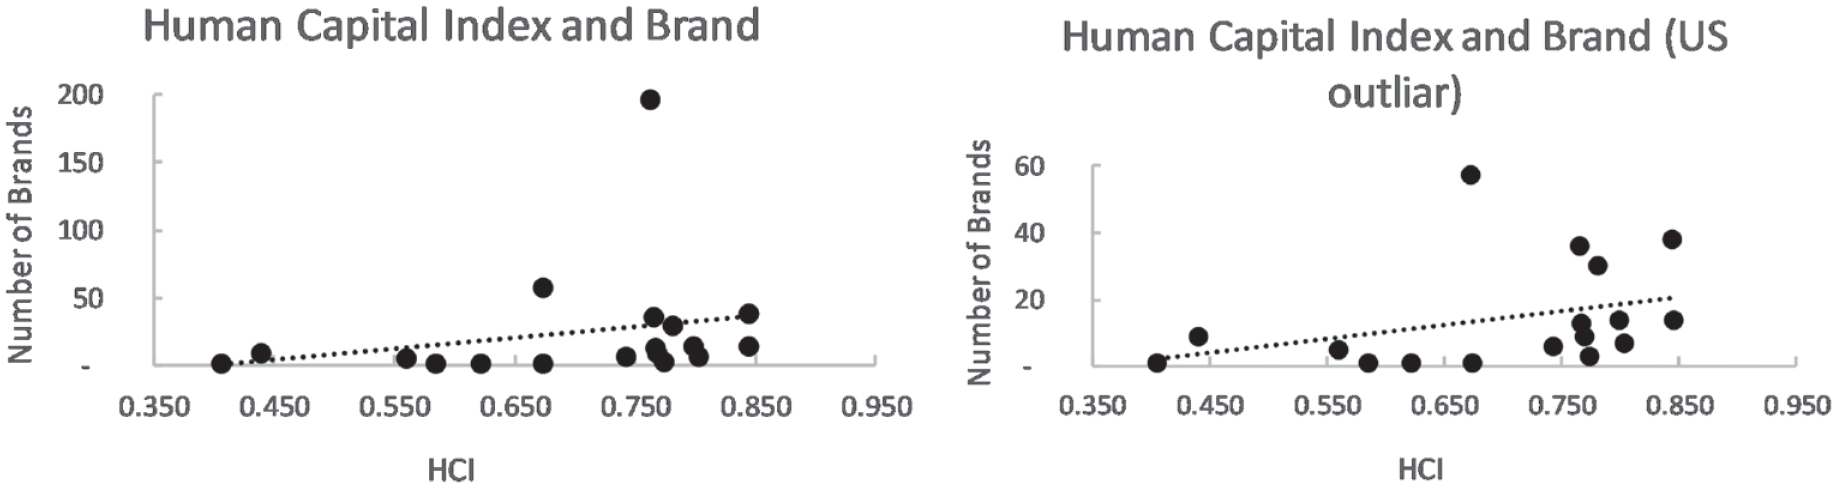
Scatter plot of Human Capital Index and the number of brands in top 500 list with trend line.
When we assume the United States as an outlier, due to the extensive number of United States brands on the list and repeat the same analysis, the positive correlation between HCI and brand gets stronger by 52% as in the right panel of Figure 1. A closer correlation coefficient value to 1 after the omission of the United States indicates that the USA can be considered as an influential point. 8
Benhabib and Spiegel (1994) argue that an approach in measuring human capital may be the average years of schooling of the labor force since the educated labor force is believed to be better in creating, implementing, and adopting new technologies. Given this insight, we use the number of researchers per million instead of HCI for a robustness check. Figure 2 illustrates the positive correlation of 0.55 between the number of researchers per million in countries with the number of brands. 9
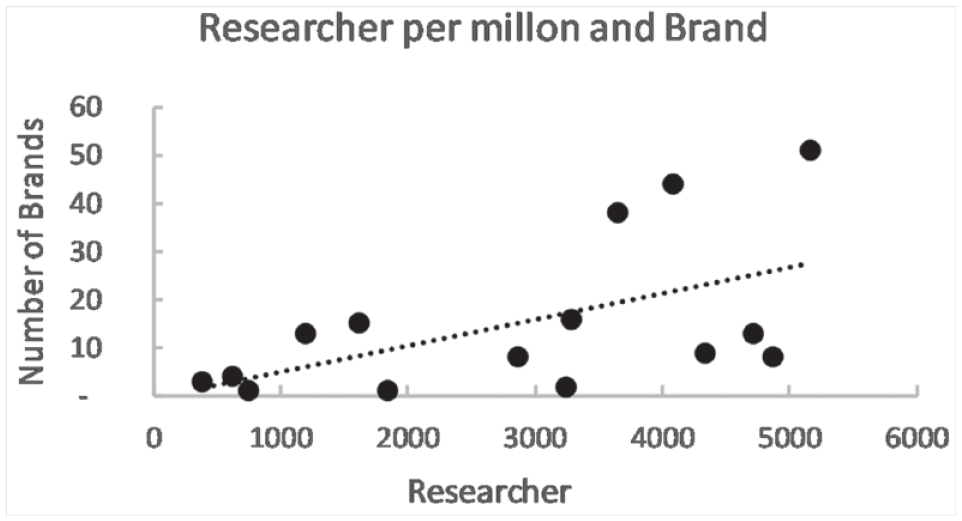
Scatter plot of the number of researcher in R&D per million and of brands in top 500 list with trend line.
With the following graph, we attempt to visualize how powerful the number of researchers per million and government expenditure per student affect brand development through time. We correlate the number of researchers per million and government expenditure per student in previous years with brands in 2017. Acknowledging that the human capital investments’ resulting in the development of valuable brands requires time, the purpose of this analysis is to gauge the time needed for this investment to turn into the strongest impact on the number of brands created. In Figure 3, the correlation of the interest variables with brands is on the vertical axis; and there is time on the horizontal axis. The correlation shows that there is a positive relation between investing in researchers (i.e., rise in the number of researchers per million) and in education with brand development. While government spending has an increasing positive effect on having valuable brands with an immediate relation, the number of researchers loses the strength of its impact on brands through time, although there is an immediate relation between the two. Thus, our findings support that to observe the strongest impact of government spending per student on brand development, approximately 3 years need to pass. 10

Time response effects of the instruments to the number of brands in top 500 list.
The analysis with respect to the relationship between branding and economic growth requires rigorous consideration because of the nature of their relationship. The findings of our previous study (Ökten et al., 2019) suggest that the relationship between branding and economic activity is time horizon dependent. Specifically, the results of the panel data analysis argue that the effect of brands on gross national product (GNP) is positive in the long run. The same analysis, however, finds that branding negatively affects GNP in the short run. The negative relationship in the short run can be attributed to the allocation of limited resources. Since creating brands takes time, GNP is affected negatively in the short run, namely throughout the birth period of the brand. As suggested in the theoretical model, allocating more time to brand development decreases the time left for producing output, indicating a negative effect on the production of goods. On the contrary, this allocation of time to brand creation augments human capital more intensively, which can be considered as providing a road map for the late-comers to the industry, learning-by-doing, know-how, getting more skillful in the development and design processes of a brand, and so on. As a result of this process, the average human capital in the economy (i.e., average number of brands of that country) rises, which translates into a positive indirect effect on the output. This intuition refers to the positive relation between brands and GNP that we detected in the long run in our previous study; and supports the general perception that the return on investment from education, human capital, and R&D take a long period of time. Brand development is also such an investment, and it takes time to observe its positive impact on GNP. 11
Since we have established the time-dependent relation of brand development to economic growth using a panel data regression analysis in an earlier study, we aim to provide further evidence to our current hypothesis in this article. Hence, we illustrate the degree to which branding and economic activity move in relation to one another. Top panel of Figure 4 demonstrates the parallel movements in brands and GDP per capita for the whole list of countries while the bottom panel repeats the same exercise by categorizing the countries as developed and emerging markets.

Scatter plot of GDP per capita and the number of brands in top 500 list with trend line.
In all cases, there is a positive co-movement in brands and GDP per capita. While the whole sample correlation is 0.16, its developed and emerging market economy counterparts are 0.07 and 0.24, respectively. A higher correlation between brands and GDP per capita in emerging markets, compared to the developed countries, is the actualization of the convergence in development economics. It is important to stress that there are only eight emerging markets in the analysis where each has one brand, except China, which leads to the idea that commitment to the improvement of this relation between brands and GDP per capita in emerging markets is vital for the growth of these countries. 12
Conclusion
An endogenous growth model in a continuous time with branding used as an intangible capital input for goods production is constructed to study the long-run impact of brand development on economic growth. In the theoretical model, branding emerges as the “growth engine” of the economy because of its positive externality. More specifically, productivity contribution from the average number of brands in the economy boosts the per capita output growth.
In an attempt to verify the hypothesis brought by the theoretical model, a quantitative analysis is utilized. First, the approximation of branding as human capital is justified. To verify this, the strength of the linear relationship between investment in students and in researchers (which are considered HCI), is checked against branding. It indicates a stronger positive co-movement as time passes. Then, the effect of valuable brand development on GDP per capita is analyzed highlighting the strength of the relationship. The positive correlation on this relation is demonstrated in all categorizations in terms of countries. By comparing the correlation between the number of brands in the top 500 list and GDP per capita of emerging markets and that of developed countries, this article concludes that there is a positive, yet, poor relation between these variables in emerging markets. These findings can be interpreted as follows: There is more room for improvement for human capital and related investment in emerging markets. Hence, this study exerts the importance of the way human capital is managed results in a greater development level and growth for the emerging markets.
The main contribution of this article is in terms of a policy recommendation for developing countries and emerging markets. While China, as an emerging markets economy, was in this list with 13 brands in 2008, it raised this number to 57 in 2017. Throughout this period, China has increased its investment in branding and technology, encapsulated as human capital investment, owing to its new growth strategy. As a result of this strategy, China has achieved not only a great economic growth rate but also accelerated its development. As Anholt suggests, the developing countries would benefit from powerful branding strategies, which could help them utilize the intangible assets in a productive and harmonized way. Similarly, this study proposes that emerging markets should shift from a traditional mass production to a production with high value added, like creating brands, by investing in their human capital in an attempt to increase their economic performance, which, in return, will help them catch up with the developed countries.
Footnotes
Appendix
List of Countries for Variables.

| Australia abd | France abcd | Japan abcd | Sweden d |
| Brazil abce | Germany d | Republic of Korea abd | Switzerland abcd |
| Canada abd | Hungary b | Malaysia ae | Thailand e |
| Chile acd | Ireland b | Netherlands d | Turkey be |
| China abe | India ace | South Africa abe | United Kingdom acd |
| Colombia e | Indonesia e | Spain abcd | United States a |
| Denmark acd | Italy abcd | Saudi Arabia ad |
Human Capital Index versus brand; b Researcher versus brand; c Government spending versus brand; d Developed countries; e Emerging Markets.
Countries are categorized depending on in which figures their data are used.
Author Note
The author Nuriye Zeynep Ökten is now affiliated to Nişantaşı University, Istanbul, Turkey.
Declaration of Conflicting Interests
The author(s) declared no potential conflicts of interest with respect to the research, authorship, and/or publication of this article.
Funding
The author(s) received no financial support for the research, authorship, and/or publication of this article.