
Abstract
One of the most common procedures in service transport is to adjust the service location information of the passengers or the bus stops. Service companies assign a staff to update service information. These staff prepare lists of passengers and give them to service drivers. In this study, a model is proposed to facilitate the process of updating the service. With the smartphone application, a platform has been prepared in which passengers can automatically update their service information by selecting one of the three closest stops offered to them before the service hour. After development and implementation, its user acceptance is tested and validated via the unified theory of acceptance and use of technology (UTAUT) model and structural equation modeling. The main purpose of this study is to determine the acceptance and use of the mobile passenger application by the passengers. In this context, the moderator effect of the frequency of mobile use of passengers, education levels, genders, and ages on the performance expectancy, effort expectancy, facilitating condition, behavioral intention, and use behavior of passenger mobile applications was examined. As a result of the research, it was found out that the frequency of mobile usage has a moderator effect on both the effect of facilitation conditions on the actual use and the effect of behavioral intention on actual use. And also, it appears that the education level has a moderator effect on the effect of facilitating conditions on the actual use, and gender has a moderator effect on the effect of behavioral intention on the actual use. The proposed decision support system reduces the workload of service companies and facilitates the process, which is normally long and painful. Thus, customer satisfaction also increases. Hence, position and stop information between the service firm, passengers, and the drivers is easily and instantly shared.
Keywords
Introduction and Literature Review
Many employees use shuttle buses to be transported from their homes to corporate campuses nowadays. Companies can provide this service via their own shuttle buses, but companies usually prefer to outsource this service to the other specialized companies such as shuttle bus companies. During the transportation of employees, lots of data and information need to be shared between passenger, workplace, shuttle bus company, and shuttle bus driver. These data need to be shared quickly and correctly to be able to overcome daily problems and organizational impediments.
Nowadays, the increased internet access provoked the rapid development and growth of web-based technologies such as vehicle tracking systems (VTS). Global positioning system (GPS) becomes also highly widespread. A lot of mobile applications, which use GPS, are developed and become widespread. The locations of vehicles are obtained with the help of VTS utilized by GPS. Moreover, thanks to that, transportation to planned destinations is done in the quickest, easiest, safest, and most economical ways. However, in the closed areas, the calculations for location cannot be executed due to weakness and loss of the GPS signal.
On the other hand, a web-based VTS design also utilizes information from the base stations used for “Global System for Mobile” (GSM). In the case of interruption of the GPS signal, this design utilizes information through the GSM base stations. Monitoring of vehicles is done through Google Maps (Thong et al., 2007).
Today, mobile applications become widespread and are used in many areas. Many researchers worked on the acceptance of mobile applications. Shin (2009) studied the acceptance of customers’ pocket wallet application based on the unified theory of acceptance and use of technology (UTAUT) model. He confirmed that traditional factors, ease of use, and perceived usefulness affect user acceptance. He also showed that a new factor, perceived security, has an influence on user acceptance. The studies suggest that the technology acceptance model (TAM) developed by Davis in 1989 is useful in determining the correlation and effects of antecedent variables on behavioral intentions to use wireless devices in many organizational contexts for a variety of purposes (Abramson et al., 2015). Lee et al. (2012) showed that “ease of use” is a more important factor than the others in TAM on mobile finance services. Choi and Totten (2012) explained how culture variance influences the acceptance of mobile TV application based on TAM. They showed that the interdependent self has a higher influence on the user acceptance of mobile TV application than the independent self. Zeng et al. (2013) studied the user acceptance of WeChat as a mobile application based on the UTAUT model. They demonstrated that user acceptance of mobile application (WeChat) was positively affected by “effort expectancy,” “social influence,” and “facilitating conditions.” In addition to these studies, Cardamone et al. (2016) conducted a survey application on the mobile application developed for mobile users upon request to receive and/or give information about the road condition. However, their research did not say how much individual events affect the willingness to receive and give information from the M2M platform/area. We also used the UTAUT model to investigate mobile phone application acceptance. The novelty of this research is to develop and implement the shuttle bus service management tool and validate its user acceptance via the UTAUT model and structural equation modeling (SEM).
The remainder of this article is structured in the following manner. The next section includes shuttle bus decision support system (DSS) development and implementation details. Section “SEM for user acceptance” explains SEM for user acceptance based on the UTAUT model. Section “Analysis, Results, and Discussion” describes survey analysis and discussion of findings and results. Finally, Section “Conclusion and Contributions” delivers conclusions and contributions.
DSS Development and Implementation
Scott-Morton (1971) describes DSS such that decision-makers use data and models with computer-aided interactive systems to solve unstructured problems. In this study, a DSS model is developed (shown in Figure 1) to solve the diagnosed problems through meetings between workplaces, shuttle bus company executives, shuttle bus drivers, and passengers.

Shuttle bus DSS.
Shuttle Bus DSS
A web-oriented shuttle bus service management software is developed based on this shuttle bus DSS model. The shuttle bus company can delegate factories, addresses of stations, shuttle time, shuttle buses, shuttle bus capacities, and shuttle bus drives with the help of this software. That information is saved to the database on the web server. Factory passengers, whose station information is registered, send their locations and shift hours to our web server via internet and GPS, thanks to our application in their mobile phones. Our web server determines the closest three stations according to the passenger’s location info, and then the server sends the address and distances of those stations to the passenger. Prior to this process, capacity of shuttle buses which pass by indicated stations in specified times is checked by a function that a query that asks whether the shuttle bus capacity is more than the number of passengers who select that shuttle bus. If this function returns TRUE, it means that the shuttle bus capacity is not full and the station name appears to the passenger. Hence, the three stations chosen by the server are the ones which are not fully occupied and nearest stations to the passenger’s location info that is calculated by Haversine formula. Figure 2 shows the scheme of how shuttle bus DSS works in the client side and the server side.

The scheme of the shuttle bus DSS.
The Haversine formula is an equation important in navigation, giving great-circle distances between two points on a sphere from their longitudes and latitudes (Gardiner et al., 2011). The Haversine formula gives the distance between two different points on a sphere surface in kilometers (Sinnot, 1984). In many current studies in the literature, distance calculations are made using the Haversine formula. For example, in a social media analysis study, it was used to calculate distance, Geo Tagged tweets were used, and items related to the location of Twitter data were examined (Laylavi et al., 2016). The development of mobile technologies in recent years has led to the discovery of research in the literature that has made distance and path calculations. For instance, mobile applications have been used to find the nearest free ambulance and the Haversine formula has been used for calculating distance (Wadhe et al., 2016). Another study used A star and Haversine formulas to calculate minimum distance and detect the shortest path (Chopde & Nichat, 2013).
As shown in Figure 3, one can derive Haversine formula to calculate the distance between two points as
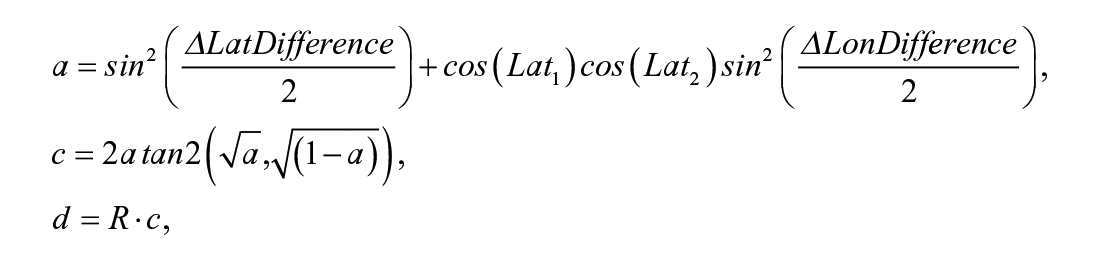
where

Latitudes and longitudes (Rubin, 2006).
When the passenger selects a station to board a shuttle, he or she remains registered at the same station and the same shuttle until he or she makes another change. The passenger can change his or her station at any time up to 1 hr before the shuttle time. In addition, if the passengers do not want to use the shuttle bus, they can inform the service driver via the application by clicking on the button to state that they will not use the service at that moment.
The passenger remains registered at the same station until he or she makes a change. The passenger is permitted to change at any time his or her station 1 hr before the shuttle time. In addition, passengers can inform the server if they do not want to use the shuttle bus.
Shuttle bus drivers can reach information about their delegated stations and number of passengers for each station through our application loaded to their mobile phones. Furthermore, data about schedules and changes are instantaneously transferred to the mobile application prepared for shuttle bus drivers. Those changes are transmitted through Google Cloud Messaging (GCM) as a warning message. Thus, shuttle route and location about each passenger pickup is sent to drivers. During the journey, the mobile application for drivers continuously gets location data and compares those with the location of passengers. Then, the system informs approaching passengers with a message via GCM. Hence, it sends a message when the shuttle reaches to the station.
Case Study and Implementation
The web-based service program is implemented for a shuttle bus company that owns 50 vehicles and has 750 passengers in Bursa city. The shuttle bus company executives, shuttle bus drivers, passengers, and two factories receiving the transportation service are interviewed. It is observed that factory workers inform changes in shift hours and addresses to the shuttle bus company too late or right before the next pickup time. Thus, every shift change faces with a difficulty resulted from passenger name and pickup station changes. In addition, sometimes passengers want to get in or get off at different stations. Those changes make the service organization more complicated and even companies hire extra personnel for this job. For every single change, factories inform the shuttle bus company which then conveys the new information of passengers and stations to shuttle bus drivers. Mostly, the passengers forgot and problems occur due to the complexity. To solve those problems, three different applications have been developed, namely, a web-based application in which the shuttle bus company manages drivers, passengers, and stations; a mobile-based application in which passengers can choose their stations according to their locations; and a mobile-based application in which shuttle bus drivers manage modified pickup.
Web application for the shuttle bus company
The shuttle bus company’s web-based application has been developed with the PHP framework (Yii2). First, the shuttle bus company enters detailed contact information about the firm. Then, the address of the firm is entered or marked on the map. Afterward, the company enters beginning times, ending times, and service days of shuttle to pick up factory workers, according to shift hours taken from the factory. In addition, the company can display suitable drivers and vehicles for that specific shuttle bus service. The location of the factory is the destination of shuttle buses which are going to be delegated according to the chosen factory passengers. Those factory passengers can see delegated stations in their mobile applications as their chosen stations. Furthermore, added stations and passengers which are delegated to those stations will be automatically transferred to mobile applications of shuttle drivers.
Mobile application for passengers
Passenger mobile application is compatible with Android smartphones. Passengers enter their locations and see the closest stations via the mobile application. It gets location information through the GPS of the mobile phone and sends data to the server. The server compares the location data sent by the passenger with stations defined by the factory, and then three closest available stations are presented on the screen to be selected by the passenger (Figure 4).

Sending the GPS data to the server via the mobile application and sending back information about the nearest three stations to the mobile application.
The mobile phone of the passenger gets information about the nearest three stations as a result of communication between the mobile application and the server. In more details, when the passenger presses the “Send Location” button, the mobile application primarily finds GPS coordinates (latitude and longitude). Then, it sends those GPS data to the server via RESTful Web service. Using the PHP programming language, it gets the latitude and longitude information of all stations registered on the MySQL database, compares it with the GPS coordinates obtained via the Android application, and calculates the distance by Haversine formula.
The resulted stations are matched with shuttle service buses to check if their capacity is not full. Then the nearest three stations to the users’ locations are found using sorting stations according to their distance in ascending order and the coordinates of the three nearest available stations are sent to the Android application. When the passenger clicks one of three stations, the passenger is added to that station automatically.
Mobile application for drivers
Driver mobile application is compatible with Android smartphones. The system shows a map provided by Google Maps in which the route is defined according to stations and destination by the shuttle service company. Hence, the driver visualizes the stations with the number of passengers on the map (Figure 5).

Station/route screen of drivers’ mobile application.
SEM for User Acceptance
We use the UTAUT model to investigate the acceptance and use of the passenger mobile application as shuttle bus DSS for passengers. We used the user acceptance model, shown in Figure 6, formulated by Venkatesh et al. (2003). Users have more intention to use a new information technology if this information technology can help improve their work performance (Davis et al., 1989; Taylor & Todd, 1995; Venkatesh et al., 2003). As stated in Venkatesh et al. (2003), the factors that have an impact on behavioral intentions and actual use within UTAUT can be explained as follows:
Performance expectations can be defined as the level of individual belief that an individual has the ability to benefit from business performance through system use. Performance expectation in UTAUT is used as a substitute for the perceived usefulness variable in the TAM.
Effort expectations can be defined as the perceived ease of use of the system. Effort expectant is used as a substitute for the ease of use variable in the TAM.
Facilitating conditions can be defined as feeling competent (knowledgeable and experienced) at the point of using the system; thinking that the users are compatible with the values, needs, and past experiences of the new system; and believing that there are organizational and technical investments supporting the use of the system. Accordingly, the facilitating conditions stem from the variables of the behavioral control perception in the modified planned behavior theory (PBT), the compatibility in diffusion of innovation theory (DOI), and the facilitating conditions in the model of PC utilization (MPCU).
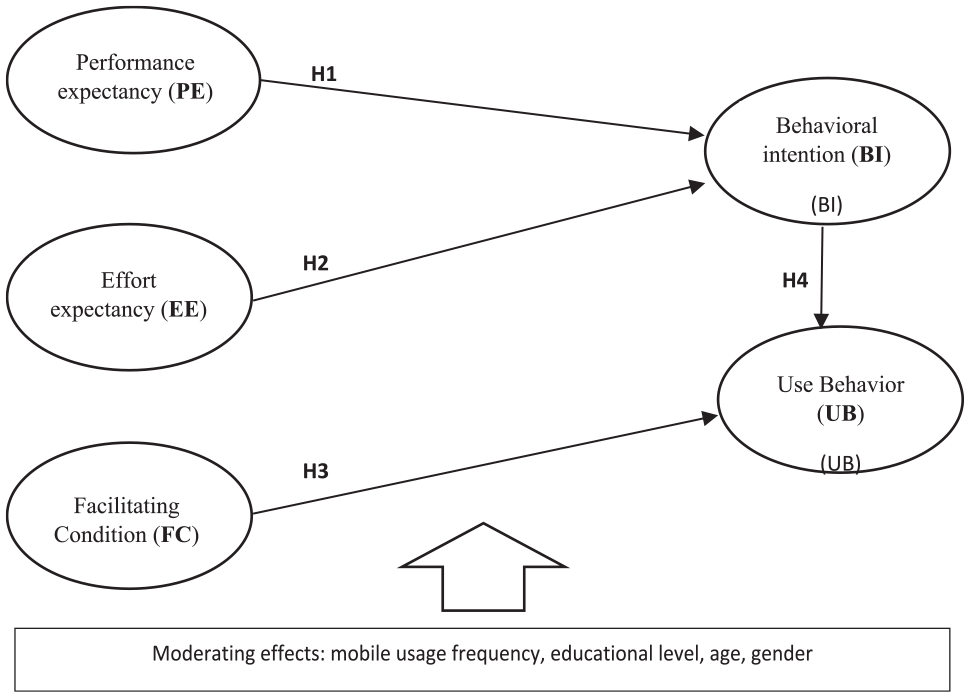
Proposed user acceptance model.
The UTAUT model provides superiority on both TAM and developed versions of TAM in adding the social effect variable in addition to the performance expectancy and effort expectancy variables, which replace the perceived usefulness and ease of use in TAM, in describing behavioral intention. Moreover, it also provides superiority in terms of having a direct explanatory potential for actual use with facilitating conditions variable.
In our model, there are four hypotheses to be tested as given below.
SEM is used for hypothesis testing in this study. As SEM comes to a large extent from confirmatory and verification techniques, its frequency of use and importance increased a lot in the social sciences in recent years. In SEM, goodness-of-fit measures are used to evaluate the whole model. These measures allow us to reach a conclusion that the whole model is supported by the data with an acceptable level. When testing SEM, it can often be said that the expected goodness-of-fit values cannot be achieved with the initial analysis. In this case, correction indices are used to reach expected values and the model is redefined and analyzed until the expected goodness-of-fit values are achieved. There are more than one goodness-of-fit measures used within the SEM. These criteria are used jointly by researchers because each of them has features of revealing a different aspect of model harmony (Simsek, 2007).
The most commonly used fit indices are the normed fit index (NFI), non-normed fit index (NNFI; also known as Tucker–Lewis index [TLI]), comparative fit index (CFI), goodness-of-fit index (GFI), adjusted goodness-of-fit index (AGFI), standardized root mean square residual (SRMR), root mean square error of approximation (RMSEA), and chi-square fit index–to–degree of freedom ratio (CMIN/DF). The wellness of different indices with different samples sizes, types of data, and ranges of acceptable scores are the major factors to decide whether a good fit exists (Hu & Bentler, 1999; Shadfar & Malekmohammadi, 2013). In general, TLI, CFI, and RMSEA for one-time analyses are preferred (Schreiber et al., 2006). The relative chi-square CMIN/DF, also called normal chi-square, is an attempt to make model chi-square less dependent on sample size (Shadfar & Malekmohammadi, 2013). In this study, CMIN/DF, NFI, CFI, and RMSEA are reported for model testing.
Analysis, Results, and Discussion
Several analyses were utilized in testing the measurement model and the structural model which is the result of the addition of hypotheses to the measurement model. Descriptive statistics, reliability analysis (Cronbach’s alpha), and modality effect of demographic variables to structural model were tested in SPSS 23.0; confirmatory factor analysis and structural model testing (path analysis) were performed in AMOS 23.0.0.
It is useful to provide some general information about the dataset to get a better understanding of the sampling before testing the measurement model and the structural model. To test the performance and user acceptance of the developed mobile passenger DSS, data were collected through the survey conducted over a representative and stratified sample of 262 participants among service shuttle passengers. The survey contained 25 questions with six subscales presented on a five-point Likert-type scale (1 = strongly disagree, 5 = strongly agree) as well as 14 questions to measure participants’ mobile usage frequency (as a moderating factor) given in the Appendix. We used factors and items given in Venkatesh et al. (2003). We adopted the smartphone usage subscale items given in Rosen et al. (2014) for the mobile usage frequency moderating factor. Descriptive statistics regarding the demographic characteristics of participants are given in Table 1.
Descriptive Statistics for Demographic Variables.

First, the measurement model is tested to show that each component in the model is a valid and reliable measurement tool. Different analyses are used to test the validity and reliability of the measurement model. For validity, confirmatory factor analysis was used and Cronbach’s alpha test, one of the internal consistency analysis methods, was used for reliability.
The confirmatory factor analysis (validity analysis) was carried out by AMOS, and it was determined whether the measurement model was suitable with goodness-of-fit measures as a whole and whether the factor loads of the questions were balanced. In the reliability analysis conducted by the SPSS, Cronbach’s alpha values were focused and checked whether the value is greater than .7 for each factor separately.
Validity Analysis for the Measurement Model
The validity of the UTAUT scale was tested by confirmatory factor analysis. During the confirmatory factor analysis, each factor is analyzed regardless of being a dependent or independent variable in the model. The results of the confirmatory factor analysis of the UTAUT model as a whole are given in Table 2. When we look at the first analysis results, it is realized that the model tested does not give the expected values for any of the goodness-of-fit measures.
Goodness-of-Fit Measures for the Measurement Model.

Note. CMIN/DF = chi-square fit index–to–degree of freedom ratio; NFI = normed fit index; CFI = comparative fit index; RMSEA = root mean square error of approximation.
The final state of the proposed research model is shown in Figure 6. The goodness-of-fit measure values for the measurement model are given in Table 2. Based on the results shown in Table 2, the proposed model in Figure 6 is regarded as acceptable, because NFI exceeds 0.90 and CFI exceeds 0.93 (Byrne, 1994), CMIN/DF should be less than 2 or 3 (Kline, 1998; Ullman, 2001), CMIN/DF should be less than 5 (Schumacker & Lomax, 2004), and RMSEA should not exceed 0.08 (Hu & Bentler, 1995). We have adopted a value of “5” for CMIN/DF.
Correction indices and item subtraction processes were used to approximate the level of expected goodness-of-fit values for measurement models. Accordingly, three items in the “social influence” subscale, one item in the “behavioral intention” subscale, one item in the “effort expectancy” subscale, and one item in the “use behavior” subscale were removed from the model. In addition, covariance is defined between the first and second questions for the performance expectancy factor in the model (Figure 7).

Confirmatory factor analysis final result of the scale.
Reliability Analysis for the Measurement Model
Cronbach’s alpha test was used for reliability analysis. After the correction and item subtraction process, there are 19 questions in the measurement model. Cronbach’s alpha values were above .7 for all subscales and across the scales. The number of questions for each factor and Cronbach’s alpha values for each factor are given in Table 3.
Factor-Based Reliability Analysis.
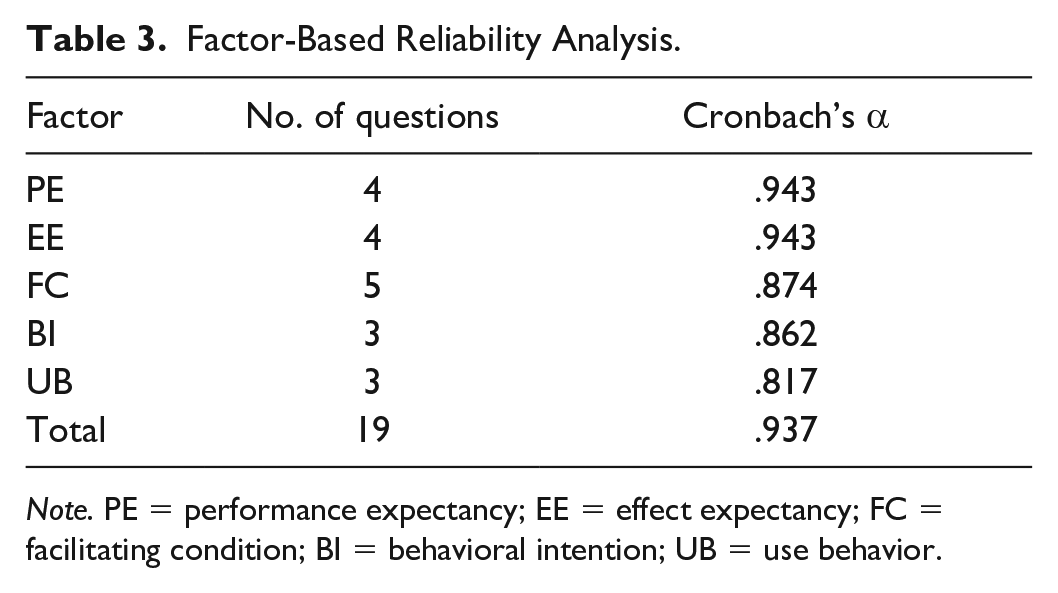
Note. PE = performance expectancy; EE = effect expectancy; FC = facilitating condition; BI = behavioral intention; UB = use behavior.
Testing the Structural Model
The goodness-of-fit measures of the structural model established on the remaining items after the validity and reliability analyses applied to the measurement model are given in Table 4.
Goodness-of-Fit Measures for the Structural Model.

Note. CMIN/DF = chi-square fit index–to–degree of freedom ratio; NFI = normed fit index; CFI = comparative fit index; RMSEA = root mean square error of approximation.
The p and t values found from AMOS were utilized in the evaluation of the hypotheses. The hypotheses are shown as supported when p values are less than .05 and t values are greater than 1.96 considering the direction of hypotheses. Hence, H1 was not supported in the model and the others were supported (Figure 8).

Results of the proposed model.
The summary hypothesis test results are given in Table 5 where SE is an estimate of the standard error of the covariance, CR is the critical ratio obtained by dividing the covariance estimate by its standard error, and “*” values are critical ratios exceeding 2.32 at the .01 level of significance.
Summary of Hypothesis Tests.

Note. CR = critical ratio; PE = performance expectancy; BI = behavioral intention; EE = effect expectancy; FC = facilitating condition; UB = use behavior.
p < .05. **p < .01. ***p < .001.
As given in Table 5, significant and meaningful relationships were found between effort expectation and behavioral intention, between facilitating conditions and actual use, and between behavioral intention and actual use of mobile application users. However, there was no significant relationship between performance expectancy and behavioral intention. Therefore, H1 is not supported; however, H2, H3, and H4 are supported. The result of performance expectancy does not have a linear relationship with behavioral intention which overlaps with the findings of Zeng et al.’s (2013) work. However, in many studies, there was a significant relationship between performance expectancy and behavioral intention (Agarwal & Karahanna, 2000; Shin & Kim, 2008; Venkatesh et al., 2003).
Testing the Moderating Effects of Demographic Variables
Gender, age, and education level variables were selected as moderating variables in this study as given in the literature. In addition, as we have a working mobile phone application, the frequency of mobile usage of users is also included as a moderating variable.
The age moderator is grouped as junior (below 40 years old) and senior (above 40 years old) by considering appropriate studies in the existing literature for our participant profile (Cheng et al., 2011; Serenko et al., 2006; Shin, 2009). The education level moderator is grouped as high school, undergraduate, and postgraduate; the mobile usage frequency moderator is also grouped by weekly, several times a week, and every day.
Tables 6 and 7 show the results of the moderator effects. The frequency of mobile usage has the moderator effect on both the effect of facilitation conditions on the actual use and the effect of behavioral intention on actual use. It can be said that the frequency of mobile usage has more moderator effect of the facilitation conditions on the actual use for everyday users (β = 0.060; p < .01) compared with the once-a-week (β = 0.038; p < .01) and several-times-a-week users (β = 0.052; p < .01).
Results of Moderate Effects for Gender and Age.
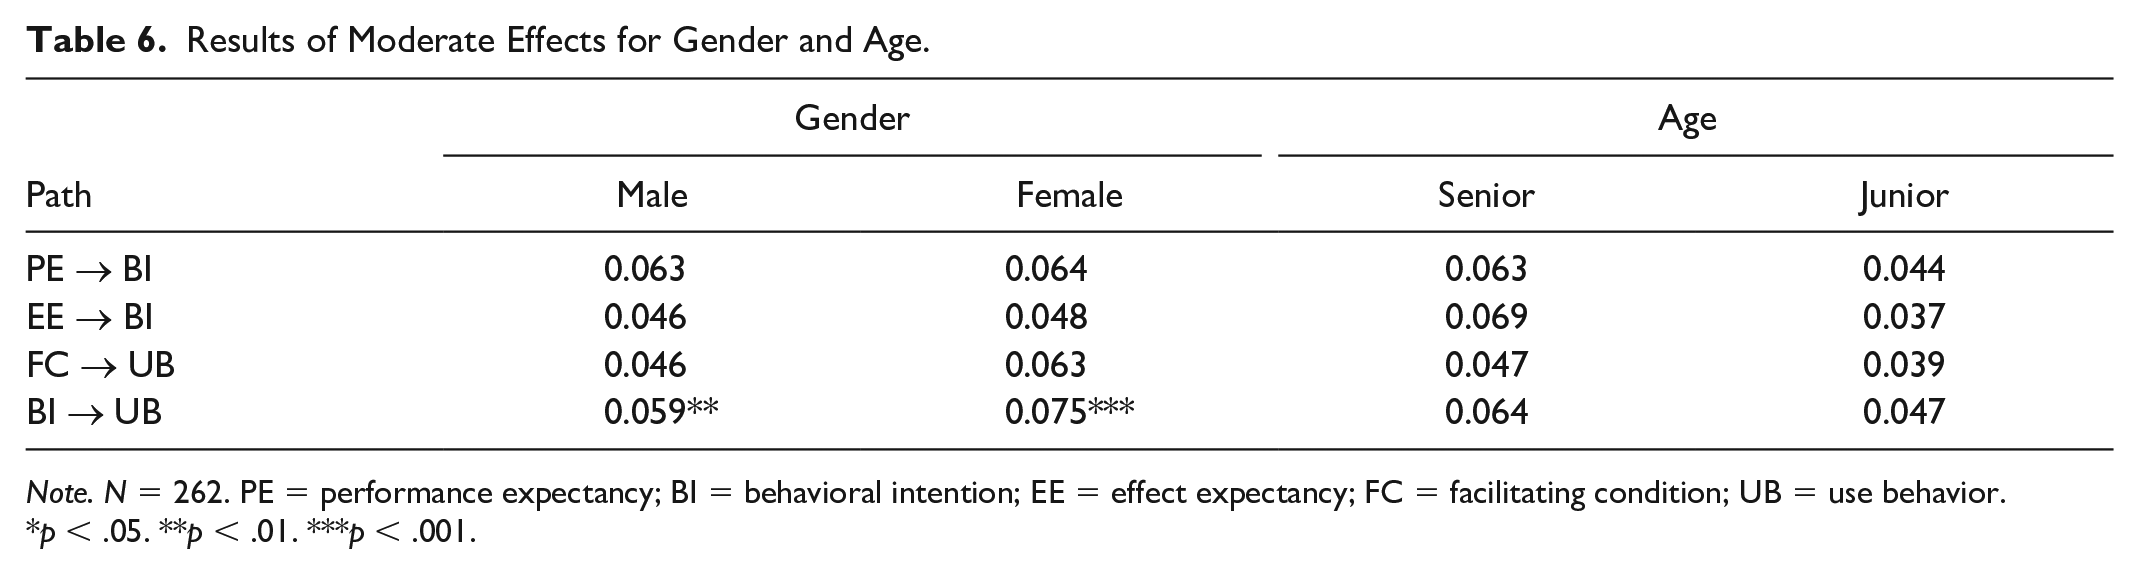
Note. N = 262. PE = performance expectancy; BI = behavioral intention; EE = effect expectancy; FC = facilitating condition; UB = use behavior.
p < .05. **p < .01. ***p < .001.
Results of Moderate Effects for Education Level and Mobile Usage Frequency.

Note. N = 262. PE = performance expectancy; BI = behavioral intention; EE = effect expectancy; FC = facilitating condition; UB = use behavior.
p < .05. **p < .01. ***p < .001.
Similarly, it appears that the education level has a moderator effect on the effect of facilitating conditions on the actual use, and gender has a moderator effect on the effect of behavioral intention on the actual use. The education level has more moderator effects of the facilitation conditions on the actual use for postgraduate users (β = 0.061; p < .001) compared with undergraduate (β = 0.050; p < .01) and high school users (β = 0.038; p < .01). Moreover, gender has more moderator effects of behavioral intention on the actual use for female users (β = 0.075; p < .001) compared with male users (β = 0.059; p < .01). In other words, females have more behavioral intention and found the application to be more useful than males.
The model created to examine the effects of these moderators is shown in Figure 9. As a result of the above findings, hypotheses and hypothesis test results for moderating effects according to our structural model in Figure 9 are given in Table 8.

Extended model.
Effects of Moderators on the Relationship Between Variables.

Note. PE = performance expectancy; BI = behavioral intention; EE = effect expectancy; FC = facilitating condition; UB = use behavior.
In addition to these survey findings, service company employees pointed out that the proposed DSS application provided the convenience of distributing the passengers to the services. It has been seen that the most time-consuming and troublesome problem encountered almost every day for the service company is the service change of the passengers. While handling service change request for the passengers before this application, mistakes could easily be made, resulting in that some passengers could not be picked up from the stops. With this application, the information of the passengers who make the service change in the mobile environment can be transferred automatically to the service driver. Thus, it is observed that the loss of time and work power is prevented. Normally, it takes about 30 to 35 min for a passenger to report a request for service change to the service authority, to have the authority search for a service, to update the service list and return it to the service driver, and to report back to the passenger. All of these operations are now carried out in seconds. It has improved the ability of the service provider to develop an instant solution to passengers.
Conclusion and Contributions
With the help of the software application developed in this study, shuttle service drivers can make decisions about instant routes according to passengers’ locations. In addition, the shuttle bus companies can see their drivers’ routes, their pickups, monthly shuttle journeys in sum, and the amount of necessary payments. Hence, it facilities preaccountancy. The most important satisfaction for passengers is to be able to communicate easily their pickup stations by just sending the location. Besides, passengers are glad to get notifications when shuttles approach and arrive, and be able to see the location of the shuttles instantly. It is realized that the service company has saved the time and work power via automating passengers’ service bus change operations with the mobile application. It is also seen that the passengers are pleased with the ease of updating the service schedule. The survey results indicate that participants find the mobile service automation application easy to use, do not spend too much time using it, easily update their service, do not have to wait at the bus stop, actively use the application, and find it useful for passengers.
Footnotes
Appendix
Declaration of Conflicting Interests
The author(s) declared no potential conflicts of interest with respect to the research, authorship, and/or publication of this article.
Funding
The author(s) received no financial support for the research, authorship, and/or publication of this article.