
Abstract
The aim of this study is to evaluate objective and perceived campus walkability as an environmental support for physical activity within a large Southeastern university. Ten university routes were evaluated twice for 24 key walkability characteristics. Eighty-three campus member surveys (62 students, 21 faculty/staff) were administered and assessed campus members’ familiarity with walkability, attitudes about walking as a form of physical activity, and perceptions of whether specific elements of the campus layout encouraged physical activity. At least 90% of routes had sidewalks, curb cuts, and crosswalks. Likewise, over 85% of participants perceived the campus layout to encourage physical activity. Faculty/staff members were more familiar with the term walkability and considered walking as a form of physical activity than students (p < .05). Both campus members’ perceptions and environmental audits identified strengths and weaknesses for diverse walkability attributes. Results will be used to improve campus infrastructure and promote increased walking and physical activity at the university.
University campuses serve as more than just centers of academic excellence. They are settings of personal growth and exploration for many young adults and help facilitate the development of lifelong health behaviors such as engagement in physical activity (Asadi-Shekari et al., 2014; Dinzeo et al., 2014; Leslie et al., 2011). Due to large campus environments and integrated infrastructure, such as walkways, bikeways, and roadways, students often have access to facilities that promote an active lifestyle within a traditional university setting (Kaczynski et al., 2012; Peachey & Baller, 2015; Sun et al., 2014).
The university environment can encourage active behavior for all university members, including students, faculty, and staff (Bopp et al., 2014, 2016; Sun et al., 2014). However, recent findings have shown an overall decrease in the amount of physical activity reported by both students and faculty throughout most college campuses in the United States (Bopp et al., 2014, 2016; Downes, 2015; Healthy Campus 2020, 2015; National College Health Assessment [NCHA], 2016). Studies have reported that nearly half of U.S. college students fail to obtain sufficient exercise or physical activity (Bopp et al., 2016; Downes, 2015; Huang et al., 2010; Roemmich et al., 2015). According to baseline measurements of the Healthy Campus 2020 report in 2010, only 48.7% of U.S. college students achieved the federal guidelines for aerobic activity per week (Healthy Campus Baseline Report, 2015b). A similar trend was also shown among faculty and staff members at the same universities as only 36.2% engaged in no leisure-time physical activity within their workday, which may increase the prevalence of diseases such as obesity and diabetes (Healthy Campus 2020, 2015a; Roemmich et al., 2010).
One large university located in the Southeast Region of the United States was no exception to the national collegiate trends of declining physical activity. In 2010, only 49.8% of students and 46.5% of faculty and staff at this university met the federal guidelines for physical activity (Healthy Campus 2020, 2010). In an effort to increase the overall physical activity levels at the university, campus representatives developed health behavioral programming and university health campaigns to promote physical activity. In 2015, however, the university’s NCHA reported a slight decrease in the number of students meeting the recommended physical activity guidelines from 49.8% to 48.6% (NCHA, 2016). Faculty and staff also experienced a decrease in the number of individuals meeting physical activity guidelines from 46.5% to 42.6% (Faculty and Staff Evaluation Report, 2016). Seeking other means to increase the prevalence of physical activity among students, faculty, and staff members, the university focused its efforts away from physical activity programming and campaigning to the environment, in particular the walkability of the campus.
Walkability is defined as the ability to quantify the safety and desirability of walking routes within a particular setting (Centers for Disease Control and Prevention [CDC], 2017a). Such measures can be influenced by environmental factors, including street organization, accessibility of destinations, and safety (Owen et al., 2007; Sisson et al., 2008; Tuckel & Milczarski, 2015; Yang et al., 2017). Walkability at a university campus is often configured by both the physical environment and the perceptions of the environment among university members (Asadi-Shekari et al., 2014; Horacek et al., 2018; Sun et al., 2014). According to a recent study by Horacek and colleagues (2018), as students’ perceived barriers to physical activity increased, so did their body mass index (BMI). Walkability is a crucial consideration for university populations as walking is considered the main form of transportation within a traditional university setting, and walking can also assist students, faculty, and staff in meeting their daily recommendation of 30 min or more of moderate physical activity during the school or workday and maintaining a healthy body weight (Asadi-Shekari et al., 2014; Bopp et al., 2014, 2016; CDC, 2017b; Horacek et al., 2018; Sisson et al., 2008; Sun et al., 2014). Research has also indicated that staying physically active during college may increase students’ chances of being active throughout their lifetimes (Bopp et al., 2014; Buchner et al., 2008; Horacek et al., 2018; Peachey & Baller, 2015; Sun et al., 2014). However, the formation of these habits may be hindered if the infrastructure and environment do not support the promotion of physical activity or weight management behavior (Horacek et al., 2012, 2018; Kaczynski, 2012; Martinez et al., 2016).
Some prior research has been conducted on how campus environments affect physical activity levels among students at various universities (Frank et al., 2005; Horacek et al., 2018; Sisson et al., 2008). In particular, a study by Sisson, McClain, and Tudor-Locke examined how the size of the campus layout was related to students’ activity levels at two state university campuses (Sisson et al., 2008). After collecting students’ pedometer-determined steps, the authors concluded that larger campus environments with restricted automobile usage contributed to higher levels of physical activity than smaller campus environments (Sisson et al., 2008). This study identified a positive association between larger campus environments and increased levels of students’ physical activity compared with those attending smaller institutions (Sisson et al., 2008).
Despite the impact that a large university environment may have on the physical activity levels of students, faculty, and staff, little research has investigated university members’ attitudes and perceptions about the walkability of their campus environments and how it may influence their choice to be physically active. Likewise, a select number of prior studies have included both subjective and objective data to examine the walkability of a campus environment, including surveys and detailed observational audits of diverse walkability attributes (Horacek et al., 2018; Li et al., 2016).
Consequently, the overall purpose of this study was to identify students’, faculty, and staff members’ perceptions and beliefs about the campus walkability and to objectively evaluate the walkability of the campus environment to investigate its potential impact on physical activity levels within the university’s population. To accomplish this, multiple methods were used to evaluate campus walkability, including environmental audits of campus walking routes and campus member surveys. Specifically, observation audits identified the degree to which detailed walkability characteristics, such as infrastructure, safety, and accessibility, were supported along key campus walking routes and how certain walkability aspects may need to be improved to support walking on the campus. As well, campus member surveys were used to investigate how student perceptions of campus walkability may differ from those of faculty and staff with respect to their familiarity with the term walkability, whether they perceived walking as a form of physical activity, if they perceived the overall campus layout as encouraging physical activity behavior, and ratings of other specific walkability characteristics. In general, using these diverse approaches to understand the walkability of the campus and its impact on physical activity behavior can lead to improvements in not only the environment but also perceptions of walkability among all campus members.
Method
Study Setting
This study occurred in a large, urban campus located in Southeast Region of the United States. The campus spans over 350 acres within the downtown area of a large city. Due to campus growth and expansion over the last few decades, parts of the campus are integrated among other city, government, and private business buildings and, therefore, are open to the public. The university campus is set as a gridded layout with major city streets and intersections running throughout the campus setting.
The university comprises nearly 34,000 students—about 25,500 undergraduates and 8,500 graduate students—and has approximately 9,000 faculty and staff employees (University Current Enrollment and Demographic Information, 2018). On a typical weekday, nearly 36,000 campus members commute to the university by foot, bike, bus, or automobile (University Current Enrollment and Demographic Information, 2018). Limited space is available for automobile parking, which is an additional cost to campus members (University Current Enrollment and Demographic Information, 2018). Campus members may choose to use university bus shuttles, bike, or walk throughout campus during the school or workday.
Plans to expand the university continue to develop over the next several years, and therefore a need emerged to examine the safety and condition of university infrastructure such as walkways, bikeways, and roadways. In collaboration with the university’s Student Health Services and Healthy Campus Initiatives, an evaluation was performed using both environmental scan audits and campus member walkability surveys to measure the walkability of the campus and its potential impact on the physical activity levels of university members. The study was approved by the university’s Institutional Review Board.
Environmental Scan Audits
The purpose of the environmental scan was to assess the current state of campus walking routes and identify any problem areas that may impede the walkability of the campus. A route was designated as a planned walking course that researchers selected to evaluate both the environmental surface and physical surroundings. Initial observations were performed to investigate the population density of campus walking routes during morning and late afternoon hours and their proximity to academic, housing, and administration buildings. Subsequently, 10 walking routes were selected based on campus location and popularity of use by students, faculty, and staff. Routes were mapped and measured using a global positioning system before being assessed (Map My Run, 2017). Collectively, 7.86 miles of university walking paths, trails, and sidewalks were audited in the evaluation. The routes ranged in length, with the shortest of the 10 routes measuring a little over one-quarter of a mile and the longest being 1.27 miles.
An audit tool was created to measure the walkability of a university campus environment. The tool was developed using other neighborhood and workplace walkability tools as references. In particular, the CDC’s Healthier Worksite Initiative Walkability Audit Tool and Delaware Institute’s Healthy Communities: The Walkability Assessment Tool played a critical part in creating the campus audit tool (CDC, 2017; Dannenberg et al., 2005; O’Hanlon & Scott, 2010). The campus audit tool was then piloted by staff and student employees within Student Health Services on a selected route to test validity and interrater reliability.
Ultimately, the campus walkability audit tool included 24 questions assessing diverse walkability characteristics. The tool was organized into categorical components investigating walkability elements of each route such as infrastructure, safety, and aesthetics. The first component of the environmental scan for each route identified whether there was existing infrastructure such as a sidewalk, walking path, or safe shoulder present that could be used by a pedestrian. Other components of the tool identified sidewalk appearance and amenities, crosswalk appearance and amenities at intersections, and overall evaluators’ walking experience. These topics and particular characteristics were selected to comprehensively measure the overall walkability of the university setting and to identify specific areas of improvement in infrastructure and other walkability features, which reflect similar tools that measured the walkability and bikeability of other university campus studies (Horacek et al., 2012; Li et al., 2016).
After selection of routes and preliminary testing of the audit tool, five evaluators were selected and trained to conduct environmental scans of the 10 walking routes located across the campus. Evaluators completed the environmental scans over 2-week period. Each route was evaluated twice, once in the morning and once at dusk, by two different investigators. In total, each evaluator was assigned four different routes to assess and took pictures of areas of concern or areas of strength noticed along their evaluation of each route, which were later used to present findings to campus facilities and other university stakeholders. Investigators were also instructed to mark the location of any problem areas on a printed map of the route to provide exact locations for further investigation by campus facilities and researchers seeking to improve the environment. Overall, evaluators spent between 30 and 60 min assessing each route. There were limited discrepancies between evaluators for each route. However, if one evaluator identified an area of concern or strength that was not noted by the other, researchers documented the outcome and followed up with the evaluators to discuss the inconsistency in reporting the item on the audit tool.
Campus Member Walkability Survey
The purpose of the campus member walkability survey was to assess the attitudes and perceptions of students, faculty, and staff about the walkability of the campus. Paper surveys were administered on a voluntary basis at the university’s farmers’ market over 2 weeks. The survey was organized into four sections that investigated respondents’ demographic and behavioral information (gender, status at the university, year in school, and the average amount of time spent walking around campus each week), perceptions of physical activity on campus (whether each participant considered walking as a form of physical activity and whether the campus layout encouraged physical activity), familiarity with the term walkability, and perceptions of seven key walkability characteristics around campus (sidewalks/paths were continuous, sidewalks/paths were relatively even, motor vehicle traffic was a potential risk to pedestrians, time allotted at intersections for pedestrians to cross, whether there was appropriate shading/lighting along campus walking routes, and whether there was a significant amount of trash along sidewalks/paths throughout the university). Many of these six characteristics were similar to those assessed within the environmental scan audit tool, and respondents indicated their level of agreement with each item using a 4-point scale (strongly agree, agree, disagree, or strongly disagree; items were subsequently reverse-coded and dichotomized as disagree or agree). Surveys were pilot tested among staff employees and members of a student leadership organization (n = 17) within the university’s Student Health Services. Survey results from the pilot testing were not included in the initial study.
To encourage participation in the campus member walkability survey, incentives were provided at certain times of data collection. Paper copies of the survey were administered at the university’s farmers’ market several weeks in a row. Upon completion of the survey at the weekly market, participants received a sample of a healthy snack and were provided a recipe card to encourage students to make the dish on their own. In a couple instances, university faculty offered extra credit for their students toward a class assignment upon completion of the campus member survey. The survey was also placed and advertised on the university’s website to increase the convenience and accessibility of the subjective tool; however, very few responses were provided electronically.
Analysis
Analyses of the environmental scan results were conducted using SPSS 22.0 (IBM Corp., 2013). Walkability characteristics were identified as either strengths or weaknesses within the campus environment using frequencies and other descriptive statistics. Areas of strength (e.g., shading, lighting, continuous sidewalks) were defined as positive walkability characteristics that the university environment currently possesses, which encourage students, faculty, and staff to be physically active. Areas of weakness (e.g., significant amount of litter, motor vehicle traffic) were specific walkability characteristics that either the university’s infrastructure currently does not support or could improve on with additional attention and resources. Specific concerns were identified and marked on the route maps that can later be addressed by the university’s facilities department.
SPSS 22.0 was also used to analyze campus member survey responses and differences in students’ perceptions of campus walkability compared with those of faculty/staff. Logistic regression was used to analyze whether, compared with faculty/staff, students were more or less likely to be familiar with the term walkability, to consider walking as a form of physical activity, to perceive the overall campus layout as encouraging physical activity behavior, and to agree with the presence of specific walkability characteristics on campus. Gender and time spent walking around campus per week were included as covariates within all analyses, and significance was set at p < .05.
Results
Environmental Scan Audit
On a college campus, the presence of infrastructure that supports campus members’ ability to walk is important. Nine out of the 10 routes evaluated had continuous walking paths or sidewalks along the entire route. Among the routes that were considered continuous, nearly 90% of those had sidewalks located on both sides of the road. However, when a permanent sidewalk or path was not present along a route, the presence of a safe shoulder or other walkable area was not available for a pedestrian to use safely except for the road itself.
When evaluating the appearance of sidewalks, evaluators reported that 85% of sidewalks were free from permanent obstructions such as trashcans, parking meters, and light poles. All sidewalks and walking paths were rated as being free from significant amounts of litter, cigarette buds, or broken glass. Evaluators indicated that nine out of the 10 routes evaluated had sidewalks that were 3 feet wide or larger; however, 30% of those routes were reported as having overgrown vegetation that either hindered walkability or made the width of the sidewalk significantly smaller. About 60% of routes were identified as having uneven sidewalks that could pose potential harm to pedestrians if they tripped while walking.
In terms of sidewalk amenities, evaluators reported that there were benches or tables for seating along 85% of routes. They also documented eight routes having sufficient shading and lighting along the entire route, and 100% of routes had Emergency Blue Light systems campus members could access to contact campus police in case of an emergency. However, about 15% of Emergency Blue Light systems were reported as being out of service. Evaluators also noted that certain portions of sidewalk were currently inaccessible on at least two routes due to construction, and a safe alternative route was not provided at the time of observation.
Researchers also investigated crosswalks separate from sidewalks to evaluate the walkability of intersections throughout the campus environment. The evaluators reported nine out of the 10 routes had crosswalks present at every intersection along that particular route; 90% of intersections that were evaluated had curb cuts, allowing those with disabilities or those using other forms of active transportation, such as a bike, skateboard, or roller skates, to easily access the sidewalks from the road. However, only 70% of intersections had sufficient time for pedestrians to cross. In addition to time allotted, evaluators reported that 15% of intersections were either missing markings or needed crosswalks to be re-striped.
The most significant area of concern observed at intersections was the lack of yield to pedestrian signs. Only 40% of intersections evaluated had such signs, and this was considered the greatest contributor as to why evaluators reported difficulty in crossing intersections and streets due to cars not properly stopping for pedestrians. Low visibility of pedestrians was also reported along three routes that intersected loading docks and parking garages, with designated crosswalks present but no other indication of a pedestrian crossing.
Overall, 70% of routes were rated as aesthetically pleasing and safe by evaluators. Three routes were identified as having one or more intersections that posed potential risks from high-speed motor vehicle traffic for pedestrians while crossing. However, at least 85% or more of routes were reported as having adequate seating, lighting, and maintenance.
Campus Member Walkability Survey
A total of 83 campus members (62 students and 21 faculty/staff) successfully completed the survey. Characteristics of the study survey sample are displayed in Table 1. The majority of participants were female (80.7%). Nearly, 75% identified as a student and 25% as a faculty or staff member (2.41% faculty; 22.9% staff). Among those who identified as student participants, 25.0% were currently enrolled as freshmen, 16.7% as sophomores, 14.5% as juniors, 12.0% as seniors, and 7.2% as graduate students. When asked about the amount of time spent walking around campus per week, 24.1% stated <1 hr, 32.5% stated 1 to 2 hr, 19.3% stated 2 to 3 hr, and 24.1% stated >3 hr.
Demographic Characteristics of Survey Respondents.

Participants were first asked whether they were familiar with the term walkability prior to completing the current survey. As shown in Table 2, students (42.0%) were significantly less likely (odds ratio [OR] = 0.30, 95% confidence interval [CI] = [0.10, 0.90]) to be familiar with the term walkability prior to the survey than faculty/staff (71.4%). Students (72.0%) were also significantly less likely (OR = 0.16, 95% CI = [0.03, 0.86]) to consider waking as a form of physical activity when compared with faculty/staff (90.5%). In contrast, when asked whether participants perceived the campus layout as encouraging physical activity behavior, the percentage of agreement was reversed. Over 90% of students stated that the campus layout supports physical activity behavior compared with only 76.2% of faculty/staff, although this difference was not significant (OR = 3.37, 95% CI = 0.78, 14.56).
Differences in Student and Faculty/Staff Perceptions of Campus Walkability.
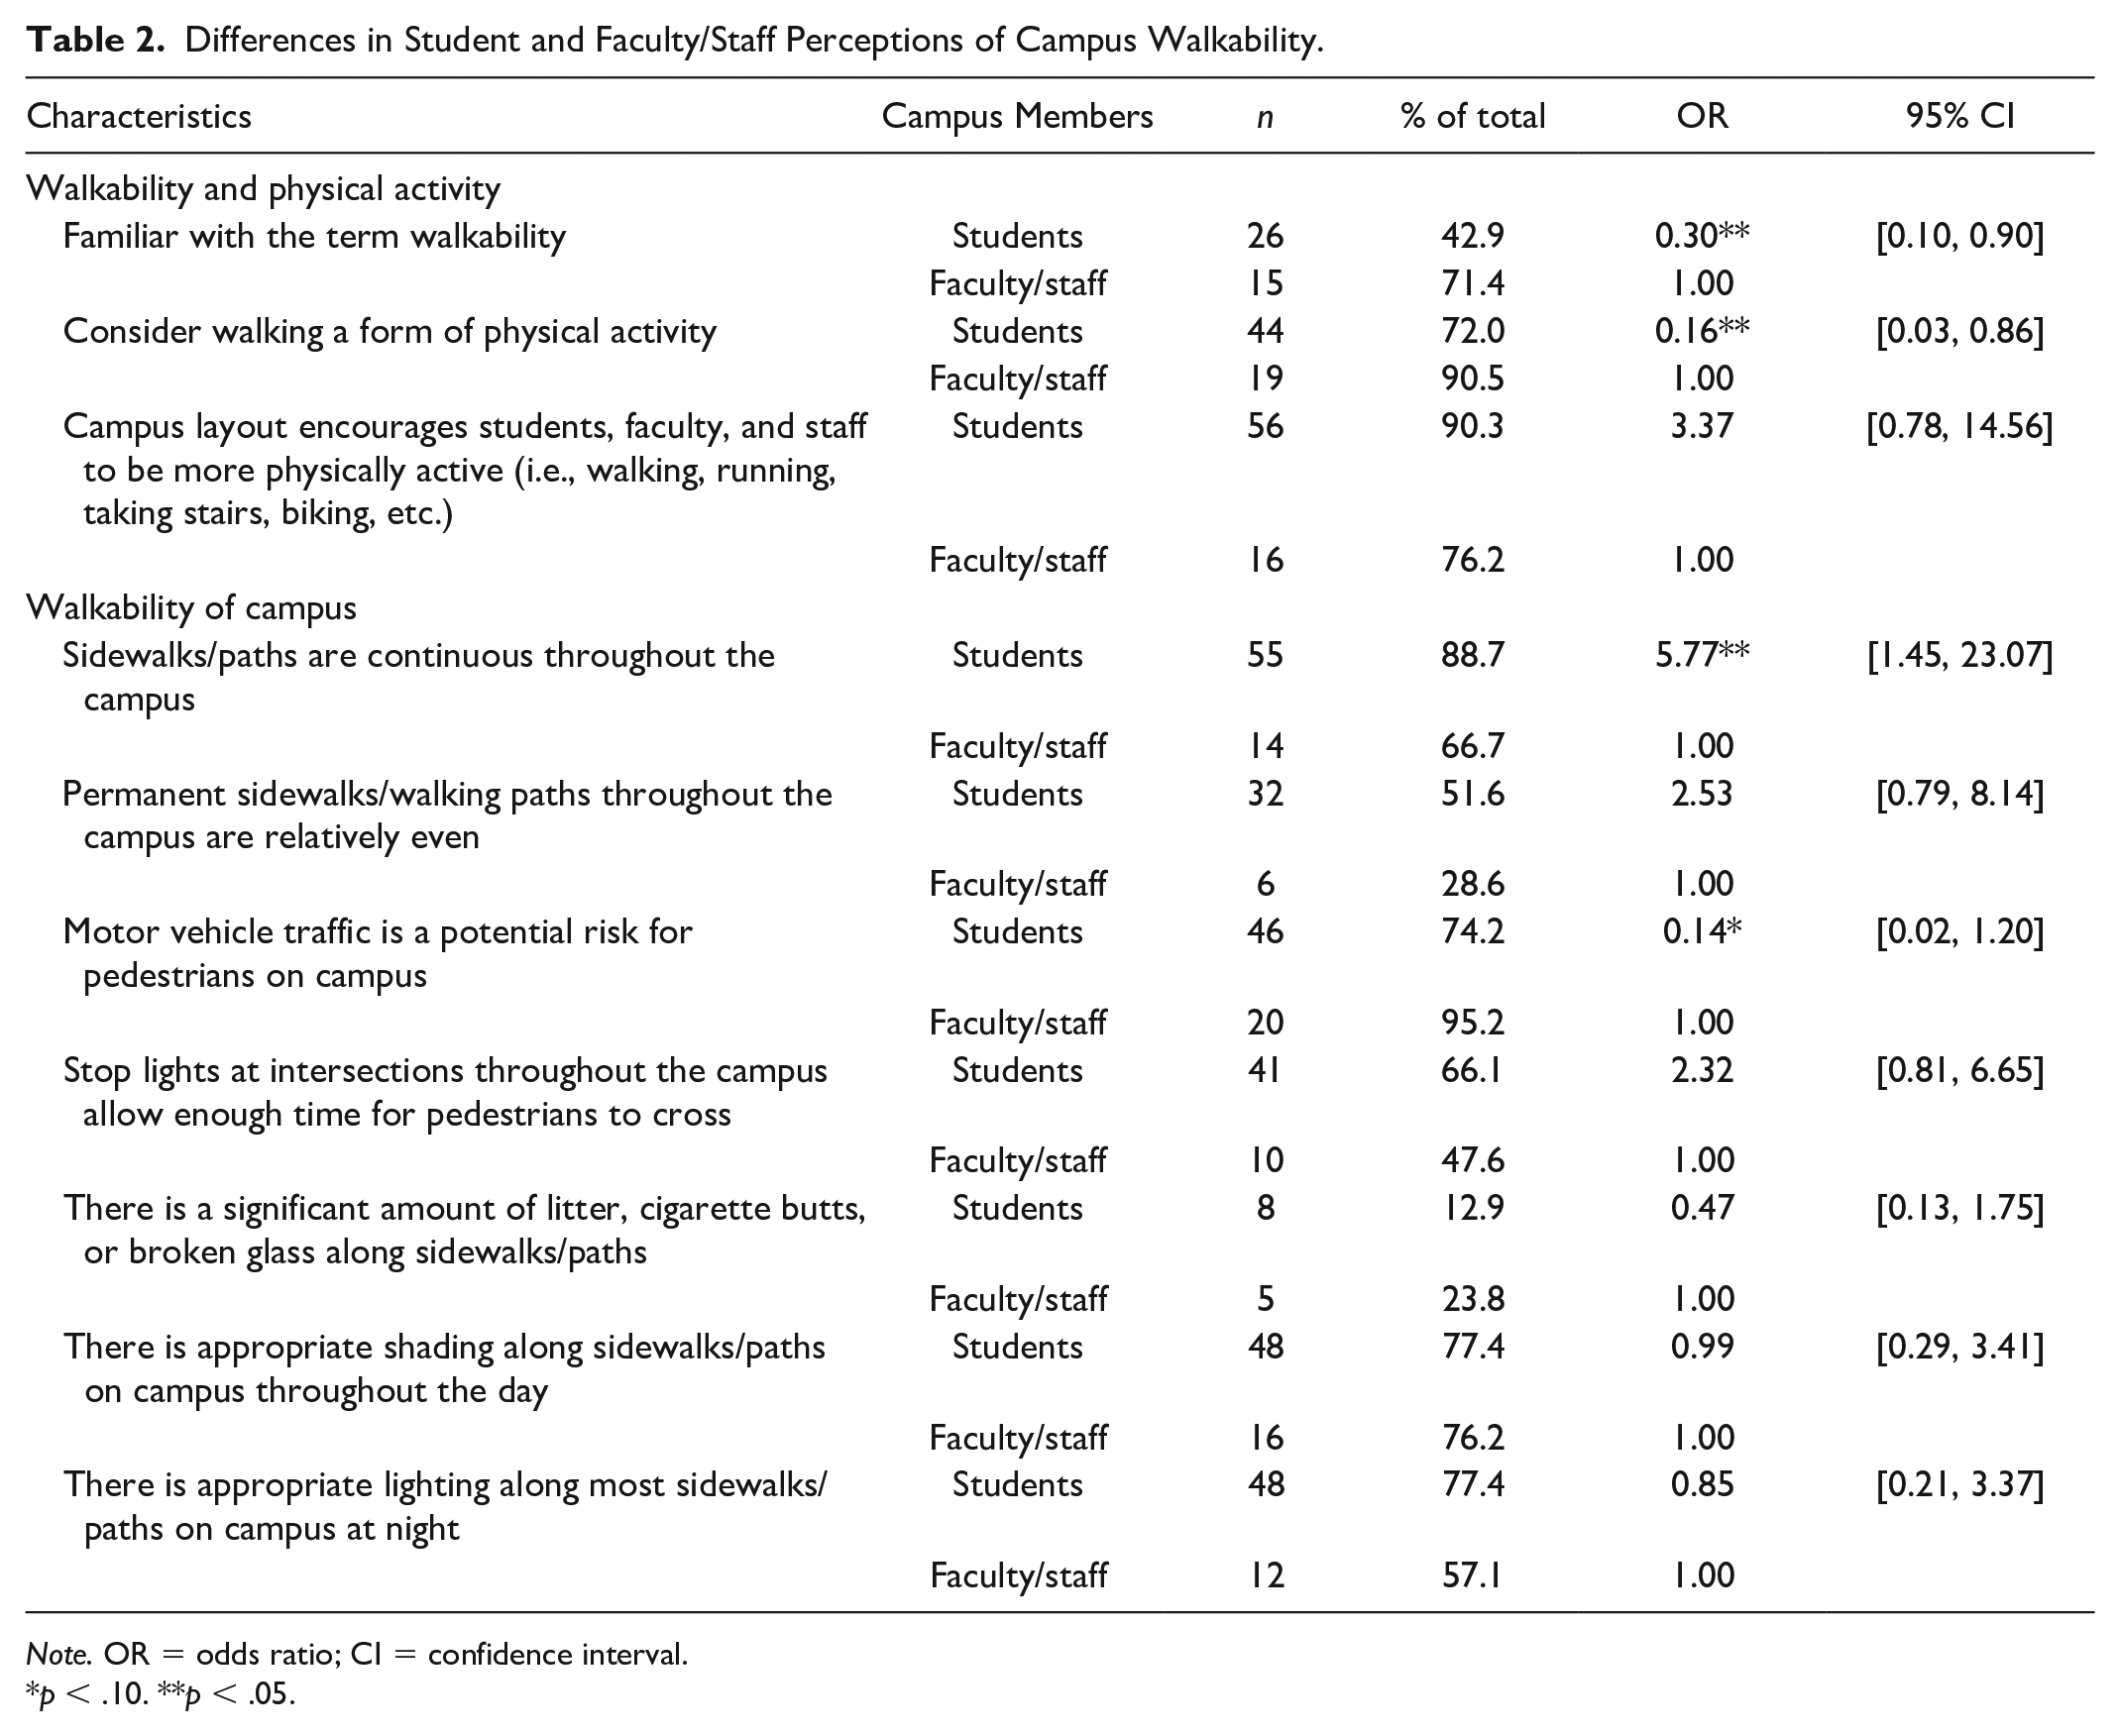
Note. OR = odds ratio; CI = confidence interval.
p < .10. **p < .05.
Throughout the remainder of the survey, participants were asked whether they agreed or disagreed with the presence of certain walkability characteristics on the campus. As shown in Table 2, students (88.7%) were almost 6 times more likely (OR = 5.77, 95% CI = [1.45, 23.07]) to agree that sidewalks/paths were continuous throughout the campus compared with faculty/staff (66.7%). As well, a marginally significant difference (OR = 0.14, 95% CI = [0.02, 1.20], p = .07) was also found in students (74.2%) being less likely to perceive motor vehicle traffic as a potential risk to pedestrians on campus than faculty/staff (95.2%). In addition to these differences between students and faculty/staff, there were similarities among all participants. As shown in Table 2, the majority of the study population perceived that there was sufficient lighting (students = 77.4%, faculty/staff = 57.1%) and shade (students = 77.4%, faculty/staff = 76.2%) along campus walking routes. Furthermore, very few students (12.9%) and faculty/staff (23.8%) perceived campus walking routes as having significant amounts of litter, cigarette butts, or broken glass along sidewalks/paths.
Discussion
With students, faculty, and staff reporting lower levels of physical activity than in previous years, a greater understanding of how the university environment, particularly campus walkability, influences physical activity behavior was needed (NCHA, 2016). Thus, the overall purpose of this study was twofold: (a) to identify student, faculty, and staff perceptions and beliefs about campus walkability, and (b) to evaluate campus walkability to assess environmental impacts on physical activity. This study was relatively similar to some previous studies that utilized both subjective and objective data, including surveys assessing participant views on campus walkability and observational audits of the campus environment (Horacek et al., 2018; Li et al., 2016). Use of multiple methods of data collection lends strength to the study and provides additional insight into campus walkability and physical activity behavior (Horacek et al., 2018; Li et al., 2016). For example, large university campuses with restricted car use may promote student physical activity; however, further insight into the mechanisms that influence physical activity behavior, specifically university member perceptions and beliefs regarding walkability, was needed (Horacek et al., 2018; Li et al., 2016; Sisson et al., 2008).
This particular study complemented the findings of Horacek and colleagues (2018) that perceptions of physical activity behavior are an important factor to account for members’ overall activity on campus but should not be used as an accurate representation of the built environment itself. However, Horacek et al. (2018) were able to study relationships between students’ BMI and walkability/bikeability of college campuses, which went beyond the scope of this initial study. A similar overall conclusion was apparent in another study conducted by Li and colleagues (2016) that investigated the objective and perceived aspects of road use by bikers and walkers at North Texas University. The researchers identified that motor vehicle traffic created a perceived barrier to students’ sense of safety, which was noted along several of observers’ worst rated bike and walk pathways within the environmental audit. Li and colleagues (2016) were able to display these results utilizing route maps within their study. Unfortunately, in the current study, the ability to do something similar was limited due to the nature of the university being integrated in an urban center, which could complicate the idea of what is city-owned versus university-owned property.
Results from the Campus Member Walkability Survey indicated that participants identify the campus built environment as one that naturally encourages physical activity with respect to walking, biking, jogging, and taking stairs. While this is a positive outcome, there is disconnect particularly among student respondents as they were significantly less likely to be familiar with the term walkability or to consider walking a form of physical activity compared with faculty and staff. These findings could provide context for the observed decrease in physical activity levels reported among students via the NCHA (2016) survey. If students do not consider walking to be a form of physical activity, they could be underreporting their individual activity levels.
Several of the findings from the campus member walkability survey were consistent with those observed by evaluators via the environmental scan audits as well as other previous studies (Horacek et al., 2018; Li et al., 2016). For example, Horacek et al. (2012) found that many post-secondary institutions scored poorly on campus path safety and quality for walking and biking. In this current study, almost half of survey participants felt that streetlights provided inadequate time to cross at many of the busy intersections within the campus environment, which was also observed by auditors who reported that nearly a third of routes did not allow sufficient time for pedestrians to cross. Auditors and survey participants, particularly faculty and staff, reported potential risk for pedestrians due to high-speed motor vehicle traffic, indicating a need for adequate pedestrian signage that is visible to vehicles (Pollack et al., 2014). Student respondents perceived that the sidewalks and paths available were continuous throughout the campus, another key finding indicated by the walking route audits. As well, half of students and three-quarters of faculty and staff indicated that walking paths and sidewalks throughout campus were relatively uneven, which was consistent with auditors’ ratings, and are therefore recommended for improving pedestrian safety (Veerman et al., 2016). Other positive characteristics of the campus infrastructure identified during the environmental scan, such as shading, lighting, cleanliness, and aesthetics, were also reported among the students, faculty, and staff survey respondents.
Pedestrian and vehicle traffic flow continuously evolve over time as the campus has recently expanded beyond one of the busiest streets in the metropolitan city. Dannenberg and colleagues (2005), in their evaluation of walkability to workplace agency campuses, found that almost all dangerous pathways noted were unsafe due in part to close proximity to vehicular traffic. As the campus environment broadens, an increasing number of its members are required to cross at one of several busy intersections to connect to the historically central part of campus. Plans for future expansion beyond the university’s current boundaries have been drafted, which has added concern in regard to the flow of students, faculty, and staff from future developed regions to central campus who will have to cross potential safety hazards such as roads, railroad tracks, and rivers within the city. Walkability of the university’s campus for future innovations and projects has become a priority among university facility members (Osama & Sayed, 2017). Plans include not only the addition of infrastructure such as crosswalks, pedestrian bridges, and signage but also maintaining any existing pedestrian infrastructure already present on campus. These improvements to existing infrastructure could possibly include the adaption of an existing walking path to have a pleasant walking loop, which may in turn make the path more attractive to students, faculty, and staff for recreational use (Dannenberg et al., 2005).
Many of the recommended enhancements to the campus infrastructure are related to maintenance, such as re-striping of crosswalks, installation of yield to pedestrian signage, cleanup of overgrown vegetation and debris, and resurfacing uneven sidewalks (Dannenberg et al., 2005; Mehdipanah et al., 2013). Other areas identified for improvement require more consideration during planning and development of new projects and renovations of campus facilities (Mehdipanah et al., 2013; Moloughney et al., 2014). Such projects should consider designating safe alternative walking routes for pedestrians when construction projects obstruct existing routes and how to effectively communicate these changes to the population (Moloughney et al., 2014). In addition, new construction requires forethought as to how installation will affect vehicle and pedestrian traffic flow beyond the immediate exterior of the facility so that new paths, crosswalks, or pedestrian signage are included in development plans (Stevenson et al., 2016). Ideally, these plans would include features that provide pedestrians with designated walking routes and bridges that avoid vehicle traffic to enhance safety while also not interrupting traffic flow through the city (Mehdipanah et al., 2013; Moloughney et al., 2014; Osama & Sayed, 2017; Stevenson et al., 2016; Veerman et al., 2016).
Based upon the findings in this study, it is recommended that this campus implement the same method of evaluation on a regular schedule in the future. The timing of intervals for this assessment could be dependent upon the magnitude of development projects taking place across the campus property. Walkability will be greatly affected by these projects as they create new spaces that will be frequented by students, faculty, and staff pedestrians, and potentially interrupt vehicle traffic flow, relocate commuter parking, or alter existing paths or sidewalks (Dannenberg et al., 2005; Mehdipanah et al., 2013; Moloughney et al., 2014). This research could also be furthered through partnership with other investigators to conduct quantitative data measurement of actual physical activity (e.g., steps taken) during a weeklong period and other physiological factors related to walkability and bikeability, such as campus members’ BMI, instead of relying on self-reported estimates from survey participants (Horacek et al., 2018).
Additional partnerships that are integral to understanding and improving issues related to campus walkability include university facilities and parking services. These two entities have key roles in the design and development of campus infrastructure, and thus, it is imperative to share these findings with them and include them in planning for future recommendations to improve campus walkability. Beyond the campus itself, it is also important to foster relationships with members of the city’s planning and development services, as the majority of the roadways are owned and operated by the city or state department of transportation (Mehdipanah et al., 2013; Moloughney et al., 2014; Stevenson et al., 2016). These partnerships will be vital when making improvements to the walkability of the campus environment, as such changes are ultimately connected to the larger metropolitan community and its resources for encouraging both campus and community members to be physically active (Moloughney et al., 2014; Stevenson et al., 2016).
Limitations
The current study had several limitations. First, the sample size of participants completing this initial walkability survey was low. A total of 83 participants completed surveys, of which only two were university faculty. Student employment was not noted at time of collecting data; however, all survey participants who were considered staff or faculty were full-time university employees. Consequently, this sample may not accurately represent the perceptions and beliefs of all faculty, staff, and students regarding walkability. Also, participants were recruited within the classroom or at the centrally located university farmers’ market, which attract more health-conscious individuals that differ from the general student body or average faculty or staff member.
In addition to limitations with the campus member survey sample, there were also restraints with respect to the environmental scans. Evaluators were not able to assess all walking routes throughout the university due to the size of the campus that spans of over 350 acres (University Current Enrollment and Demographic Information, 2018). However, audits focused on popular walking routes by students, faculty, and staff to evaluate walkability of the most critical areas of campus. Similar to the audits, the assessment tool used during the environmental scans did not capture all relevant attributes of walkability, such as type of walkway surface or incline of walking routes, but the tool does address diverse characteristics most pertinent to walking in a university setting. This initial study also focused on evaluating the overall walkability of the university, and therefore, specific scores for each route were not created as referred to in both Dannenberg et al. (2005) and Horacek et al. (2012). However, this is a measure that researchers see as beneficial to include in future evaluations to allow a comparison among the routes throughout the university, to note an overall change of a specified route from year to year, and to have a numerical comparison to similar research studies (Dannenberg, et al., 2005; Horacek et al., 2012).
Conclusion
After investigation of campus walkability, this study found that campus members’ perceptions parallel walkability characteristics observed in the campus environment and that elements of both may affect physical activity levels among university students, faculty, and staff. Further education of walking as a form of health-promoting physical activity is recommended to increase validity of self-reported physical activity data, particularly for university students. Creating awareness and promoting the walkability of the campus could be beneficial, as doing so may encourage students, faculty, and staff to engage in greater walking, which would help to increase their total minutes of moderate physical activity each week. Other future implications include working with university facilities and city partners so that these key organizations are included in projects fostering walkability, as well as implementing this study on a reoccurring basis to identify additional improvements that can benefit campus walkability and health for years to come.
Footnotes
Declaration of Conflicting Interests
The author(s) declared no potential conflicts of interest with respect to the research, authorship, and/or publication of this article.
Funding
The author(s) received no financial support for the research, authorship, and/or publication of this article.