
Abstract
The world is rapidly changing, and the systemic shifts have the potential to affect the nature of work. To prepare the workforce, it is crucial to develop the skills that will be necessary for the unpredictable landscape of the future. Before these skills can be developed, however, they have to be identified and quantified through some form of valuation. It is important that the approach to skills valuation is empirically defensible. This article presents an approach to skills valuation that focuses on the extent to which a skill facilitates occupational transitions as its measure of value. This valuation metric is then developed using a graph-theoretic approach. Results show that this valuation reflects skills-importance that aligns with existing skills valuation in the literature. Limitations of this approach and its potential extensions are discussed.
Keywords
Background
Studies that look at recent and predicted changes in the jobs landscape have consistently shown that disruptive changes are coming—ranging from a shift in skillsets that can adapt to changing work environments and demographics, to potential industry-level disruptions due to large-scale adoption of technology (such as artificial intelligence [AI], deep machine learning, and automation/robotics). In particular, the Future of Jobs Report published by the World Economic Forum (WEF, 2016) suggests that skills that are increasingly going to be important in the next 5 to 10 years will almost exclusively be those classified as “21st century skills” by various frameworks (e.g., Dede, 2010; Organisation for Economic Co-operation and Development [OECD], 2008; Partnership for 21st Century Skills, 2009; United Nations Educational, Scientific and Cultural Organization [UNESCO], 2015). The term “21st century skills” (21CS, also called transferable/transversal or cross-functional/cross-cutting skills) is an umbrella term that encompasses a broad range of skill sets and competencies, such as critical thinking and problem-solving skills, that are deemed important in the current century (Ercikan & Oliveri, 2016; Rotherham & Willingham, 2010). These skills continue to gain attention and importance in the current and future educational environment, and yet education systems are only just beginning to formalize the frameworks for the teaching and learning of these skills (Care et al., 2019).
Although there is consensus across all sectors that these 21CS are important, there are serious logistical considerations that need to be taken into account before a systems-level adoption can be formalized. As an umbrella term, 21CS encompasses a very broad set that, depending on the framework, can include over two dozen distinct skills (e.g., National Center for O*NET Development, 2019a; UNESCO, 2015). Teaching any one skill to an entire student population requires substantial educational expenditure. If countries decide to embed these to their curriculum, the selection of which ones to focus on has to have empirical support based on some quantifiable metric of “value.”
The first step toward systems-level adoption and formalization of these skills is to identify which ones are most relevant for a specific context. Global reports such as the WEF report are useful in providing broad high-level overview of what skills are important across industries. However, there is currently no empirical study that provides data-driven evidence on what skills are currently important and will be important as students transition into the workforce in the near future. Another limitation of most global studies is that, due in part to their scope and to logistical constraints, they are mainly based on opinion-poll types of survey data.
Survey methods show what skills are needed now (current demand) or what the survey respondents think will be needed in the foreseeable future (perceived future demand). More sophisticated large-scale data mining approaches such as keyword and text analysis provide more comprehensive and quantifiable results, but these are still based on current demand. In the case of the New Foundational Skills of the Digital Economy report (Burning Glass Technologies & Business-Higher Education Forum [BHEF], 2019), the findings were based from hundreds of millions of job postings going back to 2007 and thus providing a picture of both current demand and short-term trends. Analytical approaches that look at trends in (aggregated) skill demands based on systemic shifts in occupations and entire industries, particularly the work by Autor et al. (2003), are very useful in examining the impact of disruptive forces on these trends. Technology (computerization specifically in the Autor et al. paper), as well as geopolitical, environmental, and other global forces can play disruptive roles these shifts that in turn impact what skills will be prioritized. All these research approaches help move the skills debate forward, but there is a gap in research that this article aims to fill. In a fast-moving world, using past and current data to focus on trends (either on the demand or supply sides) limits our knowledge of whether the skills that are prioritized now will remain to be prioritized 10 years from now.
If we are to project future demands and priorities, we have to focus on flexible and transferable skills. Although this will still be limited because we cannot predict what future occupations the skills need to transfer into, an exhaustive approach can mitigate this limitation. By exhaustively analyzing the most transferable skills with respect to all possible current transfers (or occupational transitions in the context of future workforce trends), and assuming that not all occupations now will be obsolete or drastically altered, the commonalities should reasonably be maintained. In addition, focusing on skills that are less dependent on specialized knowledge, and more cross-cutting when it comes to learning domains, reduces the chance that what we consider as common given our current data become obsolete or irrelevant in the foreseeable future.
This article aims to complement the approaches described above and demonstrates a method that aims to provide quantitative data on what skills are required now as students transition into the workforce, and what skills will allow them to be more flexible in the fast-changing work environments in the next decade. To do this, the method introduced in this article involves the development of a skills metric that objectively quantifies skill “value,” not just for specific occupations but also taking into account the possible trajectories as workers transition into different occupations within the broad field. This means that the metric measures which skills are important in a given field (e.g., Engineering as demonstrated in this article) but also how important each skill is in enabling transitions between different occupations within this field. Existing research approaches conceptualize the valuation of skills based on their importance (however this is measured) to as many perceived “occupations of the future” as possible (however, this set of future occupations is defined). In contrast, the approach presented in this article values skills based on the degree to which a skill facilitates transition across a landscape of occupations, where occupations and their interrelationships are viewed as a network in a graph-theoretic perspective. This interpretation of value as a function of transferability is in line with international frameworks for key competencies that focus on such transferable (or transversal) skills. The European Commission (2018), OECD (2008), and UNESCO (2015) all focus on competencies that are transferable in nature, whether with respect to occupation transition (i.e., transferred from one job to another) or modality of learning (i.e., learned/developed in one context and applied in another).
We quantify this valuation using a networks-based skills metric that is a ratio-level measure (i.e., an interval scale with a meaningful zero value, thus allowing for meaningful comparisons of ratios). This ratio-level measure of magnitude is in contrast to valuation metrics that are mainly rankings (common in previous studies that look at potential top skills for the future). For developing countries with limited resources in their educational systems, an objectively quantifiable metric of skill importance will allow policy makers to focus on 21st-century skills that have more “bang for the buck” given a particular context—for example, countries might want to focus on some key industries where they have comparative advantage (Hunt & Morgan, 1995). Having a quantitative metric that represents magnitudes is important for national policy makers and system-level stakeholders because it will enable targeted and efficient allocation of resources as well as inform evidence-based policy. There is no doubt that the ever-increasing role of technology on the nature of work and the socioeconomic implications of globalization will continue to shape the future workforce. These drivers of change, in turn, will have profound effects on the skills that will be needed as the workforce landscape continues to evolve. Objectively quantifiable metrics for the “value” of skills can help policy makers navigate this fast-changing workforce landscape and focus resources to ensure that future workers are equipped with skills that provide an optimal chance of thriving in an unpredictable work environment of the future.
Concept
The idea of the “transferability-valuation” of skills metric is based on the concept of network connections where the transition from one state to the next is viewed as a “path” between two nodes. The nodes represent the states (a “state” in this case is a job or occupation), and the path is represented by a line that connects them. In Figure 1, the transition from being a recent graduate entering the workforce is represented by various paths for each potential job target.
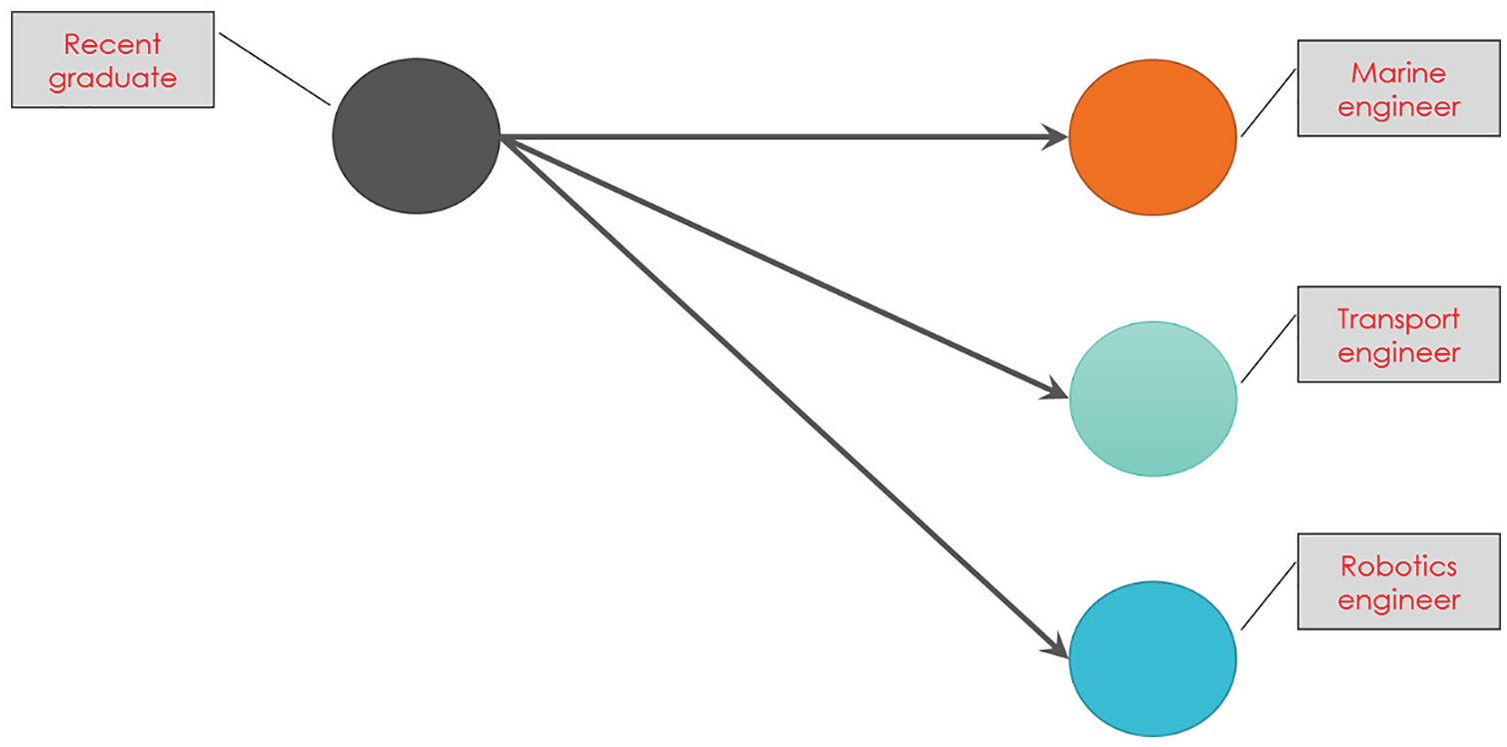
Visualization of transition from a recent graduate to various engineering jobs.
In each of these potential transitions, the relevant skills that help make a transition possible can also be modeled as a node that sits between each occupational transition (e.g., the three skills in Figure 2). Because some skills may be more important that others depending on the situation, the mapping can also incorporate the extent to which each skill contributes to the transition. For example, Figure 2 visualizes the different levels of contribution of three skills (critical thinking, problem solving, and communication; represented as size and shade of the symbols for each skill) in the transition from a recent graduate into a marine engineer.
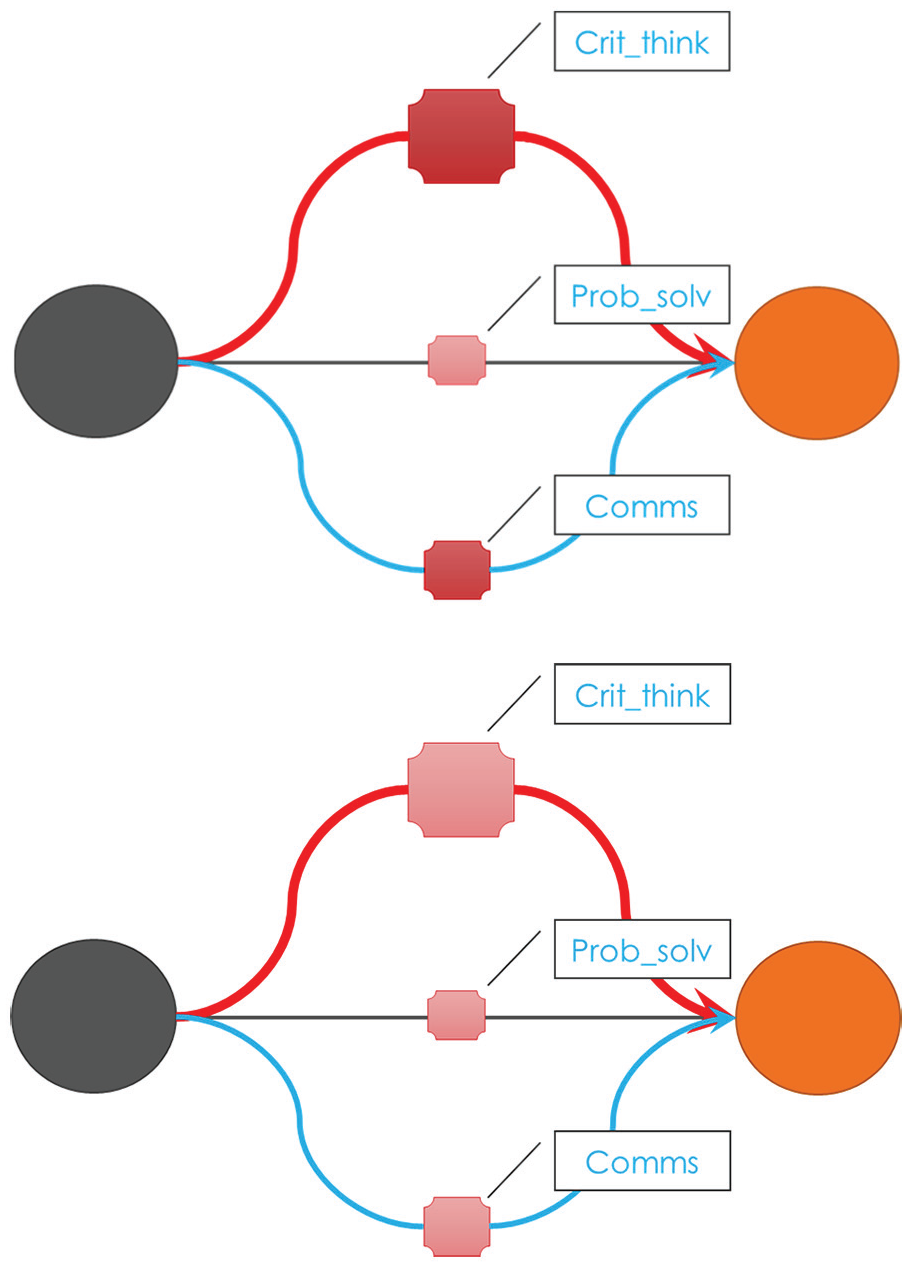
Visualization of various skills required, and their respective levels of contribution, in the transition from one job to another.
All the “paths” within a given context (e.g., for a given field of occupation, for a country, or for an industry) can then be built into a network that models all transitions, not just for new graduates but also for those transitioning between jobs (see Figure 3) and include all the skills involved in each transition. Finally, each transition can be mapped separately by using directional paths. That is, a transition from job A to B is modeled as separate from a transition from B to A. This also allows the network to specify one-way transitions (e.g., no transition from a marine engineer to a recent graduate).

Visualization of a network representing multiple transitions and multiple skills required for each transition.
Method
Data
Occupation data and linked skills were extracted from the O*Net version 23.2 Database (National Center for O*NET Development, 2019b). The O*Net database contains regularly updated information on nearly a thousand detailed occupations in the United States, categorized into 23 major occupation groups, structured according to the 2018 Standard Occupational Classification (SOC; U.S. Bureau of Labor Statistics, 2018).
The SOC structure classifies all occupations in the United States and categorizes the occupations under hierarchical levels of aggregation (see U.S. Bureau of Labor Statistics, 2018). For this article, Architecture and Engineering Occupations (hereafter referred to as the AEO group) was chosen as a major group (SOC category 17-XXXX) in the main analysis. Under this broad category, 70 detailed occupations were included. For a parallel analysis, two additional data sets were constructed: The Social Sciences Occupations (SSO group; SOC category 19-30XX) with 16 detailed occupations included in this category, and the Production Occupations (PO group; SOC category 51-XXXX) with 96 detailed occupations. The SOC has an intermediate and higher-level aggregations. The two data sets for the parallel analysis were chosen such that SSO is aggregated with the AEO occupation group for the main analysis (both are in an intermediate aggregation of Computer, Engineering, and Science Occupations), whereas PO is aggregated separately in both the intermediate and higher-level aggregations (see Tables 5–6 in U.S. Bureau of Labor Statistics, 2018).
The set of skills included in the analysis were taken from the list of skills and abilities from O*Net data. As the relevant skill set depends on occupation, one of the skills for the AEO group, selective attention, was replaced with written expression and manual dexterity for SSO and PO groups, respectively. For all occupation groups, there is one selected skill that is unique to each group. The skills and their O*Net descriptions (National Center for O*NET Development, 2019a) are listed below:
Complex problem solving—Identifying complex problems and reviewing related information to develop and evaluate options and implement solutions.
Critical thinking—Using logic and reasoning to identify the strengths and weaknesses of alternative solutions, conclusions, or approaches to problems.
Flexibility of closure—The ability to identify or detect a known pattern (a figure, object, word, or sound) that is hidden in other distracting material.
Fluency of ideas—The ability to come up with a number of ideas about a topic (the number of ideas is important, not their quality, correctness, or creativity).
Judgment and decision making—Considering the relative costs and benefits of potential actions to choose the most appropriate one.
Manual dexterity (POs only)—The ability to quickly move your hand, your hand together with your arm, or your two hands to grasp, manipulate, or assemble objects.
Negotiation—Bringing others together and trying to reconcile differences.
Problem sensitivity—The ability to tell when something is wrong or is likely to go wrong. It does not involve solving the problem, only recognizing there is a problem.
Selective attention (Engineers only)—The ability to concentrate on a task over a period of time without being distracted.
Social perceptiveness—Being aware of others’ reactions and understanding why they react as they do.
Visualization—The ability to imagine how something will look after it is moved around or when its parts are moved or rearranged.
Written expression (SSOs only)—The ability to communicate information and ideas in writing so others will understand.
For the first analysis, there were 16,848 pairwise permutations of 70 AEOs across 10 skills. These permutations represent all possible pairwise occupational transitions that are modeled as basis for the main network analysis.
Table 1 shows a sample of 10 pairwise permutations (out of 16,848). Each row shows a transition from one occupation to another, across all the 10 skills for the AEO group. These transition pathways are filtered to exclude those where the rated importance of the skill for either the source and target occupations is less than 3 on a 1 to 5 scale defined by O*Net as 1 = not important, 3 = important, 5 = extremely important (see National Center for O*NET Development, 2012, for details on the ranking process).
All Pairwise Permutations of Occupational Transitions for the AEO Group.

Note. AEO = architecture and engineering occupations.
This has the effect of filtering pathways that involve less important skills for any particular transition. All occupations in the PO group have an importance value on negotiation that is less than 3; therefore, this skill was not included in the analysis for the PO group. A weight is then calculated to represent the ease of transition from source to target for any particular skill. This weight is simply the difference in skill importance between the source and target.
The idea is that for any given path, the transition from an occupation that places greater importance on a particular skill to another occupation that places less importance on that skill will be comparatively easier than the other way around because little or no upskilling will be needed. This weight is then scaled so that the minimum weight is 1. This is visualized in Figure 4 using as an example the transition from Mechatronics Engineer to an Energy Engineer shown in the first three rows of Table 1. In the network analysis, this weight acts as an edge weight and contributes to the occupation pair’s link strength in the context of a weighted network (Opsahl et al., 2010).

Visualization of a specific transition, where path thickness represents edge weight in a weighted network.
For the second analysis, there were 1,346 pairwise permutations of 16 SSOs across 10 skills and 10,404 pairwise permutations of 96 POs across nine skills. This analysis was done in parallel with the data kept separate because we are interested in transitions exclusively within the broad occupation groups. Research suggests that transitions are more likely for similar occupations (WEF, 2018). It is possible, and indeed has been observed, that workers transition from being an engineer to a sociologist but it is not common.
There is also a technical purpose for computing the centrality metrics for each of the occupational groups separately. Had the data been combined, the interpretation of the betweenness values would be confounded by the characteristics of the particular occupational networks. If one network has stronger characteristics, such as having more centralized nodes and stronger links among its nodes, the ranking of the betweenness metric in such a combined data set would be overrepresentative of that network. However, the more important substantive purpose of the second parallel analysis is to show differences in skill centrality within specific domains while also informing which skills may be cross-cutting by being central in more than one domain even if the computation of the centrality metrics was done independently.
Analytical Approach
As discussed in the “Concept” section, the combined possible paths that individuals can take as they move from one occupation to another can be modeled as a network where occupations are represented as nodes or vertices and the transition represented as edges in a directed graph. A directed graph is simply one where the connections (or edges) specify a direction. Directional paths are important for our purposes because they model the temporal order of the transition—the transition from one occupation to another. Using graph theory, various centrality metrics can be computed for elements of a network as well as for its overall structure (Borgatti & Everett, 2006). A particular metric that is relevant for the purposes of quantifying which skills enable the most efficient transition between any two occupations is the betweenness centrality metric (Freeman, 1977, 1978), defined as follows:

where σ st is the total shortest paths from any node pair s and t, σ st (v) is the number of shortest paths that pass through v, and the betweenness metric g(v) for node v is the sum of all the ratios.
The distance between node pairs that are directly connected (i.e., the pairs are adjacent, with no intervening node/s) is set to 1, and the shortest path between any node pair (s, t) is the smallest sum of all directly connected paths from s to t:

where ai is an adjacent node in the node pair. Note that because we are dealing with directed graphs, the existence of a path from directly connected nodes in one direction does not guarantee the reverse direction. Thus, d(s, t) may not be equal to d(t, s).
To enable the computation of betweenness centrality for the skills, every skill that is relevant in a transition is modeled as a node that always sits between the two transitioning occupations (see, for example, Figure 2). A skill node with a betweenness metric value of 0 therefore means that no shortest path passes through it, implying that the skill is not important for all transitions in the network. The metric is then normalized such that the range of values is scaled to g(v) ϵ [0 − 1]. The value of the metric is directly proportional to its importance in transitions because higher values indicate more paths passes through it.
To illustrate how betweenness centrality is computed in a simple undirected graph, Vertices 2 and 4 in Figure 5 have the following (non-normalized) centrality values:
Betweenness for Vertex 2
Node pair (1,4): σ1,4 = 2, σ1,4(2) = 1
Node pair (1,5): σ1,5 = 2, σ1,5(2) = 1
Node pair (1,6): σ1,6 = 2, σ1,6(2) = 1
g(2) = ½ + ½ + ½ = 1.5
Betweenness for Vertex 4
Node pair (2,5): σ2,5 = 1, σ2,5(4) = 1
Node pair (3,5): σ3,5 = 1, σ3,5(4) = 1
Node pair (1,5): σ1,5 = 2, σ1,5(4) = 2
Node pair (1,6): σ1,6 = 2, σ1,6(4) = 2
Node pair (2,6): σ2,6 = 1, σ2,6(4) = 1
Node pair (3,6): σ3,6 = 1, σ3,6(4) = 1
Node pair (5,6): σ5,6 = 1, σ5,6(4) = 1
g(4) = 1 + 1 + 2/2 + 2/2 + 1 + 1 + 1 = 7

Sample network.
In an unweighted network, the definition of “shortest path” or distance between any two nodes is just a simple count of direct paths between them, and the binary shortest distance between two directly connected nodes is 1 (e.g., the shortest path between Vertices 5 and 1 in Figure 5 is equal to 3). Intuitively, it makes sense that Vertex 4 has a higher centrality value than Vertex 2 simply because more connections between all possible pairs of nodes pass through it, as can be seen in Figure 5.
Because we are using a weighted network and the weights are scaled to be ≥1, thereby dweighted(s, t) ≥ d(s, t), the computation of the shortest path is changed to where the edge weights are taken into account, such as incorporating the reciprocals (or multiplicative inverses) of the weights into the computation of shortest paths (Newman, 2001). This modification can then be applied as a variation to the betweenness centrality computation (Brandes, 2008):

The details of the algorithm for computing betweenness centrality in weighted networks is beyond the scope of this article (for more details, see Brandes, 2001; Opsahl et al., 2010), but the effect of the weights on networks is that the distance between strongly connected nodes (i.e., where the weights are greater) becomes comparatively shorter and thereby lessening the “cost” of traversing such path (Brandes, 2008).
The substantive implication, for the purposes of this article, is that the paths with lower costs of traversing effectively increase the betweenness centrality of nodes that these paths pass through. Using Figure 4 as an example, judgment becomes a more central skill in the transition from Mechatronics Engineer to an Energy Engineer because the path that requires judgment is the least costly to traverse.
All data preparation and analyses were conducted within the R environment (R Core Team, 2018). The igraph package (Csardi & Nepusz, 2006) was used to generate the directed graph and compute the betwenness centrality metric for the skills.
Results
The results show that the top skills based on their betweenness centrality reflect what would be generally considered important skills for the particular group of occupations (Tables 2–4). However, the results provide information beyond “importance.” Because the betweenness centrality metric is a medial measure (Borgatti & Everett, 2006) that focuses on the number of shortest path connections that pass through a node, the skills with the highest values can be interpreted as skills that enable the most efficient transition between any pair of occupations within the occupation group. For the AEO group, it is not surprising that problem sensitivity and visualization are the top skills that are not just important per se but would enable anyone with an occupation in this group to transition to another occupation with the least “transition cost” as well have as the most options for target occupations.
Ranked Betweenness Centrality for the AEO Group.

Note. AEO = architecture and engineering occupations.
Ranked Betweenness Centrality for the SSO Group.
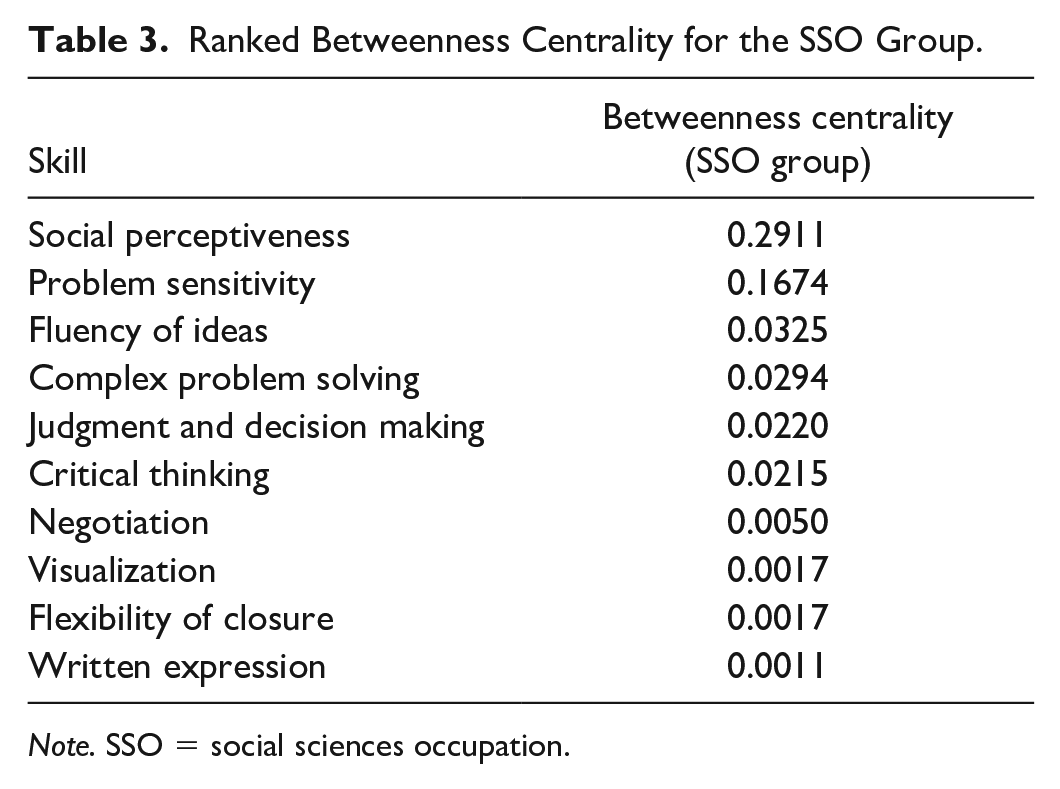
Note. SSO = social sciences occupation.
Ranked Betweenness Centrality for the PO Group.
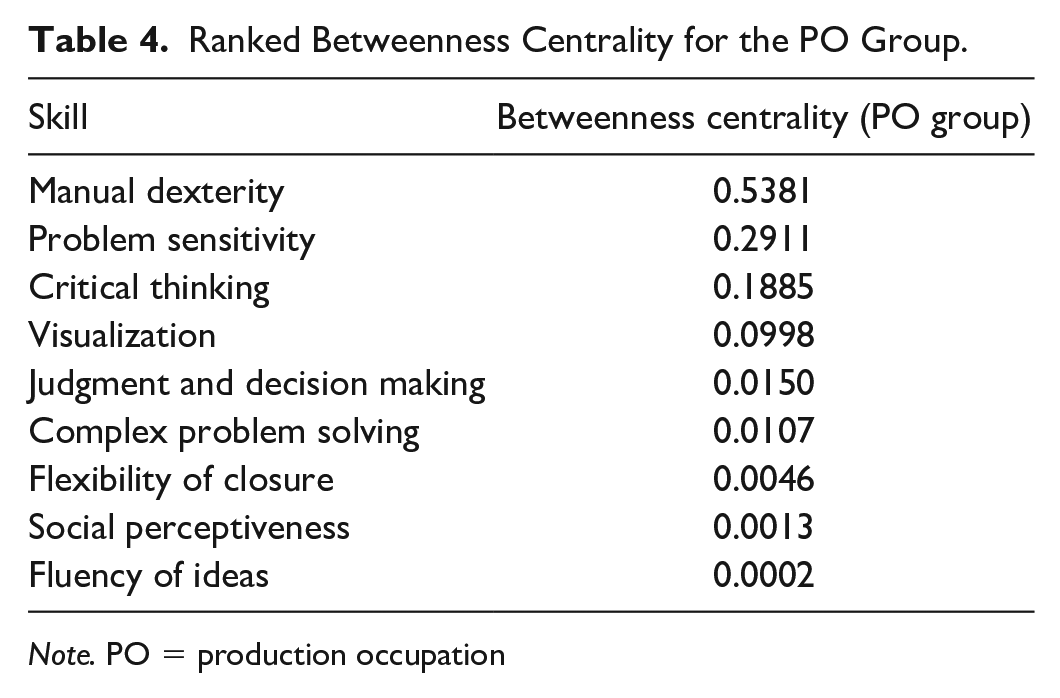
Note. PO = production occupation
The metric is a ratio therefore magnitudes are directly comparable within each occupation group (e.g., visualization is more than 2.5 times as central as fluency of ideas in the AEO group). However, because the metric is dependent on the generated network, and both networks are independent, only the order (and not the values) can be compared across the occupation groups. The comparisons across the occupation groups are summarized in Table 5. Note that the AEO and SSO groups share a higher aggregation level, and thus it is not surprising that the ranking of skills based on betweenness centrality shares some commonalities (six of the nine possible; indicated by a superscript A) between them.
Comparison of Skill Rankings Across Broad Occupation Groups.

Note. AEO = architecture and engineering occupations; SSO = social sciences occupation; PO = production occupation; A = rank difference between AEO and SSO ≤ 2; B = rank difference between SSO and PO ≤ 2; C = rank difference between AEO and PO ≤ 2; W = included in the top 10 skills in the World Economic Forum (2016) report; F = included in the 14 new foundational skills in the Burning Glass Technologies and Business-Higher Education Forum (2019) report.
Skills that are conventionally associated to an occupation group also tend to be the most central skill and have rankings that are different from the other occupation groups. It is expected that engineers need good visualization skills, but not as much for social scientists. It also makes sense that social perceptiveness is very central for social scientists in the same way that manual dexterity is very central to those working in production jobs. While the PO group is in a different aggregation level than the AEO group, production and engineering occupations share common tasks, which is reflected in the results showing that 75% of common skills have close ranking similarities between them (indicated by a superscript C), whereas only four skills share close ranking similarities between the SSO and PO groups (out of the eight possible, indicated by a superscript B).
Table 5 also shows the commonalities across the WEF and Burning Glass/BHEF reports. Both reports provide a metric for “value” that is different from the metric based on betweenness centrality; thus, the commonality across the rankings based on both metrics offers additional support for a more universal interpretation of “value” for some skills such as critical thinking, judgment and decision making, fluency of ideas, and complex problem solving.
Discussion
There is a long history of work in the literature on how systemic shifts affect skills valuation in terms of industry demand or occupational requirements (Acemoglu, 1998; Berman et al., 1998; Bughin et al., 2018; Levy & Murnane, 2005). As a consequence, those in the educational community have realized the importance of preparing the future workforce and are developing internationally accepted frameworks that drive toward a consensus on a handful of skills that are deemed key to the future (Dede, 2010; Rychen & Salganik, 2003). Empirically defensible skills valuation is therefore of critical importance. This article investigates this valuation of skills using a large-scale data-driven approach. Our results show that an alternative interpretation of value can be defined as facilitating transitions in an unpredictable landscape. This interpretation yields a “transferability-valuation” of skills that focus on quantifying the smoothest/best transition between the most number of occupation pairs.
We discuss the results by first comparing this type of valuation with those based on broad opinion-based approaches. Table 5 shows that there is close alignment with our approach and the finding from WEF (2016) and Burning Glass/BHEF, even if both the WEF and Burning Glass/BHEF reports aggregate the skills over a broad field. This shows that certain skills—critical thinking, judgment and decision making, complex problem solving—remain highly valued even across different interpretations of value.
Looking more closely within occupation groups, results show that skill valuation depends on the characteristics of the field linked with each occupation group. This finding is highlighted by the differences in ranking for skills that are contextually linked to each occupation group in the analysis—thus social perceptiveness has the highest “transferability-value” among social scientist, whereas manual dexterity ranks highest for occupations that involve production (e.g., manufacturing, assembling, and fabrication jobs). Occupation groups that share a higher aggregation level also share skills that are ranked similarly compared with an occupation group that is on a different field. This finding is important because it shows that even when skills are considered domain-independent in terms of knowledge content requirements, the value of these skills (whether ranked by importance or by transferability) may be domain-specific while some may indeed be cross-cutting. Our results provide empirical support of this case, and these results highlight the importance of quantifying “value” in context, such as with regard to broad occupation groups as this article has shown.
Cross-cutting skills lose a bit of their advantage when the transition is constrained within a field. For example, both judgment and decision making and complex problem solving are cross-cutting, but they do not have the highest “transferability-value” within their occupation groups. However, cross-cutting skills are more advantageous to have if workers move across fields. They are also more flexible for the future, when unpredictable fields may arise/emerge.
The only skill that is both cross-cutting and has very high “transferability-value” within every occupation group is problem sensitivity. Problem sensitivity is a narrow skill and can be considered a component of problem solving (Schoenfeld, 1980) which is itself a subset of complex problem solving—although not a strict subset as it also shares components of critical thinking such as metacognitive knowing (Kuhn, 1999; Sternberg, 1986) and inductive reasoning (Vaughn, 2008). Problem sensitivity also overlaps with knowledge-acquisition components in Sternberg’s (1986) taxonomy of critical thinking because it requires relating previously known information (often obtained through experience in an occupational context) to new situations, which is why experienced workers seem to have this sensitivity at an instinctive level.
An advantage of using a ratio-level centrality metric is that the cross-cutting characteristic of each skill can be examined in more detail. While the rankings show that problem sensitivity is cross-cutting, the magnitude of betweenness centrality varies substantially across the occupation groups. Problem sensitivity is much more central in AEO group, more than an order of magnitude than the rest of the skills in the set, whereas it is closer to the third-ranked skill than it is to the top skill in the PO group. Interestingly, in the SSO group, both it and the top-ranked skill are much more central than the rest of the skills in that group, similar (but not as large in terms of magnitude) to how the centrality values are distributed in the AEO group—perhaps explained by the similarities of both occupation groups, at least according to SOC structure (U.S. Bureau of Labor Statistics, 2018).
This article’s data-driven approach to skills valuation can be useful in both occupation-specific and higher-level contexts, enabling a more comprehensive quantification of skills value beyond rankings. A large-scale workforce skills survey by the McKinsey Global Institute found that one of the main concerns of business leaders is that their workers may not be adaptable enough and hampering retraining and redeployment as firms build their workforce of the future (Bughin et al., 2018). Specific industries can apply this approach toward targeted and efficient allocation of resources for re-skilling or upskilling within their scope (e.g., as discussed in WEF, 2018) by helping identify which skills are most transferable within specific industry or even firm-level contexts. Provided the underlying data exist, the approach can be made as specific/localized as possible and applied to any contexts (e.g., occupational groups, industry, geographic area, demographic category) as well as multiple contexts simultaneously. At a higher level, decision makers can adopt this approach to inform evidence-based policies on preparing the future workforce across the entire system.
Extensions to Future Work and Limitations
In a graph-theoretic framework, there are centrality metrics that focus more on the frequency of connections regardless of whether these connections facilitate links to as much of the rest of the network as possible. These centrality metrics are radial, in contrast to the medial betweenness centrality, and could be used to empirically verify survey-based findings as well as support data-driven frequency-based research (e.g., the approach taken by Burning Glass Technologies & BHEF, 2019). The simplest radial metric, degree centrality, is just a count of all connections from a given node, which directly corresponds to the quantification of importance based on frequencies or relative standing (Everett & Borgatti, 1999). Radial centrality metrics therefore measure the importance or influence of a node in the same manner as how “importance” is conveyed in the most frequently requested skills in millions of job postings.
More sophisticated metrics such as the authority score developed by Kleinberg (1999) and the related eigenvector centrality (Bonacich, 1972) are particularly useful. Both metrics take into account not just the number of connections but also the influence of those connections in turn, thereby extending the concept of influence by also taking into account the “quality” of the connections (Kleinberg, 1999). It would be of interest if the eigenvector centrality and/or authority score values align with the ranking of skills from the WEF (2016) and the Burning Glass Technologies and BHEF (2019) reports.
Future work based on similar graph-theoretic approaches will share the same limitations of this current work. The robustness of the findings is inherently linked with the extent to which the raw data from O*Net and the methodology of the underlying the data collection process are also robust. There is no reason to doubt the quality of O*Net data, given that both the data sets and methodologies have extensive history of research over the years. The skills and their importance were classified and rated subjectively, but the rating process was systematic and involves highly trained analysts with domain expertise (see National Center for O*NET Development, 2012). Nevertheless, the assignment of skills to occupations and the rating of importance have direct impact on the results of this analysis and thus constitute a limitation of this article.
It would be of interest to the research community if this approach is replicated using other SOC schemes, although it might be a challenge to find national-level data sets that are as comprehensive as O*Net. For example, the United Kingdom SOC (Office for National Statistics, 2010) only has corresponding skill level but not skill category requirements, whereas the Australian SOC (Australian Bureau of Statistics, 2013) only has task and specialization requirements for the classified occupations. There are recent initiatives to expand other national SOC schemes (e.g., Djumalieva et al., 2018) so future research on this area can use these expanded SOC schemes.
Footnotes
Declaration of Conflicting Interests
The author(s) declared no potential conflicts of interest with respect to the research, authorship, and/or publication of this article.
Funding
The author(s) received no financial support for the research, authorship, and/or publication of this article.