
Abstract
This study evaluates the relative effects of economic growth, industrial expansion, and firm-specific and contextual factors on corporate hotel performance in Sri Lanka. We use data from a sample of 29 listed hotels for 7 years from 2012 to 2018 and employ panel regression to uncover the relationship that exists between these variables. The findings suggest that the macroeconomic factors alone can account for a small part of the variance in return on assets and return on equity, and yet that these macroeconomic factors are the key drivers of the overall financial performance. Moreover, the selected macroeconomic factors, together with firm-specific and contextual factors, appear to have a profound impact on hotel performance. More specifically, growth in the number of tourist arrivals and growth in inflation are found to have a positive and significant impact on corporate hotel performance, while the interest rate has a significantly negative effect. Our findings with regard to the impact of growth in gross domestic product (GDP) on hotel performance are inconclusive. Furthermore, our findings reveal that the profitability of Sri Lankan hotels is driven by managerial efficiency, location factors, geographical diversification, and connection to a wider business network.
Introduction
The hotel industry, as a multi-sectoral industry, relies heavily on the state of the economy (M.-H. Chen, 2010). In other words, the behavior of the economy and the industry (i.e., whether they are in contraction or expansion) are closely tied to the hotel performance. In addition, the existing tourism literature suggests that certain contextual and hotel-specific factors also have a profound impact on hotels’ success (Aissa & Goaied, 2016; Al-Najjar, 2013; M.-H. Chen, 2010; Sami & Mohamed, 2014). Studies on hotel performance suggest that an expansion in the tourism industry, with increased numbers of tourist arrivals and higher foreign exchange revenue, enables businesses to generate more revenue and income and sustain financial performance (FP; M.-H. Chen, 2010). The existing studies have also revealed that economic growth and growth in the tourism industry are interrelated. That is, an improved economic environment creates a favorable environment for tourists and thus increases the number of tourist arrivals, which, in turn, boosts the economic growth through foreign exchange earnings (H. J. Kim et al., 2006). However, the existing studies have failed to differentiate between the effects of economic, industry, and hotel-specific factors on corporate hotel performance. Also, limited attention has been given to examine the impact of the macroeconomic conditions on the overall performance of the hotel industry. Consequently, it is questionable whether economic growth and expansion in tourism necessarily lead to higher firm performance. For example, despite robust growth in the tourism industry in Sri Lanka during the last 8 years, a number of corporate hotels have continually reported losses over those years (see Table 1). Therefore, it is important to understand the relative importance of macro- and micro-factors for hotel performance.
Performance of Corporate Hotels 2012–2018 and Formation of the Final Sample.

Current tourism literature has also paid scant attention to the macro-level and micro-level determinants of corporate hotel performance in developing and less-developed countries. Most previous studies are based primarily on developed economies (Chu, 2014). This, therefore, increases our concern about the generalizability of the existing findings. M.-H. Chen (2010) further claimed that the growth in gross domestic product (GDP) and the growth in international tourist arrivals could account for a relatively smaller proportion of the overall hotel performance in Taiwan. M.-H. Chen (2010) also indicated that there are unexplored variables that may affect hotel performance, such as service quality, ratings, brand affiliation, managerial efficiency, and productivity. In addition, earlier studies that looked at the effects of firm-specific and macroeconomic factors on performance in the hotel sector have often considered return on assets (ROA) and return on equity (ROE) as the indicators of FP. However, it is debatable whether these conventional performance metrics alone can reflect the true performance (Hsu, 2013). Previous studies thus suffer from the lack of a systematic evaluation of the overall performance of hotels and the determinants of this performance. In addition, there is a lack of studies that examine the integrated effect of hotel-specific and macro-factors on corporate hotel performance. This research, therefore, aims to expand the literature with an in-depth analysis of the economic, industry, hotel-specific, and contextual factors that may affect corporate hotel performance.
This study, therefore, contributes to the tourism literature in several ways. First, it is different from others in the field, as it carries out a comprehensive evaluation of the micro- and macro-determinants of corporate hotel performance, focusing on the relative effect of each of those variables. This study incorporates into the analysis various determinants relating to the hotel industry, such as economic, industry, firm-specific, and contextual determinants. The study provides new insights by showing that the impact of economic and industry factors is more pronounced in overall FP, while firm-specific and contextual factors are more evident in determining corporate hotels’ profitability (i.e., ROA, ROE). Second, the present study adopts a sound methodological approach that is enriched by and grounded on prior studies, including those of M.-H. Chen (2010) and others (Kaynak et al., 2017; Kumar, 2016). In particular, the study selects five accounting ratios (namely, ROA, return on capital employed [ROCE], asset growth, revenue growth, and current ratio) following a factor analysis. These selected accounting ratios are then systematically combined to develop a composite indicator for FP. Moreover, entropy-based technique for order performance by similarity to ideal solution (TOPSIS), a multicriteria decision-making approach, is employed to obtain the comprehensive performance score. Beyond the above contributions, our study provides new insights and has managerial and policy implications.
Literature Review and Hypotheses Development
The Effect of Macroeconomic Factors on Corporate Performance
System theory offers an appropriate theoretical underpinning to explain the interrelation between the behavior of macroeconomic factors and corporate performance (Egbunike & Okerekeoti, 2018). Firms, as open systems, continuously interact with the external environment and thus performance is affected. From this perspective, many studies have examined the effect of macroeconomic factors on firm performance in the banking, finance industries, and insurance industry (Athanasoglou et al., 2005; Otambo, 2016; Owoputi et al., 2014; Sheaba, 2017; Vong & Chan, 2009), and manufacturing industry (Egbunike & Okerekeoti, 2018; Imoughele & Ehikioya, 2014). Most of these studies have examined the relationship between economic growth and firm performance. However, the direction and the strength of the relationship remain inconclusive.
Concerning the hotel industry, hotel performance is affected by numerous factors, not just the macroeconomic cycle but also market behavior, political instability, environmental disasters, terrorist attacks, and disease outbreaks (Oaten et al., 2015). As consumer spending on hotel accommodation is directly related to GDP performance, economic recessions generally have severe and lasting impacts on the hotel industry. The performance of the hotel industry is affected by economic downturns, from both an operating and a development viewpoint, as it decreases consumer demand and capital expenditure (M.-H. Chen, 2010). On the contrary, economic expansion improves the spending power of corporate and leisure customers, thus boosting demand for the hotel sector (Oaten et al., 2015). Consequently, economic growth and recession both seem to have a significant impact on performance in the hospitality industry.
M.-H. Chen (2010) investigated the impact of economic and tourism growth on the performance of Taiwanese tourist hotels. He revealed that real GDP growth and increase in the number of foreign tourist arrivals have a positive and significant impact on the occupancy rate of Taiwanese tourist hotels. His study, however, did not find any significant impact of economic factors on hotel performance (measured as ROA and ROE). Another study carried out by Chen M.-H. (2015) found a positive relationship between growth in the inbound tourism market and growth in sales by hotel companies in Taiwan. Moreover, the quantile regression tests conducted in his study revealed that the growth in the number of foreign tourist arrivals had a significant impact on the growth in sales at the different quantiles of growth in sales, which was not found in the ordinary least squares (OLS) regression. M.-H. Chen (2007a, 2007b) has also revealed that there is a long-term link between the stock performance of tourism firms and economic conditions in China and Taiwan.
Although much of the tourism literature has included GDP as a macroeconomic variable when investigating the effect of the economy on the FP of hotel companies, limited attention has been given to the effect of other macroeconomic variables, such as inflation and real interest rate, on the FP of hotel companies. Barrows and Naka (1994) examined the influence of five macroeconomic variables, including inflation and the term structure of interest rates, on the stock performance of the restaurant, lodging and industrial sectors, in the United States. They revealed that expected inflation rate, money supply, and domestic consumption had a statistically significant effect. Moreover, their results indicated that there is a negative relationship between the expected inflation rate and stock returns in the restaurant industry. They argued that this negative relationship is the result of a general movement of investment into bonds and other markets during a high inflationary period, due to investors’ desire for lower risk. However, the study by Barrows and Naka (1994) did not establish any significant relationship between the term structure of interest rates and stock returns in the restaurant industry in the United States.
Tan (2017) examined the hotel-specific, industry-specific, and macroeconomic determinants of the FP of London hotels. GDP and inflation were included as macroeconomic determinants, and the study tested for their possible impact on the profitability of London hotels. The results of the generalized method of moments (GMM) system estimator showed that GDP and inflation had a significant positive influence on ROA and ROE. However, Tan (2017) concluded that the results were inconsistent, because GDP and inflation had a significant and negative impact when ROCE was used as the measure of profitability. These conflicting results show that there is no consensus among the prior studies regarding the impact of macroeconomic variables on hotel performance.
With regard to the tourism growth, the existing studies have shown that an expansion of the tourism industry has the ability to enhance the state of the economy and thereby improve the performance of hotels (Balaguer & Cantavella-Jordá, 2002; M.-H. Chen, 2007b, 2010, 2015; Jayathilake, 2013; H. J. Kim et al., 2006; Rahman et al., 2012; Zeitun et al., 2007). Employing cointegration and causality tests, Balaguer and Cantavella-Jordá (2002), and Jayathilake (2013) showed that there is a long-term relationship between growth in tourism and GDP, indicating that an expansion of tourism can enhance the development of the economy. A study in the same vein conducted by H. J. Kim et al. (2006) in Taiwan also showed that an increase in the number of arrivals of foreign tourists could improve economic conditions. However, this study revealed that there is bidirectional long-term link between GDP growth and tourism expansion (using the growth in foreign tourist arrivals as a proxy). Based on the above discussion, we propose the following hypotheses:
Firm-Specific and Contextual Determinants of Hotel Performance
Firm size
Many studies (Aissa & Goaied, 2016; Al-Najjar, 2013, 2015; M.-H. Chen, 2010; Israeli, 2002; W. G. Kim et al., 2013; Lado-Sestayo et al., 2016; O’Neill et al., 2008) have examined the relationship between firm performance and size in the hotel industry. Nevertheless, there is no unanimous agreement on the strength and direction of these associations. Although M.-H. Chen (2010) reported a positive relationship between the occupancy rate and the hotel size, he also stated that there is a notable negative relationship between the size of the hotel and ROA and ROE. In addition to that, a positive relationship between occupancy rate and hotel size has been reported by W. G. Kim et al. (2013). Al-Najjar (2013, 2015) has also reported a positive association between the size and the FP of hotel in Jordan and Middle Eastern countries. However, Aissa and Goaied (2016), in their study on Tunisian hotels, concluded that hotel size is negatively associated with ROA, reaffirming the initial findings of M.-H. Chen (2010). In the light of the previous studies, we propose the following two-tailed hypothesis for hotel size and the FP of Sri Lankan corporate hotels:
Firm age
There are ample studies (Aissa & Goaied, 2016; J. A. C. Baum & Mezias, 1992; F.-C. Wang, Hung, & Shang, 2006; F.-C. Wang, Shang, & Hung, 2006) investigating the association between age and FP of hotels. All these studies have a common finding, which is that when a hotel has operated for a considerable number of years, it has earned a reputation, experience, and a high brand value, either local or international, and as a result there is a positive effect on the hotel’s performance (Aissa & Goaied, 2016; Wang F.-C. Hung, & Shang, 2006). Nevertheless, Aissa and Goaied (2016) warned that there are limits to how far a firm can use its age as a competitive advantage to improve its profitability. As explained through a Tunisian case study, a hotel reaches its peak after about 10 years and then its profitability starts to decline (Aissa & Goaied, 2016). J. A. C. Baum and Mezias (1992) also suggested that there is a likelihood of possible failure as a hotel grows older and, therefore, a negative influence on firm performance. Accordingly, we propose the following hypothesis:
Efficiency
There are ample studies that have evaluated the efficiency of various industries, including the hotel industry. However, the existing tourism literature has paid scant attention to the relationship between efficiency and performance in the hotel industry. Nevertheless, the impact of managerial efficiency on firm performance has been thoroughly examined in other industries. Previous studies have revealed that enhanced efficiency boosts profitability (Aissa & Goaied, 2016; Baik et al., 2013; Gyan et al., 2017; Sami & Mohamed, 2014). Using a large sample of firm-year observations, Baik et al. (2013) showed that firm efficiency is positively and significantly associated with both current and future profitability. The positive association between efficiency and performance was also found by Gyan et al. (2017), using a sample of Malaysian companies. A direct positive association between the efficiency and the FP of Tunisian hotels was found by Aissa and Goaied (2016). However, a contradictory argument was presented by Shieh (2012), in a study that used the financial data of 68 Taiwanese hotels; this study found that FP has an insignificant positive relationship with efficiency. Following the direction of the previous literature (Aissa & Goaied, 2016; Barros, 2005; Charnes et al., 1978; Hwang & Chang, 2003; Neves & Lourenço, 2009; Sigala, 2004; M.-M. Yu & Lee, 2009), and using data envelopment analysis (DEA), this study examines the relationship between managerial efficiency and the FP of corporate hotels in Sri Lanka. We expect to find a positive relationship between hotel efficiency and performance, and thus the following hypothesis is put forward:
Location
To succeed in the hotel industry, it is essential for a hotel to be suitably located, and this is clearly highlighted in the tourism literature. Assaf et al. (2015) and Aissa and Goaied (2016) have revealed that a hotel’s location has a tremendous impact on the performance of the firm. According to the previous studies, hotels located in coastal areas (Aissa & Goaied, 2016), in scenic areas (Aissa & Goaied, 2016; C.-F. Chen & Rothschild, 2010; T. He, 2003), and in cities (Zhang & Enemark, 2016) tend to perform better than hotels that are located elsewhere. The Sri Lanka Tourism Development Authority (SLTDA, 2017), which is the national tourism organization of Sri Lanka, has divided Sri Lankan destinations into seven major regions according to their particular locations: Colombo City, Greater Colombo, South Coast, East Coast, Hill Country, Ancient Cities, and Northern Region. Out of these seven, we select three locations: South Coast, Colombo City, and Ancient Cities, where there is the highest rooming capacity in Sri Lanka (SLTDA, 2017) and a wide availability of corporate hotels. However, it should also be highlighted that some corporate hotels are present in locations across different regions, to gain the maximum yield through the horizontal distribution of hotels. Thus, we introduce an additional variable for geographically diversified hotels (see Table 2). Accordingly, we propose following hypotheses for the location–performance relationship:
Definition of Variables and Predicted Direction..

Note. TOPSIS = technique for order performance by similarity to ideal solution; GDP = gross domestic product; DEA = data envelopment analysis.
Ownership structure
During the last few years, the business literature has been paying attention to corporate governance (Abdullah, 2018; Al-Najjar, 2015). Academics have also studied the effect of the ownership dynamics on the performance of corporates, as a corporate governance mechanism (Al-Najjar, 2015; Ganguli & Agrawal, 2008; McConnell & Servaes, 1990; Pound, 1988; Scholten, 2014; Zakaria et al., 2014). According to the agency theory (Jensen & Meckling, 1976), the construction and re-construction of the ownership structure can be utilized as an effective control tool to address disputes between the management of a company and its shareholders, alias the principal and the agent, which are an outcome of their different risk attitudes (Jensen, 1999). When the majority of shares are held by institutional investors, the investors can effectively participate in a monitoring role for the firm, which, in turn, reduce the agency costs (Jensen, 1999; Tong & Ning, 2004). Furthermore, according to Al-Najjar (2015), institutional shareholders are competent to manage firms effectively. In the context of reducing the agency costs through the institutional monitoring process by institutional investors, McConnell and Servaes (1990) put forward an observation on the positive relationship between corporate performance and institutional investors. However, Pound (1988) and Al-Najjar (2015) unearthed a negative relationship between corporate performance and foreign and institutional investors, underlining the fact that there are contradictory findings. Given the inconclusive evidence on the direction of the relationship between ownership structure and hotel performance, we propose the following two-tailed hypotheses:
Affiliation
The Sri Lankan corporate hotel sector consists of many hotel groups that control around 100 tourist hotels. The aim of this study is to compare the FP of non-affiliated hotels and hotels affiliated with a group. Many studies (Bhaumik et al., 2017; J. He et al., 2013; Keister, 1998; Khanna, 2000; Khanna & Palepu, 1999; Ma et al., 2006; Singh & Ajai, 2008; H. Yu et al., 2009) have argued that firms that are associated with a corporate group perform better financially than non-affiliated firms. Furthermore, if a firm is affiliated with a versatile group of companies, the affiliating company can enjoy numerous benefits (Khanna & Palepu, 1999). Firms that are affiliated with corporate business groups can use their internal capital markets to deal with risks more successfully by transferring them into profits (Bhaumik et al., 2017). This argument has been well tested by these researchers using a large sample of Indian companies. The results revealed a significantly positive relationship between profitability and group-business affiliations. In the tourism and hospitality sector, a number of studies have found a positive relationship between a hotel’s performance and its affiliation to either a local or an international hotel chain (P. C. Chen, 2002; T. He, 2003; Hwang & Chang, 2003; Sami & Mohamed, 2014). In the light of these findings, the following hypothesis is proposed in relation to hotels’ affiliation:
Intensity of firms’ promotion and advertising
According to Hilmi and Hwa Ngo (2011), advertising can be considered as an effective marketing tool. Hsu and Jang (2008) and Park and Jang (2012) suggested that advertising can add intangible value to firms and thereby attract customers. Marketing therefore has a positive impact on the performance of a company. O’Neill et al. (2008) embraced this theory, suggesting that marketing can improve the image of a brand and a hotel. Using data from hotel in the United States, they established a significant positive relationship between the marketing expenses and hotel room revenue. The current marketing literature also provides valuable evidence about advertising and its influence on customers. According to Kaldor (1950), Mittal and Baker (2002), and Stigler and Becker (1977), effective advertising has the capacity to boost customer demand through changing tastes. Also, effective advertising can increase demand by providing more information to consumers that allows them to compare and evaluate the product successfully (Demsetz, 1979; Nelson, 1970, 1974). C.-M. Chen and Lin (2013) provide further evidence on the significant positive association between firm performance and advertising. Based on these evidences, the following hypothesis is proposed:
Research Design and Methodology
Measures of FP of Corporate Hotel
Traditional FP metrics, although they have limitations, have been extensively used in research on accounting, finance, and strategic management. The most widely used FP metrics, such as ROA, ROE, ROCE, and return on investment (ROI), are subject to various drawbacks, because the accounting figures may have been manipulated by those who prepared them. Also, these metrics are influenced by the accounting techniques that are used to value the assets, particularly the intangible assets (Fisher, 1987; Watts & Zimmerman, 1990). Yet, critics contend that the use of accounting-based metrics is commonplace, as there is easy access to these metrics and managers regularly make use of them in strategic decision-making. Furthermore, accounting-based FP metrics are regularly used to determine short-term performance, for example, to recognize and reduce unnecessary expenses and unproductive resources, which demonstrate their adequacy for performance assessment (Morrow et al., 2004). Following previous studies (Abdullah, 2018; Aissa & Goaied, 2016; Al-Najjar, 2013, 2015; M.-H. Chen, 2007a, 2010; Cherian et al., 2019; Issah & Antwi, 2017; Oxelheim, 2002; Weerathunga et al., 2019), we use ROA, ROE, and ROCE as proxies for FP of corporate hotels in Sri Lanka.
Comprehensive Financial Performance Score (CFPS)
While numerous research has used ROA and ROE as the key FP metrics of companies, it is questionable whether these two metrics alone can represent the true performance of a company (Hsu, 2013). A successful evaluation of FP should consider all its aspects, including profitability, liquidity, efficiency, and share performance. The use of a combination of accounting ratios for FP analysis is prevalent in the literature (M.-H. Chen, 2010; Deng et al., 2000; Y.-J. Wang, 2009; Weerathunga et al., 2019). For example, M.-H. Chen (2010) developed a composite indicator named “SCORE” to measure the overall performance of Taiwanese hotels, by combining six accounting ratios. Factor analysis was used in his study to combine these ratios systematically into a composite indicator. The score that was developed was then regressed against several economic and hotel-specific factors to identify the impact of economic growth and tourism expansion on hotel performance.
The use of multiple criteria decision-making (MCDM) methods such as the TOPSIS, DEA, and the analytical hierarchy process (AHP) is popular in the performance evaluation literature. The TOPSIS approach, among others, has been widely used in previous studies for performance analysis (see, for example, Bulgurcu, 2013; Chang et al., 2010; Deng et al., 2000; Ertuğrul & Karakaşoğlu, 2009; Kaynak et al., 2017; Kumar, 2016; Seçme et al., 2009; Weerathunga et al., 2019). In the light of these studies, a CFPS is calculated using the TOPSIS method. TOPSIS methods offer a number of advantages: They are simple, rational, and comprehensible; have good computational effectiveness; and offer the ability to measure relative performance in a simple mathematical form for each alternative (Ewa, 2011). The calculation of CFPS values under the TOPSIS method follows three steps. First, following our extensive literature review, a set of accounting ratios capable of representing the different aspects of FP was identified, and select the five most important ratios, namely, ROA, ROCE, revenue growth, asset growth, and current ratio, using factor analysis (see Appendix A). Second, appropriate weights are defined for every parameter (ratio) that has been selected, for the development of the composite indicator (CFPS). To this end, the Shannon (1948) entropy principle is used. The entropy method has been widely used in determining the weights for indexes (Hsu, 2013). The use of entropy follows certain steps, as indicated below.
Step 1: Construct the initial evaluating m × n matrix:

where m = number of hotels,
The initial matrix
For positive values:

For negative values:

For moderate values:

The normalized evaluation matrix

Step 2: Calculate the weights for each criterion based on entropy.
The weights for each indicator are calculated following Chang et al. (2010).
Calculate the

Calculate the

Derive the weights

Step 3: Compute the TOPSIS score for each hotel company for each year from 2012 to 2018 using entropy weights as follows.
Step A: Obtain the initial evaluating matrix
Step B: Normalized the initial matrix
The absence of a uniform dimension in the evaluation criteria (i.e., the financial ratios) in the initial matrix requires the data to be normalized using one of the following procedures suggested by Y.-J. Wang (2009) and Y.-J. Wang and Lee (2007).
For cost criteria:

For benefits criteria:
Step C: Derive the weighted normalized decision matrix

where
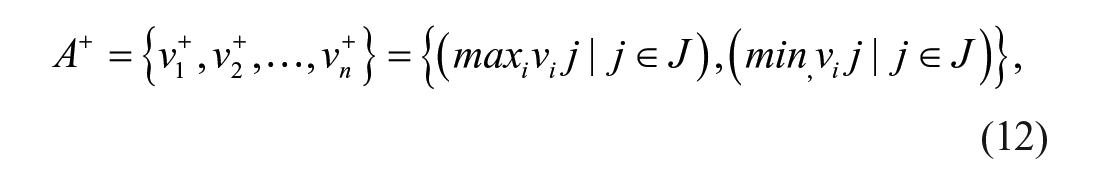
Step D: The positive and negative ideal solution should be determined using Equations 12 and 13, respectively:

Step E: Calculate the separate measure for each hotel from the positive ideal solution


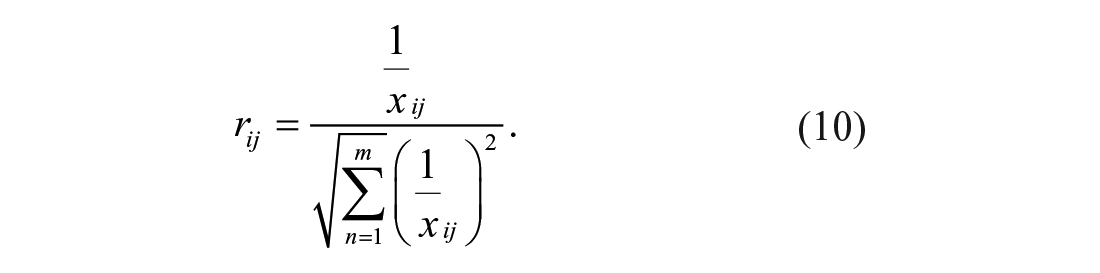
Step F: The relative closeness coefficients are obtained as follows:

The calculated value of
Macroeconomic Measures, and Firm-Specific and Contextual Variables
Table 2 summarizes the dependent and independent variables and their measurement along with the predicted directions for the independent variables.
Estimation of hotel efficiency
We use a DEA model to estimate the managerial efficiency (EFFI) of the sample hotels. DEA, first introduced by Charnes et al. (1978), is a mathematical programming approach to determine production frontiers and to measure the efficiency of the developed frontiers. DEA allows the evaluation of homogeneous units (such as hotels or banks), taking into account multiple inputs and outputs. As it follows a nonparametric methodology, DEA is also considered advantageous over other quantitative approaches to efficiency analysis such as the econometric frontier (Barros, 2005). There are two well established and widely applied DEA models, namely, the Charnes, Cooper, and Rhodes (CCR) model (Charnes et al., 1978) and the Banker, Charnes, and Cooper (BCC) model (Banker et al., 1984). These DEA models have also been extensively applied in the tourism literature (Barros, 2005; Hwang & Chang, 2003; Kularatne et al., 2019; M.-M. Yu & Lee, 2009). This study uses an input-oriented CCR model to ascertain the efficiency of the selected Sri Lankan hotels. The input-oriented approach is suitable when the producers need to satisfy market demand in a competitive market by minimizing their inputs (Parte-Esteban & Alberca-Oliver, 2015). Customer demand has increased in the tourism sector in Sri Lanka since 2008, and the hoteliers need to meet this demand with given inputs.
The difficult and most crucial stage of the DEA programming approach is the identification of the inputs and outputs of the decision-making units (DMUs; here, the hotels). Previous studies in the tourism literature have used various inputs and outputs depending on data availability. Nevertheless, the most commonly used inputs are cost, number of employees, value of assets, and number of rooms (Aissa & Goaied, 2016; Barros, 2005; Parte-Esteban & Alberca-Oliver, 2015; Wang F.-C., Hung, & Shang, 2006), and the most commonly used outputs are sales, number of guests, and other revenues (Aissa & Goaied, 2016; Barros, 2005; Parte-Esteban & Alberca-Oliver, 2015). The selection of inputs and outputs in this study was limited by the data availability. For example, there are no publicly available data on number of rooms, number of guests, number of staff, floor space, or area for most Sri Lankan hotels, and hence these variables cannot be used in the DEA index calculation. We also follow the DEA convention suggested by Raab and Lichty (2002) in selecting inputs and outputs, according to which the number of DMUs should be greater than the total number of inputs and outputs [29 ≥ 3(3 + 2)]. Accordingly, we select total assets, cost of sales, and operating cost as the inputs, and sales revenue and other income of the hotels as outputs.
We follow Charnes et al. (1978) and ascertain the managerial efficiency of each hotel under the input-oriented CCR model by solving the following linear programming problem:


where
Sample and Data
Although we consider all 39 hotel companies listed in the Colombo Stock Exchange (CSE) in Sri Lanka, 10 companies hat to be excluded due to the unavailability of annual reports (four companies) and lack of data (six companies) for some variables under consideration. This resulted in a final sample of 29 hotel companies. All the required data were hand-collected from the annual reports of the hotels. However, annual reports are available only from 2012 onward in the official website of CSE, and hence study period was limited to 7 years. The macroeconomic information was collected from the World Bank’s website. This website 1 provides data for different economic indicators, including data related to GDP, inflation, real interest rates, and the tourism industry.
Multivariate Panel Regression
This study uses a linear panel regression test with a balanced panel consisting of 29 corporate hotels over the 7 years from 2012 to 2018, yielding 203 firm-year observations. The panel regression procedure has been considered more suitable than other regression techniques such as OLS for problems associated with longitudinal data (Hsiao, 2007). Panel data analysis can effectively mitigate the problem of omitted variable bias (Hsiao, 2007). It can also reduce the problem of multicollinearity among the independent variables. As panel regression can be estimated as a fixed effect (FE) model, a random effect (RE) model, or a pooled ordinary least squares (POLS) model, we carried out a number of diagnostic tests to select the appropriate model. The F-test results were used to decide between an FE model and a POLS model. The Breusch–Pagan Lagrange multiplier test (Breusch & Pagan, 1980) statistics were used to select between an RE model and a POLS model. Finally, we decided between an FE model and an RE model using the Hausman’s (1978) specification test statistics.
Macroeconomic model
A macroeconomic model was estimated to assess the effect of economic and industry variables on the FP of corporate hotels in Sri Lanka. We used three performance metrics to capture different aspects of FP: ROA, ROE, and CFPS. We repeated the macroeconomic model for each of these measures, as shown in Equations 17 to 19. The definitions and measurements of all the performance metrics and the economic and industry variables are given in Table 2:


where µi is the unobservable individual effect for each hotel,
Integrated model
We estimated the models specified in Equations 20 to 22 to incorporate the integrated effect of all the independent variables on the FP of the corporate hotels. Accordingly, the independent variables (right-hand side) in each Equations 20 to 22 remain unchanged, while the dependent variables (left-hand side) take different proxies for corporate hotel performance. This procedure allows us to examine the integrated effect of all the explanatory variables on hotel performance, and to distinguish this from the individual effect of the macroeconomic variables:


where µi is the unobservable individual effect for each hotel,
Data Analysis, and Results and Discussion
Descriptive Statistics
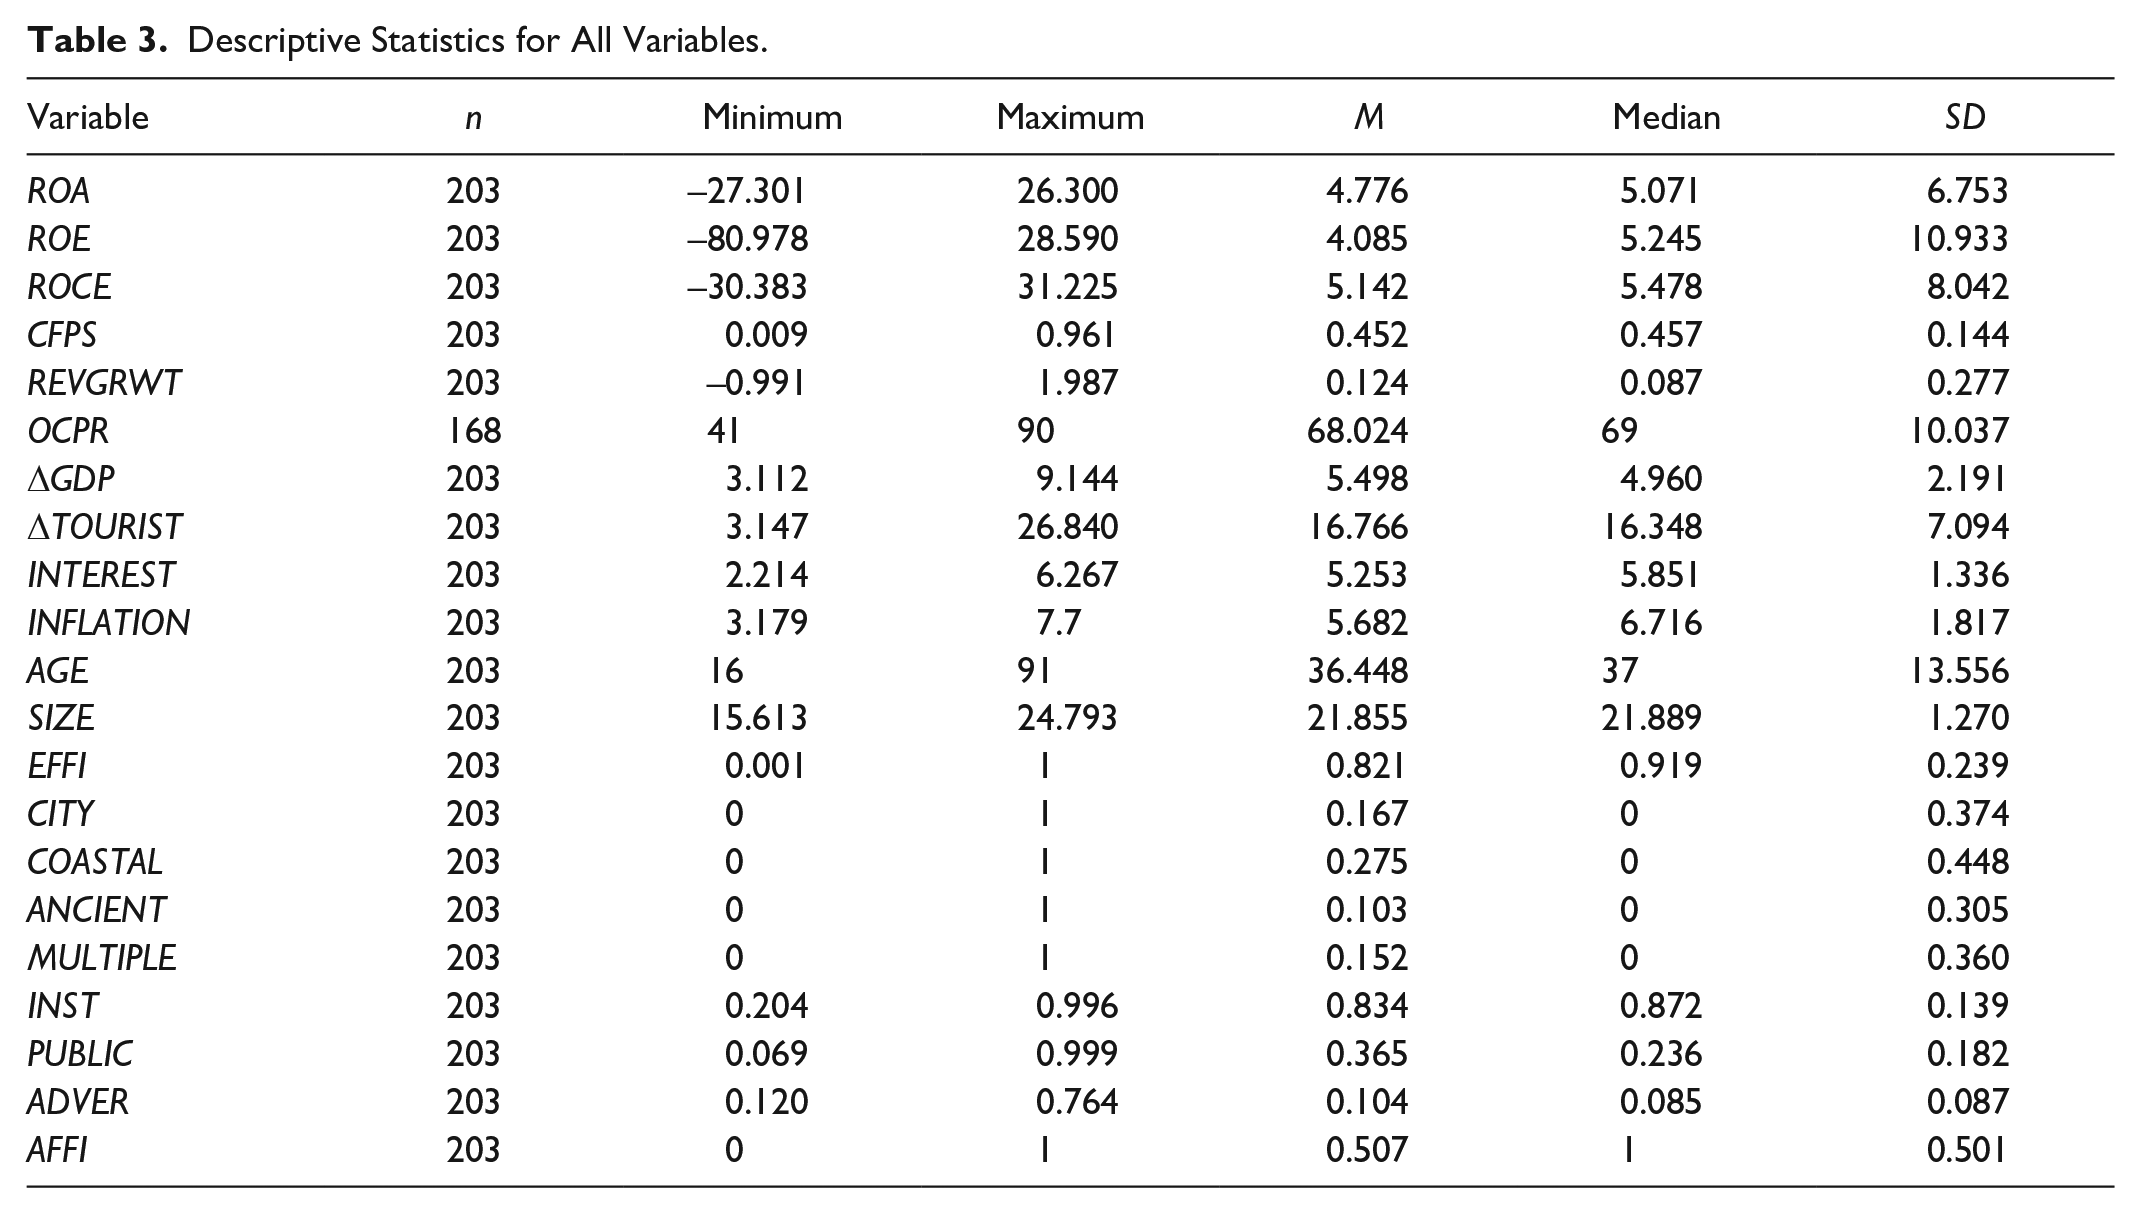
Table 3 reports sample statistics for all 21 variables included in the regression analysis. The mean (median) value of ROA is 4.776% (5.071%), which indicates that low profitability prevailed among the Sri Lankan corporate hotels during the study period. Nonetheless, ROA ranges from –27.301% to 26.300%. This higher variance of ROA indicates that the increasing potential in the tourism industry has been exploited by some hotel companies, while the majority of corporate hotels have struggled. The ROE and ROCE follow the same pattern as ROA, which provides further evidence of the low profitability of Sri Lankan hotels. The average GDP growth (ΔGDP) in Sri Lanka during the period 2012–2017 is 5.498%. The highest (lowest) ΔGDP during our sample period is 9.144% (3.112%). The prolonged drought from early 2016 and the heavy floods in mid-2017 had an adverse impact on the country’s agriculture sector and resulted in the lowest ΔGDP (i.e., 3.112%) in 2017. The weather-related shocks also had an adverse impact on the tourism industry, with the lowest (i.e., 3.147%) growth in the number of foreign tourist arrivals (ΔTOURIST) being reached in 2017.
Descriptive Statistics for All Variables.
Correlation Analysis
The results of the Spearman’s correlation analysis for continuous variables are presented in Table 4. The GDP growth (ΔGDP) has a positive and significant correlation with all the performance metrics except for revenue growth (REVGRWT). This implies that improved economic condition can enhance corporate hotel performance. The variable ΔTOURIST also has a significant association with ROE, CFPS, and REVGRWT. However, the growth in the number of foreign tourist arrivals is not significantly correlated with ROA, although it has a positive relationship. This insignificant association between ROA and ΔTOURIST appears to contradict prior studies (Al-Najjar, 2013; M.-H. Chen, 2010). Nonetheless, most of the other results for Spearman’s correlation are consistent with the prior literature (Aissa & Goaied, 2016; Al-Najjar, 2013; M.-H. Chen, 2010). The variable ΔTOURIST is positively and significantly correlated with ΔGDP, supporting the tourism-led growth hypothesis of Balaguer and Cantavella-Jordá (2002), and in line with prior studies (Al-Najjar, 2013; M.-H. Chen, 2010; Jayathilake, 2013).
Correlation Analysis.

Significant at .05 level.
Empirical Results and Discussion
Macroeconomic model
Table 5 reports the results from the panel regression based on Equations 17 to 19. As shown in Table 5, we estimated FE models for all proxies of FP (i.e., ROA, ROE, and CFPS), following the required diagnostic tests (Torres-Reyna, 2007). In addition to the FE model, GMM estimations were performed to control for heteroskedasticity and autocorrelation. The GMM estimation is considered more appropriate for studies with large N (companies) and small T (years) (C. F. Baum, 2013; Baum, Schaffer, & Stillman, 2003), as is the case with the present study. Moreover, the endogeneity problem can be effectively controlled with the use of a GMM estimation (C. F. Baum, 2013). In this study, in particular, we used a one-step system GMM to estimate all the models specified in Equations 17 to 22. For this purpose, 1-year lag dependent variables (ROAt–1, ROEt–1, and CFPSt–1) were included in the models. Soto (2009) suggested that a system GMM has a lower bias and higher efficiency in context of a small sample, where N > T.
Regression Results of Macroeconomic Models (Equations 17–19)..
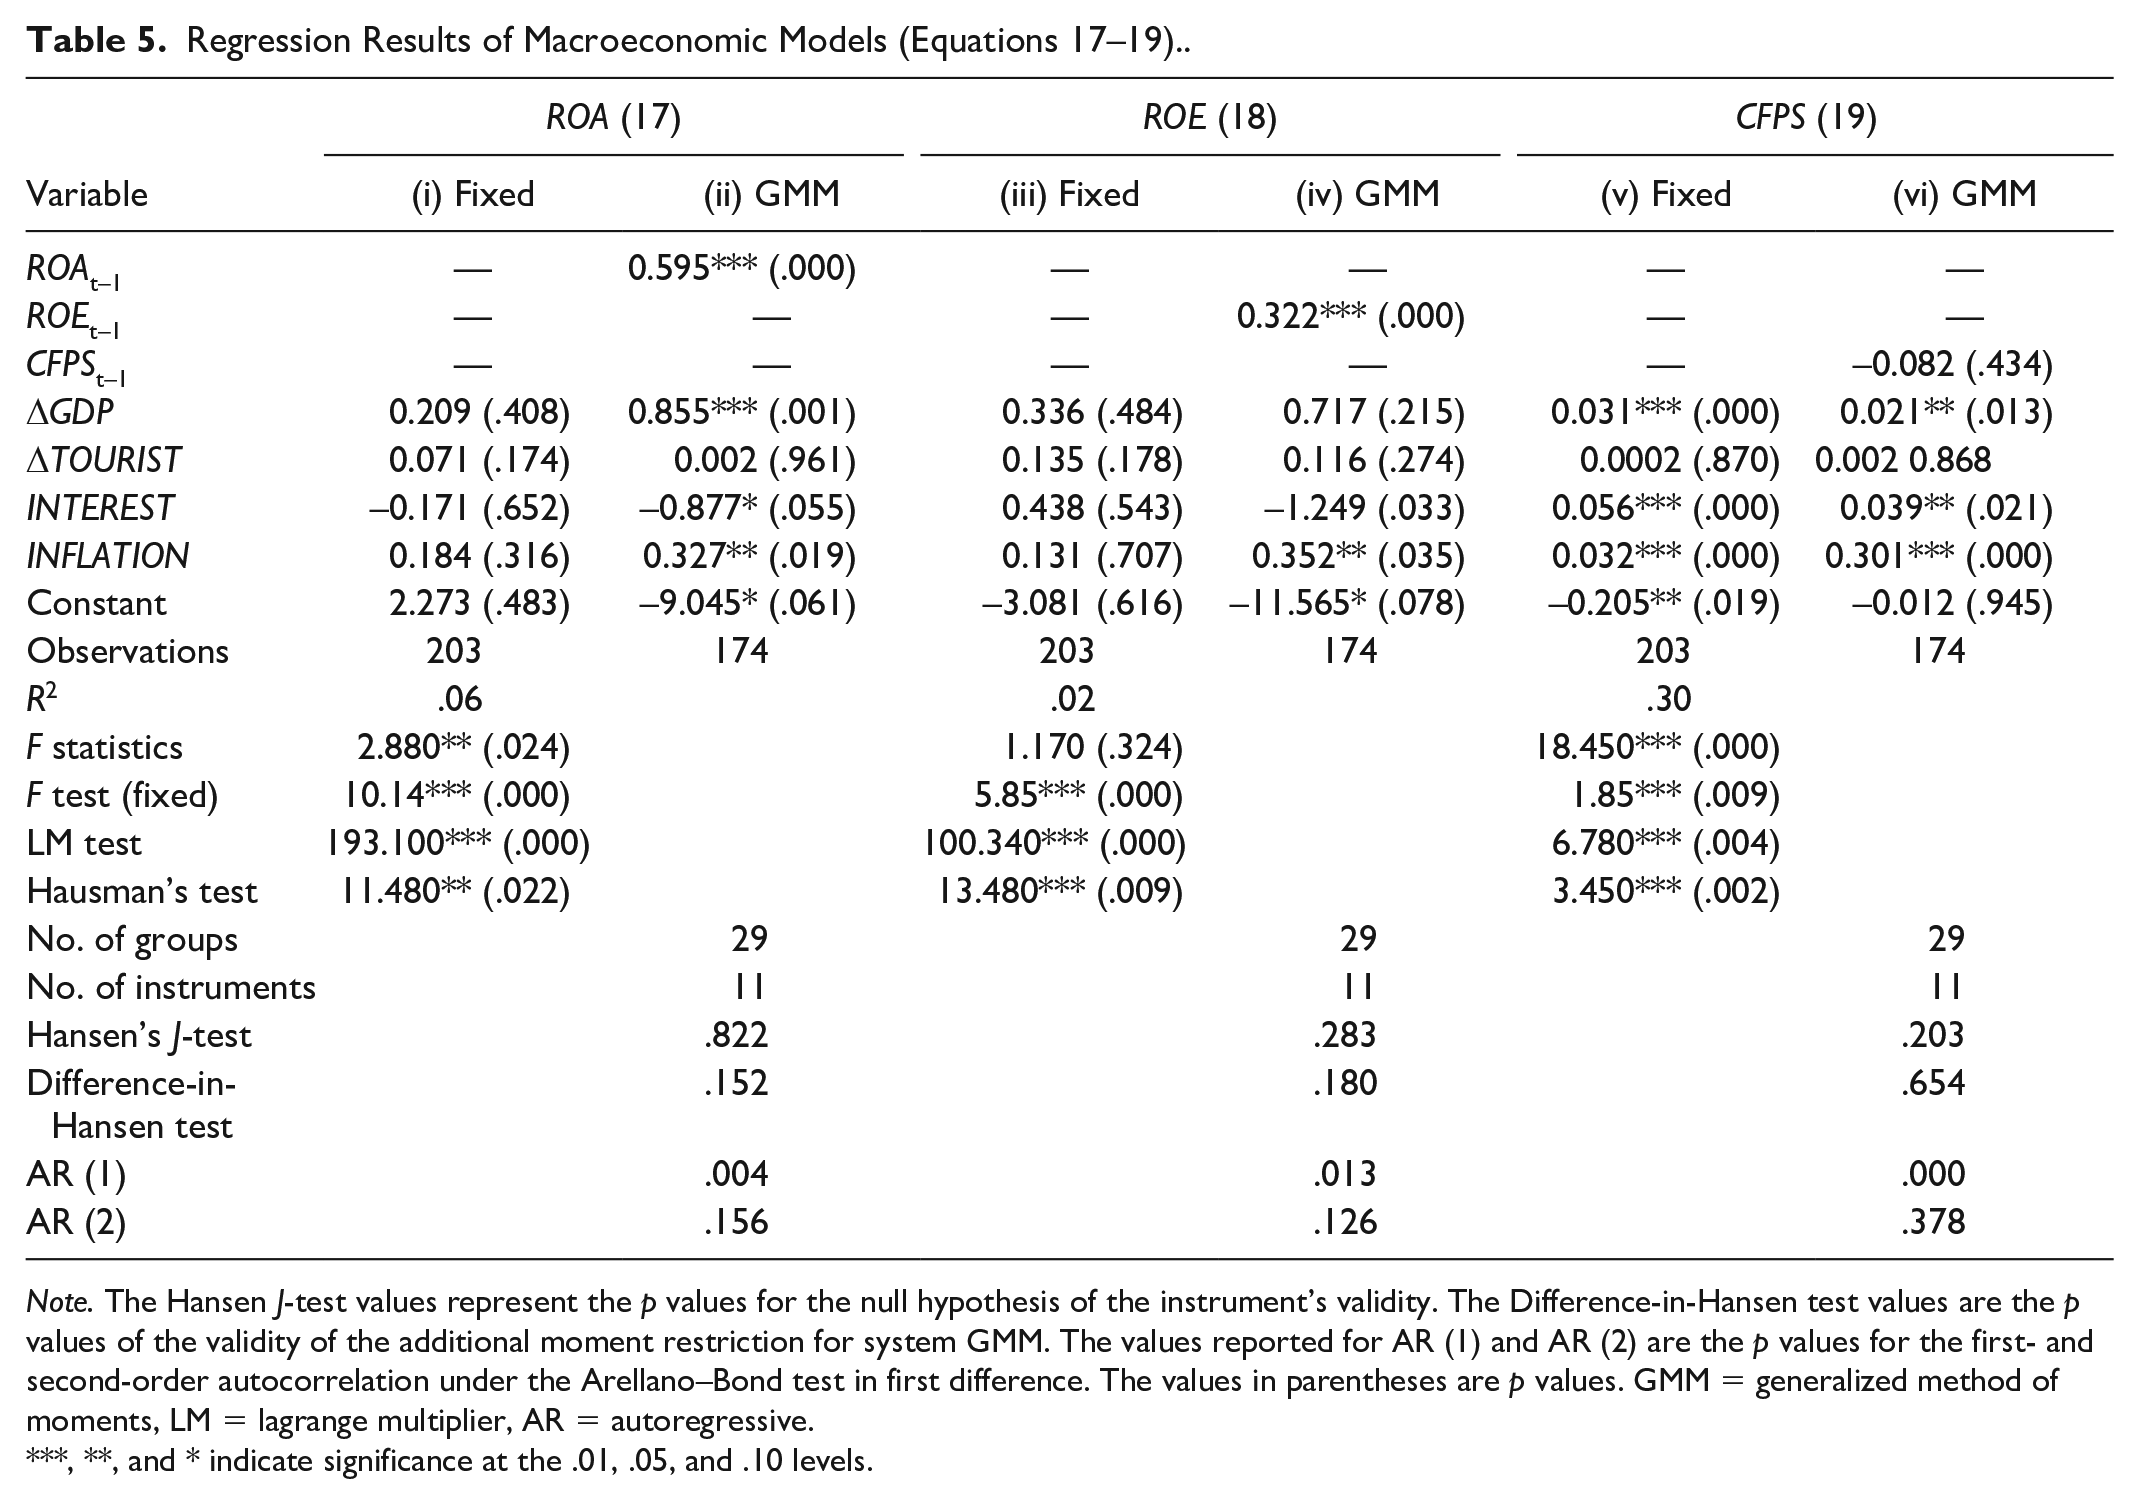
Note. The Hansen J-test values represent the p values for the null hypothesis of the instrument’s validity. The Difference-in-Hansen test values are the p values of the validity of the additional moment restriction for system GMM. The values reported for AR (1) and AR (2) are the p values for the first- and second-order autocorrelation under the Arellano–Bond test in first difference. The values in parentheses are p values. GMM = generalized method of moments, LM = lagrange multiplier, AR = autoregressive.
***, **, and * indicate significance at the .01, .05, and .10 levels.
Although the coefficients of ΔGDP and ΔTOURIST are positive, their p values do not indicate a significant impact on ROA and ROE in the FE model (see columns (i) and (iii)). However, we find robust estimates of the coefficients of ΔGDP and INFLATION in the GMM model, have a positive and significant association with ROA (
Our findings could be caused by the ability of the hospitality industry to make a speedy adjustment of its prices to match the seasonal effect of demand for hospitality services (Gričar & Bojnec, 2013). Surprisingly, the coefficients of ΔGDP, INTEREST, and INFLATION are highly significant and positive under both the FEs and GMM estimations in the model specified in Equation 19, where the macroeconomic variables are regressed on CFPS. This result suggests that the selected macroeconomic variables, except ΔTOURIST, have a strong impact on the overall FP of Sri Lankan corporate hotels. This is also evident in the result for
Integrated model
Table 6 reports the regression results from the models specified in Equations 20 to 22. These models estimate the effect of all the explanatory variables (economic, industry, hotel-specific, and contextual variables) on the FP. Table 6 also reports the coefficients estimated from the one-step system GMM regression.
Regression Results of Integrated Models (Equations 20–22).

Note. The Hansen J-test values represent the p values for the null hypothesis of the instrument’s validity. The Difference-in-Hansen test values are the p values of the validity of the additional moment restriction for system GMM. The values reported for AR (1) and AR (2) are the p values for the first- and second-order autocorrelation under the Arellano–Bond test in first difference. The values in parentheses are p values. GMM = generalized method of moments, LM = lagrange multiplier, AR = autoregressive.
***, **, and * indicate significance at the .01, .05, and .10 levels.
Surprisingly, most of the macroeconomic variables (i.e., ΔGDP, ΔTOURIST, INTEREST, and INFLATION) are statistically significant across all the models. Despite the statistical significance, however, the direction of the associations between the FP measures and the macroeconomic variables remains ambiguous. That is, ΔGDP has a negative impact on ROA and ROE (
Following the trend for ΔGDP, a significantly negative relationship appears between INTEREST and profitability (i.e., ROA and ROE), while a significantly positive relationship exists between INTEREST and CFPS. Arguably, this negative relationship between real interest rates and hotel profitability accords with most economic findings related to interest rates (Otambo, 2016; Simiyu & Ngile, 2015; Tutu, 2016). That is, an increase in interest rates could ultimately drive cost-push inflation, which lessens the disposable income of consumers and hence lowers the local demand for activities related to amusement, thus having a negative effect on the revenue and profits of hotels (Investopedia, 2019). There is also a possibility that hotel revenue was not affected by the changes in the domestic interest rate, because a large portion of that revenue was from international tourists; for example, Sri Lanka’s tourism revenue has increased from US $830 million in 2011 to US $4,380 million in 2018 (Census and Economic Information Center, 2019) due to the robust growth in foreign tourist arrivals. Similarly, despite the changes in the domestic interest rate, heavy investments were made in the hotel sector during the last decade, and this, in turn, affected the asset growth in the hotel sector. This could be the reason for the positive coefficient for INTEREST in the model estimated based on Equation 22. Except for the positive relationship between INTEREST and CFPS, all the other results related to INTEREST support H2.
We now turn to the impact of the number of foreign tourist arrivals on the performance of Sri Lankan corporate hotels. The results indicate that ΔTOURIST has a positive and significant impact, albeit with slight inconsistencies across the models, on the FP of the corporate hotels, supporting H4. Moreover, our results confirm the findings of prior studies such as those of M.-H. Chen (2010) and Al-Najjar (2013). Our findings, coupled with the results of the correlation analysis, also contribute to the extant literature by providing backing for the tourism-led growth hypothesis of Balaguer and Cantavella-Jordá (2002). From the practical point of view, in fact, our findings with regard to international tourist arrivals are particularly important for corporate hotel managers, because they reveal that an increase in the number of international tourists has a high impact on hotel profitability.
In Table 6, we observe that the effects of hotels’ characteristics and contextual variables on the FP of corporate hotels are diverse and inconsistent. Nevertheless, managerial efficiency (EFFI) is significantly and positively associated with all the performance metrics, suggesting that it could be classified as a profitability driver. These findings are both consistent with the prior studies (Aissa & Goaied, 2016; Baik et al., 2013; Gyan et al., 2017; Sami & Mohamed, 2014) and in line with our prediction in H7. Our study differs from the earlier studies because it provides evidence of the positive association between efficiency and overall FP (i.e., CFPS), while also confirming the positive association between efficiency and other performance metrics such as ROA, ROE, and ROCE. Like EFFI, the CITY variable is also positive and significant across all the models estimated based on Equations 20 to 22, except for the POLS estimation in column (v). While these results partially support H8a, they are also consistent with prior studies. For instance, Zhang and Enemark (2016) revealed that hotels located in metropolitan areas outperform hotels located in other areas. In addition, our findings are consistent with the higher occupancy rate (i.e., an occupancy rate of more than 75% over the past 7 years) recorded in Colombo City (SLTDA, 2017). With regard to the other location variables, the MULTIPLE variable shows a positive and significant relationship with ROA and ROE. Also, COASTAL is positively and significantly associated with CFPS. Apart from this, none of the other associations between the location variables and hotel performance are significant. Therefore, we can conclude that the results partially support H8a and H8b.
Another significant association can be observed between ADVER and hotel performance. Although we predict that the intensity of a hotel’s promotion and advertising will have a positive impact on its FP, our results indicate that the relationship between ADVER and all the performance metrics is negative. Despite the fact that this result is contrary to our H11, our findings could be attributed to the fact that heavily advertised hotels charge a premium price for their services, as the promotion and advertising costs are included in the price, and therefore that they have a more concentrated market (Ornstein, 1976). The positive coefficients for AFFI across the models indicate that the performance of hotels affiliated to a group of companies is better than the performance of stand-alone hotels. These findings corroborate the idea that companies affiliated with a group have the strategic advantage of easy access to capital using the internal capital market, and therefore they can effectively translate their risk into profits (Bhaumik et al., 2017). Based on these results we cannot reject H10.
The impact of the hotel’s age (AGE) and size (SIZE) on FP is negative and insignificant, which rejects H5 and H6. Findings with regard to age are consistent with the ideas that the profitability of a hotel reaches its optimum at a certain age and then begins to decline (Aissa & Goaied, 2016), and that as a hotel grows older this may increase the possibility of potential failure, so that age is negatively associated with FP (J. A. C. Baum & Mezias, 1992). Negative coefficients of SIZE indicate that there is an inverse relationship between hotel size and profitability, suggesting that large hotels are less profitable than small hotels. Large hotels have a higher proportion of depreciation and amortization in their operating expenses, and the cost of staff in large hotels is also significantly higher, which could reduce the profitability of large hotels. Finally, we found no evidence to support a significant association between ownership structure (INST, PUBLIC) and hotel performance, and hence we reject H9a and H9b.
Further Corroborative Analysis
Alternative measures of corporate hotel performance
An additional analysis was conducted based on three alternative measures of hotel performance (results are reported in Appendix B). The selected alternative measures are ROCE, revenue growth, and occupancy ratio. These measures have also been widely used in previous studies (M.-H. Chen, 2010; Tan, 2017).
The results from the model based on ROCE as the dependent variable are comparable with the results based on ROA and ROE. However, the results based on REVGRWT and OCPR deviate somewhat from the other results. Variables such as ΔTOURIST, INFLATION, CITY, MULTIPLE, and AFFI are significant and positive relationship with revenue growth. On the contrary, occupancy rate is significantly and positively associated with ΔTOURIST, SIZE, CITY, and ANCIENT. These results provide further evidence of the importance of the number of tourist arrivals, as this is significantly associated with all the performance indicators for the hotel industry. The results also indicate that large hotels have secured high occupancy rates and yet are confronted by low profitability. These results are consistent with the previous findings of T. H. Chen (2009) and M.-H. Chen (2010).
Decomposition of R2 values
We are particularly interested in the R2 value from each model because it contains essential information about the relative effect of each set of variables (i.e., economic variables, industry variables, firm-specific variables, and contextual variables) on FP. So far, the calculated R2 values have mainly revealed that the economic and industry factors can explain a significant amount of the variation in the overall FP. By contrast, a significant variation in the profitability (i.e., ROA and ROE) is explained by the hotel-specific and contextual factors.
Table 7 presents the decomposition of the R2 values using the STATA routine “shapley2” based on an OLS estimation. This decomposition helps us to determine the relative contribution of each regressor on the dependent variable (Shorrocks, 1982). The results indicate economic and industry factors account for a smaller part of the variance in ROA and ROE and a higher part of the variance in overall FP. Conversely, hotel-specific and contextual variables explain a higher part of the variance in ROA and ROE but a smaller part of the variance in overall FP indicating that the hotels’ profitability is driven by these factors. These findings provide an important implication for Sri Lankans’ hoteliers because it shows that FP is mostly driven by hotel-specific factors.
The R2 Values for Each Set of Explanatory Variables.

Note. ROA = return on assets; ROE = return on equity; CFPS = comprehensive financial performance score.
Conclusion
In the emerging research area of the development of the hospitality and tourism sector, this research endeavors to examine the relative effects of economic, industry, and hotel-specific factors on corporate hotel performance. Drawing on Sri Lankan hotels’ data and using panel regression test, this study finds that several economic, industry, and hotel-specific and contextual variables significantly influence hotel performance. More specifically, inflation and tourism expansion have a significant and positive impact on the performance of Sri Lankan corporate hotels. We also find that real interest rates have a negative effect on the profitability of hotels. More interestingly, we reveal that managerial efficiency, hotel location, and hotel affiliation are positively associated with FP. In particular, our results indicate that hotels located in cities are more profitable than hotels located elsewhere.
The empirical findings of this study have critical policy implications for the government, hotel owners, and managers. The government must ensure the security of the country to win the trust of the international community, and programs need to be launched to raise international community awareness. Moreover, to encourage the hospitality sector, the government should boost investment in peripheral infrastructure such as electricity, water, highways, medical services, and transportation services. Furthermore, investor-friendly policies need to be formed to attract foreign investment and thereby improve hotel facilities. In particular, the complex and burdensome taxation system that is currently in place for investors should be revised.
The empirical findings of this study also offer valuable implications for hotel owners and managers. This study reveals that managerial efficiency has a significant and positive effect on corporate hotel performance. Therefore, managers should implement cost reduction strategies to improve efficiency. Attention should be paid to areas such as waste management, the maximum utilization of assets, employee efficiency, control of overheads, and supply efficiency. On the contrary, revenue generation strategies should also be implemented. As international tourist arrivals have dropped, promotion and advertising campaigns should be launched targeting local tourists. In particular, managers can introduce different discount schemes for local and international tourists. Moreover, promoting group events such as business conferences, special events, reunions, and weddings can create additional revenue streams and thereby improve efficiency. Furthermore, because geographic location tends to be significantly associated with hotel performance, careful strategies for geographical diversification may offer competitive advantages.
Supplemental Material
Appendix_A – Supplemental material for The Relative Effect of Growth of Economy, Industry Expansion, and Firm-Specific Factors on Corporate Hotel Performance in Sri Lanka
Supplemental material, Appendix_A for The Relative Effect of Growth of Economy, Industry Expansion, and Firm-Specific Factors on Corporate Hotel Performance in Sri Lanka by P. R. Weerathunga, Cheng Xiaofang, W. H. M.S. Samarathunga and P. M. B. Jayathilake in SAGE Open
Supplemental Material
Appendix_B – Supplemental material for The Relative Effect of Growth of Economy, Industry Expansion, and Firm-Specific Factors on Corporate Hotel Performance in Sri Lanka
Supplemental material, Appendix_B for The Relative Effect of Growth of Economy, Industry Expansion, and Firm-Specific Factors on Corporate Hotel Performance in Sri Lanka by P. R. Weerathunga, Cheng Xiaofang, W. H. M.S. Samarathunga and P. M. B. Jayathilake in SAGE Open
Footnotes
Appendix A
Selection of Factors for CFPS Based on Factor Analysis.

| Factor | Variable | Factor loading | Eigenvalue | % of variance | Selection |
|---|---|---|---|---|---|
| Profitability | Return on assets | 0.933 | 4.411 | 36.758 | Selected |
| Return on capital employed | 0.936 | Selected | |||
| Return on equity | 0.907 | ||||
| Net profit ratio | 0.767 | ||||
| Earnings per share | 0.492 | ||||
| Assets turnover | 0.444 | ||||
| Growth | Assets growth | 0.877 | 2.265 | 18.87 | Selected |
| Net profit growth | 0.382 | ||||
| Liquidity | Current ratio | 0.821 | 1.162 | 9.68 | Selected |
| Quick ratio | 0.806 | ||||
| Market share | Revenue growth | 0.792 | 1.035 | 8.62 | Selected |
Note. CFPS = comprehensive financial performance score.
Appendix B
Regression Results From Integrated Models Using Alternative Measures of Hotel Performance.

| ROCE | REVGRWT | OCPR | ||||
|---|---|---|---|---|---|---|
| Variable | (i) Random | (ii) GMM | (iii) Pooled | (iv) GMM | (v) Random | (vi) GMM |
| ROCEt –1 | — | 0.270***(.002) | — | — | — | — |
| REVGRWTt –1 | — | — | — | –0.184***(.002) | — | — |
| OCPRt –1 | — | — | — | — | — | 0.588***(.000) |
| ΔGDP | –0.974(.134) | –0.435(.299) | 0.002(.934) | 0.028*(.053) | 0.038(.931) | 0.305(.585) |
| ΔTOURIST | 0.415***(.005) | 0.430***(.010) | 0.007**(.024) | 0.004**(.026) | 0.499***(.000) | 0.397***(.000) |
| INTEREST | –1.129**(.029) | –1.014***(.005) | –0.036(.215) | –0.008(.982) | 0.347(.520) | 1.367(.137) |
| INFLATION | 0.724**(.028) | 1.125***(.005) | 0.011** (.035) | 0.011*(.089) | 0.608(.111) | 0.537(.151) |
| AGE | –0.003(.954) | 0.008(.833) | –0.009 (.507) | –0.001(.166) | –0.013(.893) | 0.026(.452) |
| SIZE | –0.477 (.572) | –1.625* (.076) | 0.004 (.708) | 0.014(.396) | 1.547***(.000) | 1.551**(.049) |
| EFFI | 16.235**(.020) | 15.140*** (.023) | 0.332** (.027) | 0.122(.517) | 7.736*(.057) | 3.470(.314) |
| CITY | 6.512***(.000) | 3.464** (.010) | 0.150**(.038) | 0.199***(.002) | 0.495**(.039) | 2.850**(.037) |
| COASTAL | 3.339(.145) | 1.883(.326) | 0.006(.896) | 0.001*(.097) | 5.611*(.056) | 2.756**(.049) |
| ANCIENT | 2.161(.727) | 0.527 (.884) | –0.058 (.313) | –0.037(.282) | 9.729***(.000) | 5.692***(.008) |
| MULTIPLE | 6.898***(.003) | 3.581** (.032) | 0.126***(.001) | 0.173***(.002) | 0.098(.965) | 1.099(.608) |
| INST | 4.683(.155) | 2.140 (.731) | 0.206(.142) | 0.105(.393) | 0.185(.972) | 9.572**(.040) |
| PUBLIC | 7.080*(.067) | 5.006 (.186) | 0.276(.168) | 0.425(.128) | –1.644(.822) | –3.209(.382) |
| ADVER | –13.161**(.010) | –8.996** (.045) | 0.186(.324) | 0.164(.357) | –0.397(.418) | –0.148(.978) |
| AFFI | 2.112(.379) | 2.859* (.063) | 0.122*(.052) | 0.170**(.016) | 0.954(.667) | –1.417(.458) |
| Constant | –6.234(.751) | 0.854 (.963) | –0.486(.196) | –0.754(.245) | 12.675(.356) | 36.236**(.049) |
| Observations | 203 | 174 | 203 | 174 | 169 | 144 |
| R 2 | 0.62 | 0.30 | 0.22 | |||
| F statistics | 7.01***(.000) | |||||
| Wald statistics | 204.88***(.000) | 104.58***(.000) | ||||
| F test (fixed) | 9.16***(.000) | 1.28(.172) | 10.90***(.000) | |||
| LM test | 131.96***(.000) | 0.002(.490) | 103.61***(.000) | |||
| Hausman’s test | 10.94(.615) | 11.19(.595) | 5.84(.924) | |||
| No. of groups | 29 | 29 | 24 | |||
| No. of instruments | 22 | 22 | 22 | |||
| Hansen’s J-test | .174 | .518 | .497 | |||
| Difference-in-Hansen test | .452 | .312 | .188 | |||
| AR (1) | .003 | .084 | .002 | |||
| AR (2) | .353 | .314 | .527 | |||
Note. The Hansen J-test values represent the p values for the null hypothesis of the instrument’s validity. The Difference-in-Hansen test values are the p values of the validity of the additional moment restriction for system GMM. The values reported for AR (1) and AR (2) are the p values for the first- and second-order autocorrelation under the Arellano–Bond test in first difference. The values in parentheses are p values. GMM = generalized method of moments, LM = lagrange multiplier, AR = autoregressive.
***, **, and * indicate significance at the .01, .05, and .10 levels.
Declaration of Conflicting Interests
The author(s) declared no potential conflicts of interest with respect to the research, authorship, and/or publication of this article.
Funding
The author(s) received no financial support for the research, authorship, and/or publication of this article.
Notes
References
Supplementary Material
Please find the following supplemental material available below.
For Open Access articles published under a Creative Commons License, all supplemental material carries the same license as the article it is associated with.
For non-Open Access articles published, all supplemental material carries a non-exclusive license, and permission requests for re-use of supplemental material or any part of supplemental material shall be sent directly to the copyright owner as specified in the copyright notice associated with the article.