
Abstract
Currently in Pakistan, the agricultural sector contributes up to 18.9% of the gross domestic product. As a result of modern science and technology development, the source of income for rural households is changing, and nonfarm income has become the main source. This study investigates the effects of nonfarm income on agricultural productivity in rural Pakistan. The current research data has been collected from the Pakistan Social and Living Standards Measurement Survey (PSLM) 2017–2018, a sample of rural and urban areas designed by Pakistan’s Federal Bureau of Statistics. In this study, Heckman’s two-step procedure is used to tackle the problems of endogeneity and selection bias. The first phase, probit regression, indicates that the accessibility of banks, motorable roads, forest, telecommunication substructure, montane grasslands, and shrublands zone affects nonfarm income. On the other hand, the second stage, ordinary least squares regression, found a negative impact of nonfarm income on per capita farm income. Furthermore, results reveal that nonfarm household income has a significant positive effect on agricultural productivity.
Introduction
In Pakistan, the agricultural sector contributes approximately 18.9% of the national gross domestic product (GDP; Index Mundi, 2018; Ministry of Finance [MoF], Government of Pakistan, 2019; Pakistan Bureau of Statistic [PBS], Government of Pakistan, 2018; Statista Data Base, 2018). Rural households’ source of revenue changes daily, and many studies have suggested that nonfarm income is the main source of income in rural areas (Abdallah et al., 2019; Ellis & Mdoe, 2003). With the development of modern science, rural household income is increasing, as rural households earn extra income and enhance their well-being (Dimova & Sen, 2010). Currently, how and why households change their income situation and nonfarm income are of key interest to researchers. This study contributes to examining the nonfarm income out of the total income portfolio and identifying the factor of agricultural diversification. This study also inspects equity and food security implications. It reveals the pull and push factors that change the composition of household income (Barrett et al., 2001; Ellis, 2000). The contribution of nonfarm income is a consequence of push and pull factors as it depends on the household’s incentive and capability as well as the existence of certain barriers (Reardon, 1997; Xin & Qin, 2011). These two conflicting forces influence the change of income sources. Most of the time, the push factors are innate and strongly influence change; these include income risk management, long-term restraints, flattening of the household structure, and adaptation to new technology (Barrett et al., 2001; Ellis, 2000; Reardon et al., 2001). Vast research has been conducted on the pull factors attracting households to the nonfarm sector, where they obtain higher returns more than farming. Low-income earners or poor people are mostly interested in low-risk rural nonfarming services despite comprehending that they may obtain low returns (Reardon et al., 2001). In developing countries, unemployment and poverty are the main challenges for policymakers, and agriculture is the principal source of income for rural households. In Pakistan, agriculture is the main contributor to the GDP despite the associated poverty. Agriculture in Pakistan is dependent on rain (most of the provinces, if not all, have experienced a water crisis), and most farmers do not use modern tools for farming and are uneducated. Consequently, production is inefficient and achieved with limited resources (Lakitan, 2019). Most farmers do not have bank accounts or insurance because the financial sector and insurance companies consider the agricultural sector high risk due to droughts, high output prices, water crisis, unreliable electricity, and the resulting unproductivity and low income generated during the production period. Nonfarm options are not available to all households, yet agriculture alone cannot support household livelihoods, according to Gordon and Craig (2001). Nonfarm income is important during the off-season in rural areas, although the main activity is farming. The Pakistan Social and Living Measurement Survey (PSLM) showed that 72% of rural households had income from nonfarm sources (De Janvry et al., 2005). This sector has an impact on employment and contributes to the livelihood of farming households, yet agricultural yields in Pakistan remain largely unknown. In this study, we will try to determine the impact of households’ nonfarm income on the agricultural productivity in rural areas of Pakistan by estimating the influences of nonfarm income.
Literature Review
According to Womach (2005), nonfarm income refers to the portion of farm household income obtained off the farm, including nonfarm wages, salaries, pensions, and interest income earned by farm families. Farms refer to the sum of crops, livestock, and other farm-related goods and services. In developing countries, such as Pakistan, where farming plays a crucial role in the economy, the nonfarm economy plays a significant role in the household agricultural income system based on the returns (farm returns vs. nonfarm returns). For many years, Pakistan’s rural economy has relied mostly on the agricultural sector, but the situation is currently changing. Agricultural and technological development increase production but need to address the income gap (Dai et al., 2018). The income gap between nonfarm households and farm households is widening daily, as stated by Chang and Boisvert (2009). Most of the scholars have found that in rural area, agriculture cannot provide enough job opportunities for the poor population (Gordon & Craig, 2001). According to Marsland et al. (2000), Li et al. (2013), large numbers of poor people migrate from rural to urban areas, but it is not certain whether they are able to obtain jobs because they cannot use their skills in farming or agriculture in the urban areas. In rural areas, if farming fails, nonfarming economic options are considered as off-seasonal complementary sources (Senadza, 2011). However, rural areas require intensive labor and may entail more risk (Gordon & Craig, 2001; Ullah et al., 2018). In most developing countries, nonfarm income represents 29% to 46% of the rural household income internationally (Haggblade et al., 2005), with 42% in Africa, 32% in Asia, and 40% in Latin America (Readon et al., 1998). Reardon T. (1997) stated that the association between nonfarm and farm sectors can be studied in terms of nonfarm and farm linkages, which are financial transactions carried out over time. In addition, there is a certain linkage between households’ production and expenditures. In terms of the production linkage, there are two variations: upstream and downstream. Upstream production linkages are found in the nonfarm sector where agricultural output is used as input for a nonfarm activity (Woldehanna, 2000). On the other hand, the downstream linkage represents nonfarm inputs, such as agrochemicals, nourishments, and pumps used in agricultural production. To supply agro-processing and delivery services, the nonfarm sector requires investment (Davis J. R., 2003; Reardon T. 1997). Upstream and downstream production linkages are mostly relevant to local agriculture (Li et al., 2017; Reardon T. 1997). High productivity can arise when nonfarm and farm expenditure reduce across sectors. For example, if a farmer buys product related to a nonfarm activity, income can be generated from the farming activity. Depletion linkages are made when expenditure is related to a reduction in the household income. Farm income increases the demand for basic goods and services, hence resulting in new ways of consumption (Woldehanna, 2000). Superfluous returns from nonfarm activities can be used in farm activities, thus aiding agriculture production (Davis J. R., 2003). Productivity and expenditure depend on the circulation of income. Most of the Pakistani farmers are not only very poor but also illiterate. Education represents an important contribution to agricultural production knowledge and provides income generation (Khalid & Mehmood, 2010; Panda, 2015). The poor invest mostly in local goods and services, but rich households are more likely to invest in urban and modern production sectors. According to Chandio et al. (2018), education and household income generation have a positive relationship in Pakistan’s rural area. Educated farmers adopted more nonfarm professions than those without education. With reference to Davis J. R. (2003), if high amounts of external inputs are required for agricultural production, upstream linkages may occur. Agricultural output requires income before production can be sold, therefore inducing downstream production linkages (Gollin et al., 2014). If growth in the agricultural sector is profitable and leads to rural income growth, then the expenses and potential investments will be outweighed by expenditure. A probable reaction to the struggle for labor and credit leads to a positive impact of nonfarm income on the flattening of the household structure and is suggested in the literature (Ellis, 1998; Rada et al., 2012).
Time and land factors are important for understanding nonfarm activities. When the market is experiencing scarcity, then nonfarm income affects agricultural production, and the effects can either be direct or indirect. The direct effects of nonfarm income are budget constraints and the pressure to buy large amounts of normal goods. The indirect effects are more complex, pressuring requirements such as security and investment in farm inputs. According to Reardon et al. (1994), it is a great challenge for households to work in both the nonfarming and farming sectors because of their inadequate resources, capital, and labor. Inadequate resources need to be reorganized to contribute to nonfarm activities, which would inevitably lead to the withdrawal of critical resources from farming if high returns from nonfarm activities are secured. In addition, due to constraint of financial resources, development of Agricultural technology invention and development are limited. (de Janvry & Sadoulet, 2010; Lakitan, 2019). The high returns and productivity of nonfarm activities might also reduce the resources devoted to farm activities (Novignon, 2017; Reardon et al., 2001). Attractive incentives and labor resources trigger the decision to engage in nonfarm activities (Guo et al., 2011). In fact, some farm households contribute to the nonfarm economy without any evident incentive. Participation in nonfarm activities provides livelihood opportunities for poor rural households. It plays a pivotal role in economic development and poverty alleviation if nonfarm prospects are available to rural poor households (Islam & Haider, 2018). Therefore, rural households’ engagement in nonfarm activities can obstruct their own farms’ productivity (Ellis & Freeman, 2004). This would lead to a decline in agricultural production and therefore in farm income. It would also obstruct agricultural financial gain or development (Ruben & van den Berg, 2001). Relevant decision-making relies on the relative returns of the farm and nonfarm activities. In summary, the contribution of nonfarm economic activities to rural household income is influenced by many factors such as land, technology, resources, capital, and labor (Akudugu, 2016; Saqib et al., 2018). Due to higher numbers of attracted incentive and availability of labor forces, numerous opportunities act as push factors in the nonfarm sector more than the farm. Somehow, farm household contributes to the participation in nonfarm economic activity. Poor rural nonfarm household involvement and activities play a vital role in promoting growth and welfare and offer a pathway out of poverty if nonfarm opportunities are seized by the rural poor (Adams & He, 1995; Asadullah & Rahman, 2009; Chandio et al., 2019; Rose et al., 2019). In previous decades, studies indicate evidence of nonfarm activities affecting agricultural growth, inequality, poverty, and the magnitude of such linkages positively or negatively by either boosting or reducing production (Adams, 1993; Arif et al., 2000; Che-Mat et al., 2012; Iqbal et al., 2017). Nevertheless, studies related to nonfarm household indicate that income influences agricultural production in rural areas of Pakistan. Therefore, our study tries to minimize the research gap and make a linkage with the nonfarm income and agricultural production.
Data
The current study collected data from the PSLM 2017–2018. 1 The Pakistan Federal Bureau of Statistics developed a sampling framework for rural and urban areas, splitting each area into sampling blocks, and gathered detailed information about the agricultural and nonagricultural sectors, such as income generation and expenditure. The PSLM 2017–2018 covers 579 sampling blocks, 8,687 households, and 37,128 individuals. Among the households, 5,069 are from rural areas and 4,056 from urban areas. This research uses a questionnaire as the instrument for data collection. It focuses on both the farming and the nonfarm activities carried out by the rural households.
Theoretical Background
The model we used in our research is advocated by Huffman (1991); it shows the different farm and nonfarm activities to which farm households devote their time. This model considers a household’s agricultural production, consumption, and nonfarm activity in a single framework. The relevant information is provided by the households. Basically, two types of activities are considered in this research: farm work and nonfarm work. The household utility functions are implied based on the information provided and comprise the consumption of goods Q and leisure, H in the equation U = U (Q, H). The utility is maximized subject to the household’s financial plan, capability, time, and limitations. The time constraint is T = L1 + L2 +H, where T = the total time used in farm and nonfarm work, L1 and L2, respectively, and H = leisure, as we mentioned before. The cash income representing the financial constraint on the household can be articulated as

where p = price; w1 and w2 = returns to farm and nonfarm work; y1 and p1 = farm output production and selling price for farm output annually; and R = nonlabor income.
Farm work, nonfarm work, and leisure represent variable proportions (first-order condition):

For the farm and nonfarm activities, the first-order condition can be reformulated as follows:

The labor supply functions for the three activities to which households devote their time in terms of farm work and nonfarm work can be derived as follows:


According to Huffman (1991), i indicates a household with a positive value for nonfarm activity, and a positive number of nonfarm hours will be observed for household i if the potential nonfarm wage

We cannot observe differential wages. The index function can be specified, and i is an unobservable variable:

where Z1 = vector variable (location effect on the nonfarm income) and µ i = random disturbance term. From the linear function, we can begin to analyze the impact of farm and nonfarm income.

where Yi = income of the household farm, Li = dummy variable that equals 1 if the household has nonfarm income and zero otherwise, Xi = vector of assets, individual or household characteristics and location characteristics, λ i = unidentified factors of the vector and ε i = error term.
Method of Empirical Estimation
The contribution of nonfarm income to a rural household’s income can be projected by using per capita income. The household’s engagement in agricultural production and other activities are proxied for due to the systematic variance across households and communities engaged in agricultural production. The Heckman (1979) two-step procedure was used for estimation. The decision-making behind a farming household’s participation in nonfarm work needs to be estimated, so a decision model is identified in two phases: first, a regression, and second, model selection and observation of the impact of the nonfarm income on the per capita farm income.
This study chooses the probit model. i = (observation) the probability that households obtain nonfarm income; if the household obtains nonfarm income, then y1 = 1; otherwise, yi = 0. Zi is used to estimate the probability. Adopting the normal cumulative density function for the probit model, F:

where ϕ = cumulative density function and β = vector of an unknown parameter.
The cumulative density function ranges from 0 to 1, so we can write the function as follows:

where β = maximum likelihood.
The probit model is the empirical model used to estimate nonfarm income, as follows:

where j = primary, agehd = householder age, agesq = householder age squared, educhd = household education, hhsize = size of household, ach = access to credit, tel = telecommunication facility, mkt = market, bnk = bank, tr = motorable road, ptrans = public transportation, elec = electricity, ezones = ecological zone, ε = error.
A sample selection is needed for using Equation 8. The constraints on the dependent variable are only experimental, and the sampling is not random, as households may not be randomly selected but rather self-selected to obtain nonfarm income. To address this potential bias, the inverse Mills ratio (lambda) can be used. The inverse Mills ratio is another way to generate the selection term in Equation 8 and the farming income per capita in Equation 9 in the second stage. Heckman’s two-step procedure is used to validate this choice based on the evidence of potential self-selection.
Addressing Potential Endogeneity
Addressing the potential endogeneity problem is imperative for all studies. In fact, an independent variable in the model may be correlated with the error term. In the data set, the dependent variable for all the data points is observed, and the nonfarm income effect on farm income has a strong likelihood of entailing an endogeneity issue. Farm income can be invested in the nonfarm economy, and nonfarm income can be invested in agricultural production, potentially yielding effects in two different directions. To solve the endogeneity problem, Equation 9 is formulated, where y = a continuous variable forecasting the value of nonfarm income. Ordinary least squares (OLS) regression is used in the second stage to obtain the per capita income equation as follows:

Estimating the Heckman Sample Selection
Nonfarm income can be an independent variable, and its impact on farm income is projected within the linear regression framework using the forecast values. Equation 10 shows the linear regression.

here, i = household, payi = agricultural income per capita, educhdi = education, hhsize = household size, fsize = farm area, vfinv = value of farm investment, fbo = farm base organization, ezones = economic development zone, prdnfe = nonfarm income of the predicated value based on Equation 9, y = continuous variable, λi = parameters of coefficients, invmills = inverse Mills ratio in the second stage, µ = distribution.
The estimated parameters of λ9 can be used to measure the influence of nonfarm income on household per capita farm income. According to Wooldridge (2005), the inverse Mills ratio is a self-selection term to which participation in certain programs or engagement in certain behaviors is not causally determined. Wooldridge (2005) further explained that the term is mostly used when a binary indicator of the variable is systematically correlated with unobserved factors. In our study, farmers were selected by their own choice and may or may not be farm households. In Pakistan, nonfarm households tend to have a relatively high income. If λ is not an exogenous variable, then Equation 10 following the OLS method will yield inconsistent outcomes and biased estimates.
To ensure the reliability of the results, the Heckman sample selection model (two-step procedure) by Heckman (1979) and Maddala (1983) is used, and then, sample selection is estimated. Equation 11 is then self-explanatory:

where y* = nonfarm participation; Z = independent variable (the influence of participation in nonfarm activities); β = unidentified parameters; u = error as µ(0,Ϭ2).
The probit model is shown in Equation 11. If the household obtains nonfarm income, then the participation estimates equals i, otherwise, 0, regressed on the independent variables. Equation 11 shows that nonfarm income is an exogenous variable, and a household whose members earn nonfarm income can improve its farm activity and enhance agricultural production.
Results and Discussion
This section provides the descriptive statistics and demographic information of the respondents (see Tables 1 and 2) and the probit regression results are also discussed here, and the OLS regression for per capita nonfarm and farm incomes are presented. The probit regression model estimates the probability of a household receiving nonfarm income, while OLS regression estimates the impact of nonfarm income on farm income. The nonfarm income received and per capita agricultural yield is shown in Tables 3 and 4 from the probit estimation and Heckman selection model, respectively. According to Nakosteen and Zimmer (1980), in the second stage of the estimation procedure, multicollinearity issues may arise due to the inclusion of all predictor variables in both equations for the decision-making concerning farm income. Consequently, many aspects are included in the regression of the nonfarm income decision equation, such as access to credit, telecommunications, bank, electricity, motorable roads, and convenience of public transportation, which are not included in the farm income equation.
Descriptive Statistics of Independent Variables for Econometric Analysis.

Source. Social and Living Standards Measurement Survey (PSLM, 2017–2018).
Descriptive Statistics of Independent Categorical Variables for Econometric Analysis.

Source. Social and Living Standards Measurement Survey (PSLM, 2017–2018).
Probit estimates of Nonfarm Income Contribution Decision Assessment.

Source. Social and Living Standards Measurement Survey (PSLM, 2017–2018).
LR = late distant recurrence.
significant at 10%. **Significant at 5%. ***Significant at 1%.
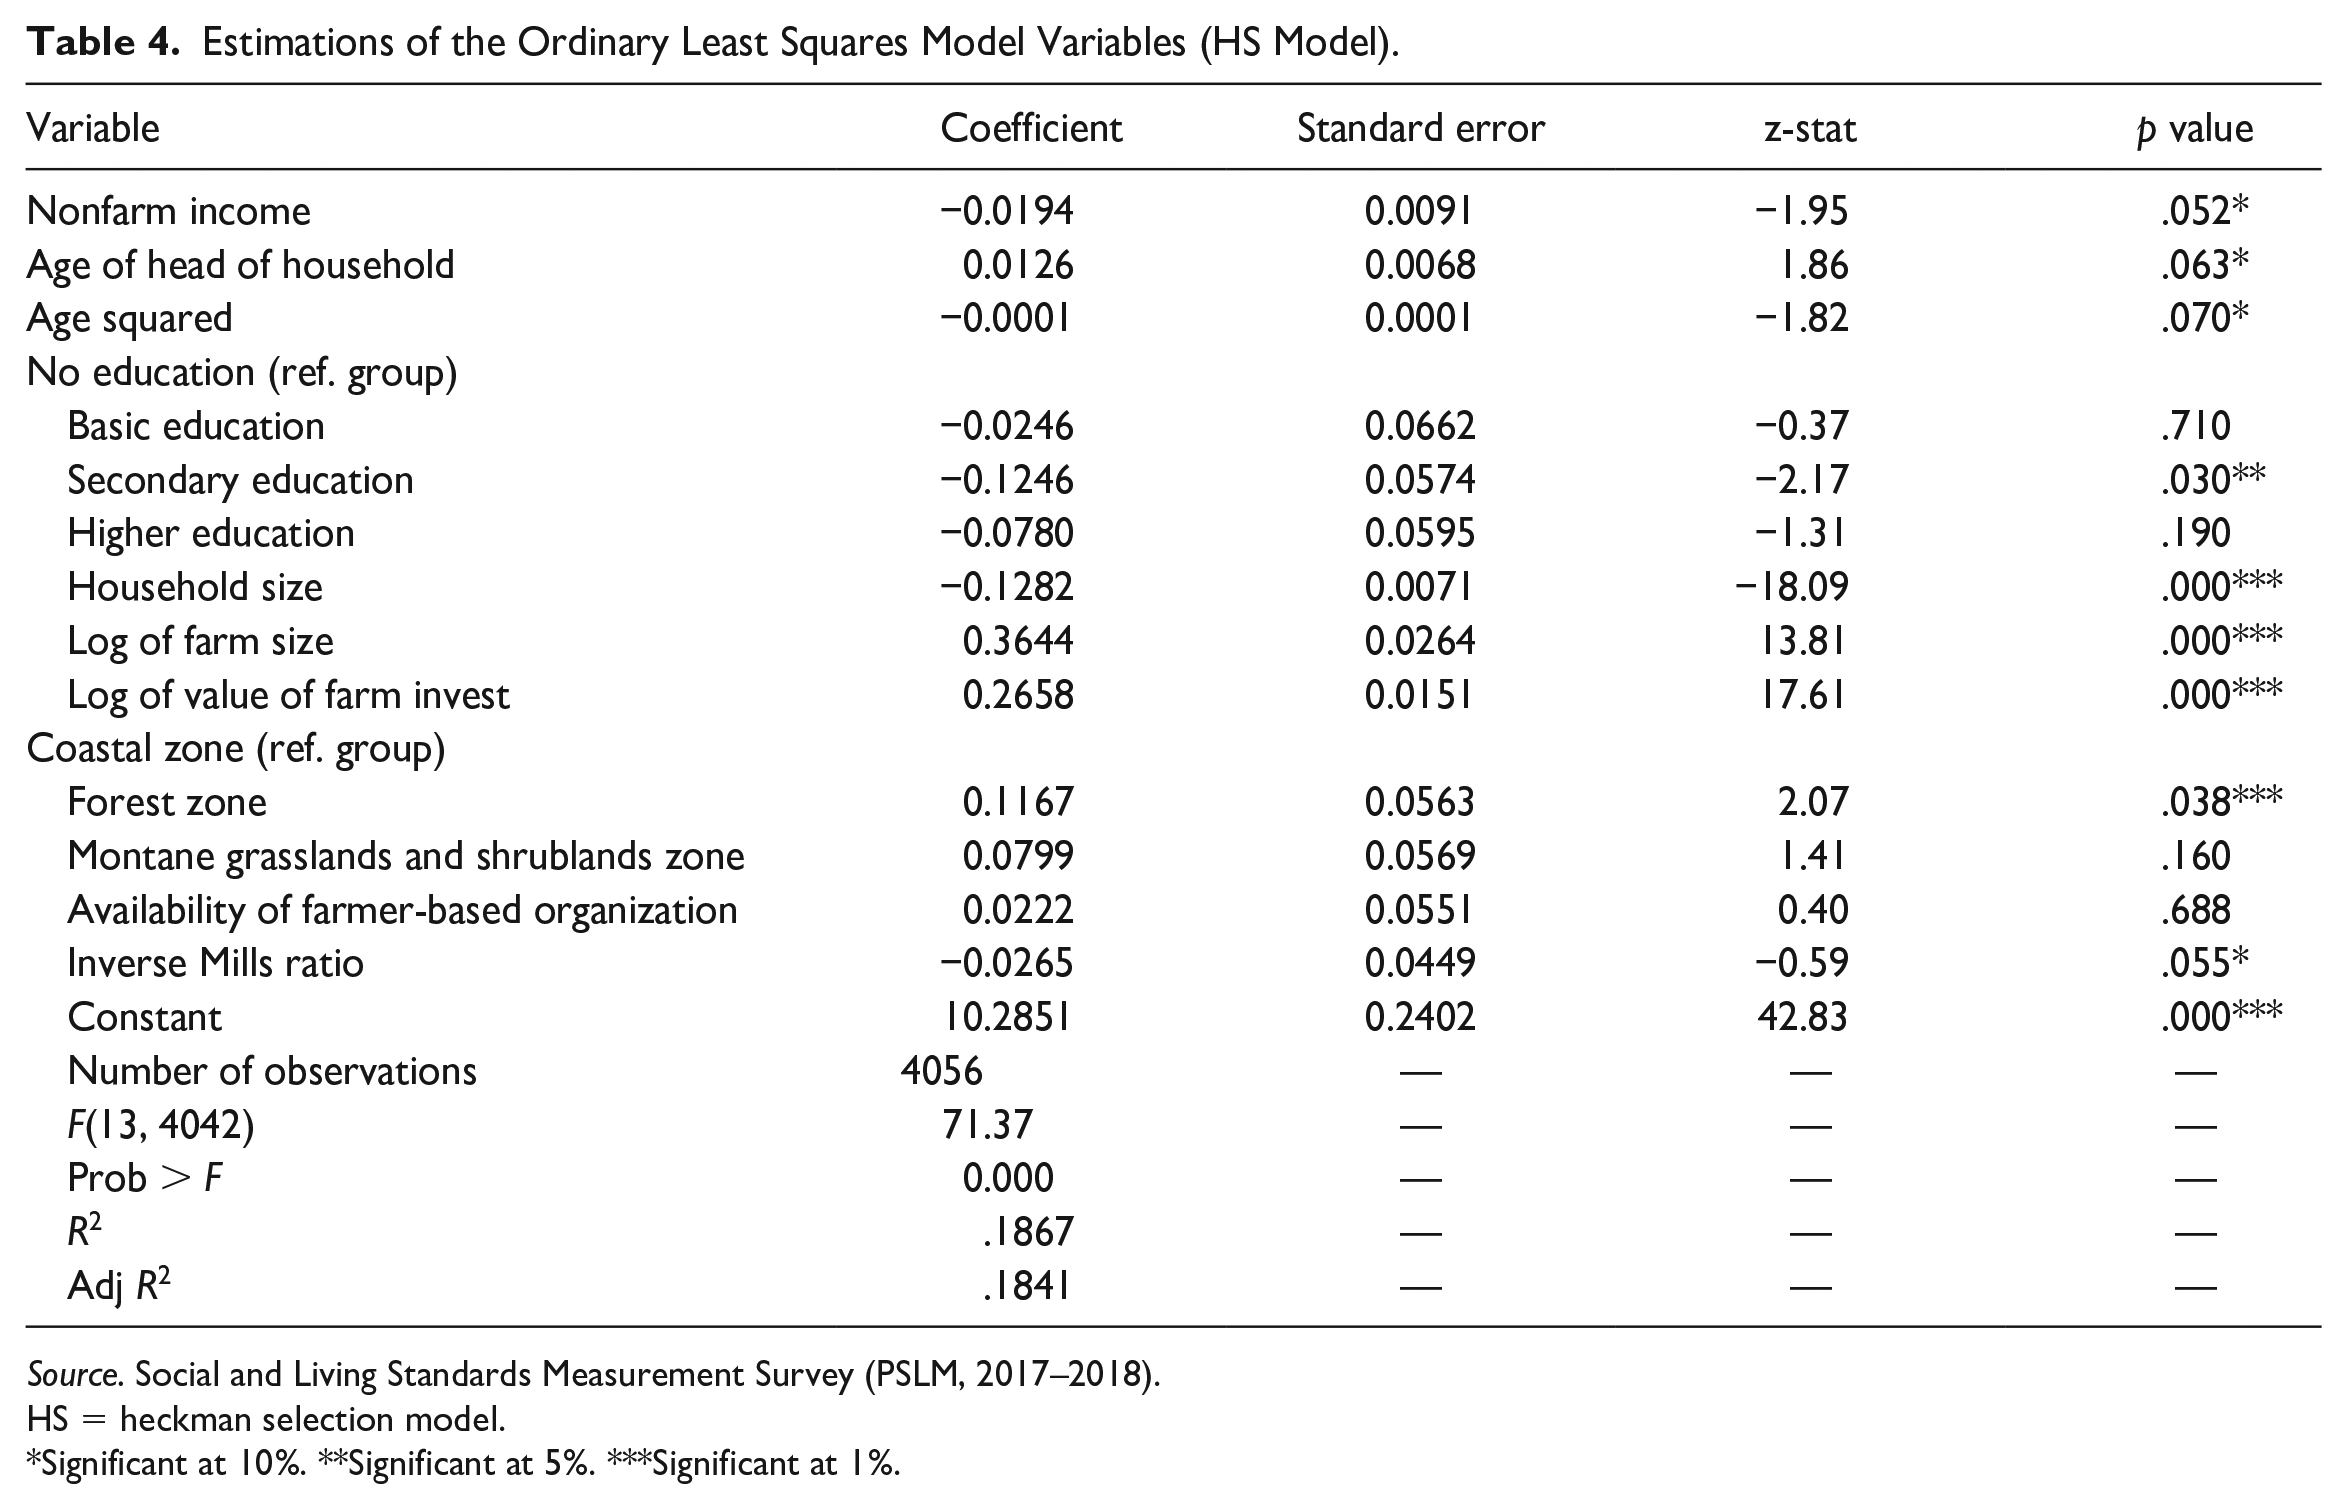
Estimations of the Ordinary Least Squares Model Variables (HS Model).
Source. Social and Living Standards Measurement Survey (PSLM, 2017–2018).
HS = heckman selection model.
Significant at 10%. **Significant at 5%. ***Significant at 1%.
Probit Model Estimates
Most households rely on convenient access to banks, motorable roads, and telecommunication. The estimation shown in Table 3 indicates that access to these variables increases the likelihood of a household to obtain nonfarm income. On the other hand, it is highly probable that telecommunication access will decrease with nonfarm income, as indicated by the negative coefficient of the variable for telecommunication. Likewise, the bank variable is significantly negative. Rural households may engage more in farm activities when they have easy access to urban centers where they can sell yields to consumers. Banks provide less credit to farming households than to nonfarming households, indicating a negative association with the farm sector.
On the contrary, banks provide easy access and financial support to nonfarm household and there is, therefore, a positive association between them and nonfarm income households (Akram et al., 2011; Foster & Rosenzweig, 2004; Iqbal et al., 2017). According to the government of Pakistan, the daily wage of labor was $2 in 2016–2017, indicating poverty. Many rural households lack education and food security. Most household members are illiterate and lack access to infrastructure, such as roads, markets, and telecommunication. They cannot directly participate in the economy through nonfarm activities. Household participation in nonfarm activities increases with time due to the rapidly increasing accessibility to motorable roads. This shows a sign of development. This development will enable household members and entrepreneurs to engage in nonfarm activities.
The variables for being located in the coastal zone and forest zone have a positive sign. Moreover, the coefficients for montane grasslands and shrublands zone are significantly positive. A comparison between farm households in the coastal zone and those in other provinces suggests that the former tend to have PKR¢0.1614 less nonfarm income. Similarly, households in the montane grasslands and shrublands zone tend to have PKR¢0.2182 less nonfarm income. According to the World Wildlife Fund (2001), it is not clear whether households in the montane grasslands and shrublands zone would participate more in nonfarm activity. Households in the forest and coastal zones may actively engage in nonfarm activity, but those in forest zones may be less interested in doing so. Nonfarm income contributions are considered in the first stage of Heckman’s two-stage model, which grasps the drivers of participation in nonfarm activity by employing the binary probit equation in Table 3. Table 4 shows the results of the equation for per capita farm income and the inverse Mills ratio used to address the self-selection issue.
Impact of Nonfarm Income on Agricultural Productivity
Table 4 shows the regression for the impact of nonfarm income on agricultural productivity. Many studies support that nonfarm income can decrease or increase farm income. According to data from the PSLM 2017–2018 and the Pakistan Federal Bureau of Statistics, women are few in the professional industry sector, which is dominated by men, and engage little in farming. They often switch from the farm sector to the nonfarm sector. The income in the nonfarm sector is projected to rise in the future. This article addressed the Endogeneity problem of nonfarm income with the OLS method and used the Heckman model to determine exogenous variables from the projected income values. Table 5 shows the regression results.
Ordinary Least Squares Regression of Nonfarm Income and Other Descriptive Variables.

Source. Social and Living Standards Measurement Survey (PSLM, 2017–2018); Author 1 calculation.
Significant at 10%. **Significant at 5%. ***Significant at 1%.
Table 4 shows that per capita nonfarm income is negative and significant at the 10% level. An increase in nonfarm income per capita of PKR¢1 makes farm income per capita to decrease by PKR¢0.0222. According to Mishra and Park (2005) and Al Mamun et al. (2018), daily participation in nonfarm work reduces farm activity and agricultural production. The research findings in this article support this argument. Lisa Pfeiffer et al. (2009) show the same result, that participation in nonfarm activities has negative effects on the agricultural sector and decreases the labor supply on the farm. Concerning the effect of nonfarm income on farm household income per capita, Heckman’s two-stage procedure also suggests OLS. The coefficient of the selective variable is significantly negative. This study selects the Heckman model, supported by the statistical significance of the coefficients. The negative coefficient suggests the existence of unobserved variables having different effects on nonfarm income decisions and the contribution to farm income. The coefficient for the age of the household head is significantly positive at the 10% level, indicating the importance of age in the farm sector.
The positive coefficient indicates that a year increase in the age of the household head leads per capita farm income to rise by PKR¢0.01. A nonlinear, U-shaped relationship between age and per capita farm income is suggested by negative and significant coefficient of the age square. This also suggests that younger household heads do not participate in the nonfarm sector, but older household heads enter the nonfarm work sector as they have less of the physical strength necessary for farm activity. Sumner (1982) and Abdulai and Delgado (1999) obtain the opposite finding that younger members of farm households tend to participate more in off-farm work, but as they grow older, they work more on the farm. For education, the reference category is not education; a household head with secondary education decreases farm income by PKR¢0.1246. Therefore, secondary education has a negative impact on per capita farm income for farming households, as it leads to increased involvement in nonfarm work and accordingly decreases the involvement in farm work. Similarly, Lanjouw (1999) found that high levels of education and engagement in the economic sector have a positive impact on income but a negative impact on the agricultural sector. Islam (1997) find similar results but add that secondary education can promote entrepreneurship, which increases the farm income of the farm household (Panda, 2015). On the other hand, primary education improves labor productivity (Rashidin et al., 2019). With a p value less than 1%, household size has a negative impact on per capita farm income. This suggests that an increase in household size leads to a decline of PKR¢0.13 in per capita income. It has been shown that the elderly and the young are not active income generators and cannot do hard work in the farm sector. Larger households indicate elderly and adolescent individuals (Van Tran et al., 2019) and therefore a lower value of per capita output in the agricultural sector. Younger members of farm households also attend school and hence cannot participate actively in income generation, yielding a negative effect on household income.
According to Delgado et al. (1998), the married poor raise more children because children may care for their parents in their old age and provide more labor support. In most farming households, children need to take time to care for their elderly parents, thus decreasing the opportunity to earn extra per capita income. This is one reason why low-income households have difficulty making additional reinvestment. There are numerous opportunities for large farm households, such as diversification, as they can produce crops year-round and off-season. In addition, farms of large size anticipate higher agricultural income per capita in all fields. Table 4 shows that the log of farm size is significant at 1% and has a positive impact on per capita farm income. When the farm size increases, the household farm income per acre rises by PKR¢0.3644. Households with large farms have more productive farmland, which leads to higher per capita income in the agricultural sector. The key finding is that land represents the primary input of agriculture. The log of the value of farm investment (coefficient of the variable) is positive at the 1% significance level. When the log of the value of farm investment rises, farm income per capita rises by PKR¢0.2658. Thus, the more investment a household makes, the higher its per capita income and agricultural productivity. However, this result is not consistent with Lien et al.’s (2010) findings, which show that more investments in the farm sector decrease the per capita income in the farm sector. Being located in the montane grasslands and shrublands zone or in the forest zone has positive coefficients, but the coefficient for the former zone is not significant. Households located in the forest zone can increase their per capita farm income by PKR¢0.1167, and there is a significantly positive coefficient, unlike households located in the coastal zone. According to Seini (2002), this result indicates that climate and geographical conditions significantly affect agricultural production, either positively or negatively. Climate has a higher impact on agricultural production (Rashidin et al., 2018)
Conclusion and Recommendations
Rural nonfarm household income is a crucial driving force for sustainable economic development and income growth in Pakistan. Nonfarm activities, development of agricultural production, and strengthening food security are also of key significance. Cross-sectional data show that in rural areas of Pakistan, a household’s engagement in agricultural production reduces its engagement in nonfarm activities. Sustainable agricultural production must be enhanced in Pakistan; it is alarming that, with its increasing population and limited food supply, Pakistan is still import oriented. To meet the increased demand, long-term initiatives for sustainable agricultural production must be taken. To develop sustainable agricultural production, SMEs and the men and women in the general population must dedicate more attention to the farm. The norms, culture, and value systems of Islamic countries vary from those of Western countries. Women face great limitations that keep them from actively participating in the agricultural sector, even though they strongly support their households. A report on Samaa Tv (“Population Census,” 2017) noted that the population ratio in Pakistan is 105 men to 100 women; without the active participation of women, the country cannot develop.
The agricultural sector entails high uncertainty; hence, most households prefer to invest in the nonfarm sector, which is less risky. However, these two sectors are competitive. The current research findings are consistent with those of previous studies and recommend that policies must be designed to specifically target agriculture. For instance, financial institutes need to support agricultural production, and training institutes need to provide training in sustainability for farmers. Moreover, educational institutes play a pivotal role in the agricultural sector (Lakitan, 2019). There is a dire need to improve and reemphasize school education and include agriculture-related topics at the school level to encourage students to pursue higher education in fields related to the agricultural sector. The Ministry of Education in Pakistan can take the initiative to include agricultural science topics in elementary education. More agricultural institutes also need to be established with modern technology, facilities, tools, and research funds to support researchers, and the existing institutes need to be upgraded with advanced technologies. Instructors should be skilled and acquire extensive knowledge through proper training and development. Finally, the nonfarm sector is rapidly growing in Pakistan, but it should not be promoted at the expense of agriculture, as these two sectors are not supplementary in rural Pakistan. Nonfarm participation slightly reduces farm income.
Originality of the Study
There are various studies related to nonfarm household income, poverty, and inequality but a limited number of studies examine nonfarm household income and agricultural production in rural areas of Pakistan. We explored how Pakistan’s agricultural sector is influenced by other factors, and the changing economy indicated that nonfarm engaged households can also invest in the agricultural sector to increase production. Farm income can likewise be invested in the nonfarm sector, and the profits later reinvested in the agricultural sector. Moreover, we consider the impacts of other factors (income level, age, gender, location, etc.) that influence nonfarm income and agricultural productivity.
Practical Implications
This study can benefit agricultural policy makers and extension services in Pakistan. The Pakistan economy is based on agriculture, and policy makers can implement sustainable agricultural policy using this research as a reference. On the other hand, researchers and academia can obtain direction and further explore the reasons for the reductions in nonfarm income and agricultural productivity in rural areas of provinces other than the one where we conducted this study, thus increasing the validity of our research.
Footnotes
Declaration of Conflicting Interests
The author(s) declared no potential conflicts of interest with respect to the research, authorship, and/or publication of this article.
Funding
The author(s) disclosed receipt of the following financial support for the research, authorship, and/or publication of this article: This work was supported by the Manufacturing Input Servitization, Service Trade Barrier and International Production Segmentation (71973025), the National Natural Science Foundation of China and the Fundamental Research Funds for the Central Universities in UIBE of China (CXTD10-11), University of International Business and Economics of China.