
Abstract
Based on the pattern of difference in Chinese social trust, this study classifies the social trust into trust in family members, trust in acquaintances, and trust in strangers. Then, the correlational relationship between different types of social trust and subjective well-being is examined using the micro survey data in China. It is found that different types of social trust vary greatly in the correlation with subjective well-being. The main findings are as follows: (a) Trust in family members has no significant correlation with subjective well-being; (b) Only “totally trust acquaintances” has a significant positive correlation with subjective well-being; (c) Trust in strangers has a significant positive correlation with subjective well-being—the higher the trust level, the stronger the correlation with subjective well-being will be—and (d) Urban–rural and male–female differences exist in the correlational relationship between trust in strangers and subjective well-being.
Introduction and Literature Review
As a psychological experience resulting from the improvement in individuals’ conditions, subjective well-being (SWB) is increasingly becoming an important policy objective in many countries. In the 1970s, Bhutan proposed to replace gross domestic product (GDP) with gross national happiness. Subsequently, the United States, Britain, France, the Netherlands, Japan, and other developed countries started to develop different forms of happiness index. The United Nations also formally released the first World Happiness Report in 2012. Moreover, the Chinese government has paid more and more attention to the SWB of residents. President Xi Jinping said that “the original aspiration and the mission of Chinese Communists is to seek happiness for the Chinese people and rejuvenation for the Chinese nation” at the 19th National Congress of the Communist Party of China. In China, some local governments also regard the SWB of residents as one of the evaluation indicators for the performance of local officials (He, Na, & Hao, 2014).
In addition to SWB of residents, social trust is also an important part of a harmonious society. The establishment of a harmonious society requires the entire community to create a good trustworthiness system and strengthen the trust among people. Social trust refers to the trust in strangers or most people in society, which reflects the individual’s dependence on goodness of humanity (Huang & Deng, 2012). It has attracted the attention of many scholars for a long time. Moreover, there have been many achievements in the study of social trust, mainly including the five aspects as shown in Table 1.
Studies About Social Trust.

Many studies find that social capital has a significant correlation with SWB (Helliwell, Huang, & Wang, 2014; Maseda, Neira, & Salinas-Jimenez, 2013; Pena-López, Sánchez-Santos, & Membiela-Pollán, 2017; Sulemana, 2015; Winkelmann, 2009). But social trust as an important part of social capital or the result of social capital development (D. Li, Eden, Hitt, & Ireland, 2008; Maseda et al., 2013), is it also significantly correlated to SWB?
Some scholars (Kuroki, 2011; Usher, 2007; Yamamura, Tsutsui, Yamane, Yamane, & Powdthavee, 2015) have tried to answer this question. With the aid of the survey data from America (Usher, 2007) and Japan (Kuroki, 2011; Yamamura et al., 2015), they find that social trust can promote SWB, and there is a significant positive correlation between them. However, Churchill and Mishra (2017) point out that although a large number of existing studies agree that social trust positively impacts SWB, some studies suggest that social capital is a stronger determinant of SWB than income in developed countries. But, they think that this is not the case for China where the impact of trust on SWB is relatively weaker compared with the impact of income. In addition, some scholars find that the impact of social capital on SWB varied with different groups of people. The study by Elgar et al. (2011) indicate that social capital brings higher SWB to women than men, and higher SWB to older adults than younger people.
Meanwhile, Japanese scholar Fukuyama (1996) believes that trust is a behavior of individuals who make cooperation choices with other individuals for achieving the best interests of each other. In China, people often make different cooperation choices according to different social relationships (Fukuyama, 1996). Moreover, some researches on Chinese social trust also find that social trust is featured by the pattern of difference (Chinese name: Chaxu Geju) no matter in urban area or rural area (Fei, 2015; Qi & Lai, 2014; Wang & Zhou, 2009; Yu, 2017). The concept of pattern of difference, first proposed in the book Rural China of Fei, Xiaotong, offers a guide to think about the different social organization of Chinese and Western societies. He thinks that the Western society is a group structure, while in China it is a pattern of difference in terms of kinship and geopolitical distance. The former has a clear public–private boundary, consisting of independent individuals, while the latter is a privately ethical and self-centered social network. He finds that different social relationships connect Chinese people to the society through family ties, broader lineages, and regions. All of these ties represent extensions of consanguinity. According to the study by Fei (2015), Chinese first choose to trust family members, then acquaintance, finally strangers. In a word, according to the intimacy degree of social relationship, interpersonal trust decreases progressively from family members, acquaintances to strangers (Fei, 2015). To put it more vividly, Fei (2015) likens the pattern of difference to the ripples that are stirred up after throwing stones into water. From the center to the outside of the ripples, they are likened to (a) personal interest (the most central part of the ripples); (b) family members who are most connected with themselves; (c) a broader group of people related to them, such as friends, and work partners; and (d) strangers that are ubiquitous in the society and has no relationship with them (the shallowest part of the ripples). This kind of unique hierarchical social relationship structure in China leads people to always be self-centered, and to determine their affinity and trust in others according to their kinship and geographical distance. In other words, people have lower trust in those who are in the outer hierarchy (Wang & Zhou, 2009; Yan, 2006). Compared with the Western society, Chinese society is a prominent social structure. Fei (2015) likens this group structure to a bundle of firewood in the field. A single firewood is an individual, and the whole society is a collection of independent individuals. In such a Western social structure, Westerners are bound by the institutions within the group. Therefore, egoism is often attacked by the group and hard to exist. For example, Westerners often make decisions about trust or deception according to the collective interests of the state or company because they believe that the soundness and development of the group can guarantee the rights, responsibilities, and obligations of themselves, and the Chinese is often affected by kinship or geographical distance, thus generating the pattern of difference in trust (Fei, 2015). In view of the huge differences between Chinese and Western social structure and social trust, it is greatly significant to study the pattern of difference in Chinese social trust and the correlational relationship between social trust and SWB in the context of the pattern of difference, which can help us better understand China’s social structure and social trust. However, it can be seen that the above literature only study the trust in strangers without taking the possible pattern of difference into account in social trust, so that trust in family members and acquaintances is rarely studied, which is the inadequacy of these researches. Therefore, this study, based on the pattern of difference in Chinese social trust, classifies social trust into trust in family members, trust in acquaintances, and trust in strangers, so as to examine the correlational relationship between different types of social trust and SWB, respectively, and explore the urban–rural and male–female differences in these correlational relationships. These are the main issues to be solved and also the main innovations of this study.
In view of this, using the data from the survey of China’s Family Happiness Development Index performed by Renmin University of China in 2012, this study analyzes the following issues with the help of empirical methods: (a) How is the correlational relationship between social trust and SWB? Which one does have a stronger correlational relationship (trust in family members, trust in acquaintances or trust in strangers)? What is degree of their correlations with SWB? and (b) Do the urban–rural and male–female differences exist in the correlational relationship between social trust and SWB? These answers to these questions will help us understand the social trust in China and provide some reference for the government to make reasonable policy and improve people’s SWB.
In comparison with previous studies, the main contributions of this study are as follows: First of all, based on the pattern of difference in Chinese social trust, this study classifies social trust into three types (trust in family members, trust in acquaintances and trust in strangers), and then respectively analyzes and compares the correlational relationships between them and SWB; second, this study empirically examines the urban–rural and male–female differences in the correlational relationships between different types of social trust and SWB; third, in consideration of the correlation between family characteristics and individual SWB, this study controls not only the individual characteristics but also the family characteristics, so as to enhance the credibility of the study results.
The rest of this article is structured as follows: section “Data Source and Variable Description” introduces the data source and variables; section “Econometric Model” describes the econometric model; section “Empirical Analysis” is the regression results and analysis—this section quantitatively analyzes the correlational relationships between different types of social trust and SWB, and tests the robustness of the model—section “Urban-rural and Male-female Differences in the Correlational Relationship Between Social Trust and SWB” examines the urban–rural and male–female differences in these correlational relationships; section “Conclusion and Discussion” discusses the main conclusions of this study.
Data Source and Variable Description
Data Source
The data are derived from the survey of China’s Family Happiness Development Index. The survey is funded by the China Population Welfare Foundation and performed by the School of Sociology and Population Studies of Renmin University of China in 2012. The specific sampling steps of the survey are as follows: First, randomly select 16 cities in China as the survey sites; second, randomly select four districts/counties from each city; third, randomly select 600 eligible households from each four districts/counties. A total of 9,600 households were surveyed; finally, randomly select one eligible member from each household as the survey object. A total of 9,604 adults and their 2,372 children were visited, involving 22,347 family members out of the 9,604 families. In addition, the ratio of male to female is approximately one, and the number of urban respondents is basically the same as that of rural respondents. However, as the questionnaire for children only involves their trust in family members and does not involve their trust in acquaintances and strangers, this study ultimately conducts an empirical analysis using the survey data of adults. The number of study samples is 9,604, and all the empirical results in this article are obtained by Stata 14.0.
Variable Definition and Descriptive Statistics
Dependent variable: SWB
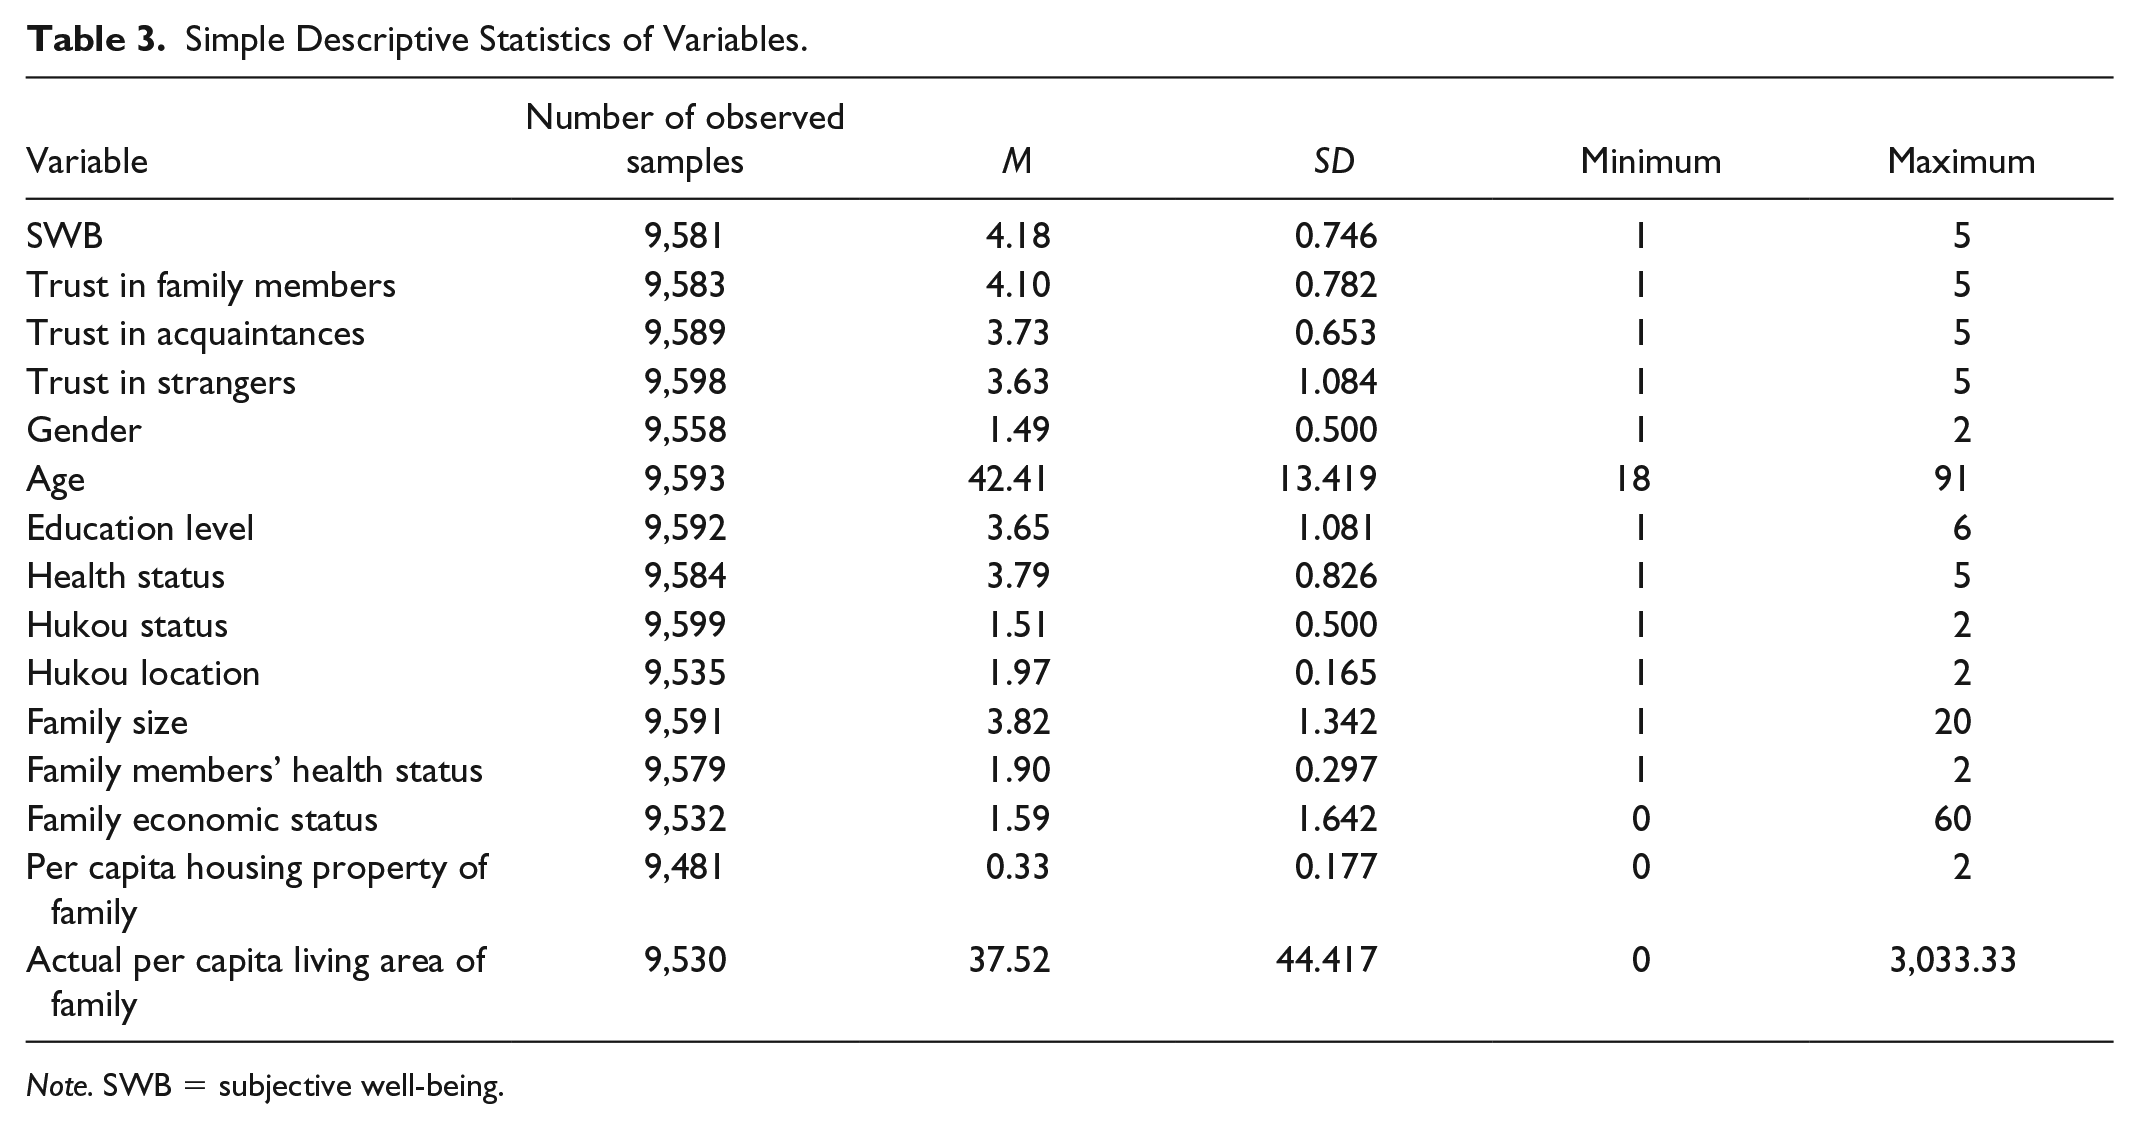
The dependent variable is SWB of respondents. Different from the absolute-income-based and relative-income-based utility theories proposed by early economics researches, this study uses SWB as the dependent variable to measure the level of personal happiness. According to the “income-happiness” paradox, as the standard of living increases, the marginal effect of income on happiness will decrease. Meanwhile, people will have higher spiritual needs in addition to material needs (Easterlin, 1974) and always compare their own situation with the situation of others. If their expectations are not met, even if their income increases, their happiness will decline (Xu & Xia, 2014). It can be seen from the above that happiness is subjective, which is a subjective evaluation on the quality of life according to individual standards. For instance, some people think that happiness is struggle and hard work, while others think that happiness is ease and stability. Different people have different understandings about happiness from different perspectives. It cannot be measured by single or composite evaluation indicators. Therefore, most of researches are based on individual’s SWB to study happiness (Dolan & Metcalfe, 2012; Llosada-Gistau, Montserrat, & Casas, 2015; Wu, Stephens, Du, & Wang, 2019). In this survey, respondents were asked, “How happy are you in your life?” Options are “extremely happy,” “quite happy,” “neutral” (not particularly happy or unhappy), “rather unhappy,” and “extremely unhappy.” In this study, SWB is defined as an ordinal discrete variable with five levels. The above options are coded 5, 4, 3, 2, and 1, respectively. A larger value means a higher SWB level. From the simple descriptive statistics in Table 3, it can be found that Chinese people’s SWB level is higher, and the average is between “extremely happy” and “quite happy.”
Core independent variable: Social trust
The core independent variable is social trust. Based on the phenomenon that Chinese social trust is featured by the pattern of difference, and combining with the settings of the survey questionnaire, this study classifies social trust into trust in family members, trust in acquaintances, and trust in strangers. It is worth noting that with the prosperity of industrialization and market economy, mass production and exchange activities make people’s interactions more frequent, and almost all countries are entering a “stranger society.” Most members in the stranger society have the characteristics of rational person, emphasizing contractual and normative cooperation. The importance of emotion is no longer as obvious in the agricultural society (Zhang, 2008), so that it is more difficult to distinguish acquaintances and strangers. Therefore, this study distinguishes acquaintances and strangers according to the extent to which respondents know others’ true situation and the size of their common social circle. Unlike strangers, acquaintances have more common communicative objects with respondents, and thus have a clearer grasp of respondents’ basic conditions. Even if two acquaintances become enemies and do not communicate with each other because of contradictions, it cannot be denied that they are acquaintances. On the contrary, if two persons have frequent contacts in commercial trade, but the relationship between them is limited to economic transactions, then they are still strangers. The distinction of the three types of social trust is as follows:
Trust in family members (trust_family): In the survey, the respondents were asked, “Do you trust your family members?” Options are “totally distrust,” “not very trust,” “slightly trust,” “relatively trust,” and “totally trust.” The above options are coded 1, 2, 3, 4, and 5, respectively. A larger value means a higher trust level.
Trust in acquaintances (trust_acquaintance): The respondents were asked, “Do you trust acquaintances?” The options and coding method are the same as above.
Trust in strangers (trust_stranger): The respondents were asked, “In general, how many people do you trust in the society?” Options are “Very few people,” “A few people,” “Half of people,” “Most of people,” and “Almost all of people.” Options are coded 1, 2, 3, 4, and 5, respectively. A larger value means a higher trust level.
It can be seen from the simple descriptive statistics (Table 3) that the level of trust in family members is highest, with a mean value of 4.10, followed by trust in acquaintances, with a mean value of 3.73, then trust in strangers, with a mean value of 3.63. These results are consistent with the pattern of difference in Chinese social trust proposed by Fei (2015). According to the study of Tong (2006), China is currently in a state of coexistence of particularized trust and generalized trust, dominated by particularized trust. Among them, the particularized trust is an internal bond established for the benefits of individuals. People will selectively trust some intimate people, while the generalized trust is the trust in the group of people who are less intimate. People’s relationship with this group is mostly alienated with less contacts. Therefore, the pattern of difference is formed in social trust.
More specifically, first, family is the most important part in Chinese social relationship structure. Due to the blood relation, there is often a certain emotional attachment between family members. Meanwhile, the Chinese society has always emphasized “a peaceful family will prosper.” Every member has their own unavoidable responsibilities for family. If some members choose to betray this relationship for their own interests regardless of blood relatives, then this will be a challenge to the family ethics prevailing in Chinese society. The above determines that there is a real and unbreakable trust relationship between family members; second, considering the emotional foundation and the existence of long-term related interests as a result of geographical distance or other factors, acquaintances often fall into an endless long-term game. The long-term thinking of Chinese makes them sacrifice their immediate interests and follow the code of conduct to avoid damaging the relationship between them. Meanwhile, after long-term interaction with a person, people often know whether the person has the basic qualities such as gratitude. Then, the risk of trusting the person is greatly reduced (Luo, 2012); however, Chinese people’s trust and betrayal are ultimately a game choice subject to emotional constraints and long-term interests. To be specific, according to the theory of mutual benefit (Hardin, 2001), Chinese are extremely individualistic. Therefore, the emotional attachment and the common ethics in the above-mentioned interaction with family members are meaningless in the interaction with strangers. The connection with a stranger is only a short-term economic exchange. In this exchange, people choose to trust a person simply because the interests of both parties are related, and betrayal is not such a strategy that can make more profitable in the game. However, if one party chooses to betray for greater profits, then the other party will face greater losses in the game. Therefore, based on the assumption of rational person, neither party will choose to trust each other. In Chinese society, there is only a short-term self-interested relationship with strangers, so the level of trust in strangers is low.
Control variables
To control the correlations of individual characteristics and family characteristics with SWB, control variables are added to the regression. Individual characteristics variables include gender, age, education level, health status, hukou status, and hukou location (i.e., household registration status and location). Meanwhile, for the purpose of examining the nonlinear correlation between age and SWB, the age square is also added in the control variables. 1 The family characteristics variables include family size, family members’ health status, family economic status, per capita housing property, and actual per capita living area of family. The specific definitions of control variables are shown in Table 2. From the simple descriptive statistics in Table 3, it can be seen that in 2011 the per capita income of family was RMB 15,900, and the per capita housing property and actual per capita living area of family were 0.33 and 37.52 m2, respectively.
Definitions of Control Variables.

In the questionnaire, there are three types of hukou status, namely agricultural hukou, nonagricultural hukou, and other (please specify). Among the 9,604 respondents, 23 selected “other (please specify),” of which four specified “serve in the army” and 19 specified “change hukou status from ‘agricultural’ to ‘nonagricultural’ due to land requisition.” In this study, the hukou status in the survey period shall prevail. In China, servicemen and servicewomen’s original hukou is canceled. They are registered in an army unit. Their hukou is categorized as “nonagricultural.” In addition, for the people whose hukou status is changed from “agricultural” to “nonagricultural” due to land requisition, their hukou is categorized as “nonagricultural.” Because the sample size is large, this categorization does not have a significant impact on the results of the study.
Simple Descriptive Statistics of Variables.
Note. SWB = subjective well-being.
Econometric Model
This study mainly examines the correlational relationship between social trust and SWB. Although the dependent variable (SWB) is discrete ordered data, Ferrer-i-Carbonell and Frijters (2004) find that, in the empirical study of SWB, no significant difference exists in the coefficient sign and significance of the parameter estimates regardless of using the ordinary least squares (OLS) regression model or the ordered regression model. Considering that the parameter estimates in the OLS regression can be more intuitively and conveniently explained, the OLS regression method is employed to estimate the parameters in the basic model, and the ordered probit model is adopted to test the robustness of the results. For the purpose of this study, the following econometric model is built to measure the correlational relationship between social trust and SWB:
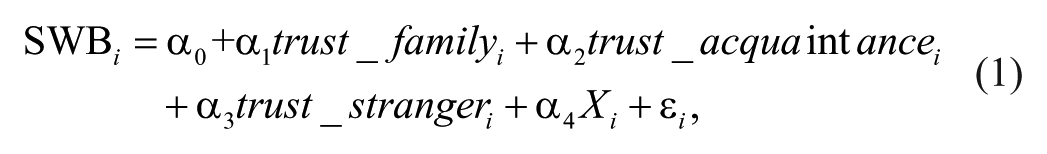
where SWB i represents the SWB level of individual i; trust_familyi, trust_acquaintancei, and trust_strangeri, respectively, indicate the levels of trust in family members, trust in acquaintances, and trust in strangers of individual i; Xi is the control variables of respondents, including individual characteristics and family characteristics; α0 denotes the constant term; ε denotes the error term. Furthermore, with due consideration to the significant urban–rural difference in China and the male–female difference in individual’s utility function, the urban–rural and male–female differences are analyzed using Equation 1.
Empirical Analysis
A Preliminary Study of the Correlational Relationship Between Social Trust and SWB
First, the SWB of respondents is regarded as the cardinal number, and the correlation between social trust and SWB is preliminarily examined using the OLS regression model. The results are shown in Table 4. In Model 1, the core independent variables are not added, and only the control variables are added for the regression analysis. In Model 2, only the variable of trust in family members and control variables are added, and then the variable of trust in acquaintances is added in Model 3 based on Model 2, finally the variable of trust in strangers is added in Model 4 based on Model 3. Moreover, the Pearson method is employed to measure the correlation coefficients of the independent variables in Equation 1, meanwhile the multicollinearity is also tested using the variance inflation factor (VIF). The results show that a serious collinearity only exists between the age square and age, while the absolute values of the correlation coefficients of the remaining independent variables are less than 0.5, and the VIF is far less than 10, indicating that no serious multicollinearity exists among the remaining independent variables. As can be seen from the regression results, the adjusted R2 in Model 1 is .0924, indicating that these control variables only explain 9.24% of the total variation of the dependent variable; the adjusted R2 is .1269, .1340, and .1459, respectively, from Model 2 to Model 4, indicating that with the gradual addition of independent variables (i.e., trust in family members, trust in acquaintances, and trust in strangers), the portion explained in the total variation of the dependent variable increases by 5.35%. In a word, trust in different people can indeed explain the fractional variation of SWB.
Parameter Estimates in the OLS Regression Model (All Samples).
Note. OLS = ordinary least squares; SWB = subjective well-being.
Coefficient estimate significant at 10% level. **Coefficient estimate significant at 5% level. ***Coefficient estimate significant at 1% level.
Table 4 lists the parameter estimates obtained through the OLS regression for all samples. First of all, for the levels of trust in family members, it can be seen that only in Model 2, the coefficient of “totally trust” passes the 5% significance test, and the coefficients of other trust levels (relatively trust, slightly trust, not very trust, and totally distrust) are not significant. However, if the levels of trust in acquaintances and strangers are introduced in Model 3 and Model 4, the coefficients of all levels of trust in family members are not significant at the 5% level. So, trust in family members has no significant correlation with SWB. And then, for the levels of trust in acquaintances, it can be seen that in Model 3, the coefficients of “relatively trust” and “totally trust” are significantly positive at the 5% and 1% levels, respectively. But, if the variable of trust in strangers is introduced in the Model 4, the coefficient of “relatively trust” is not significant at the 5% level, while the coefficient of “totally trust” still pass 5% significance test. This indicates that only “totally trust acquaintances” show a significant positive correlation with SWB. Finally, for the levels of trust in strangers, it can be seen from the estimates of Model 4 that, compared with “totally distrust strangers,” the coefficients of “not very trust,” “slightly trust,” “relatively trust,” and “totally trust strangers” all are significantly positive at the 1% level, indicating that trust in strangers has a significant positive correlation with SWB. Meanwhile, with the increase in trust level, the positive correlation between trust in strangers and SWB gradually improves. The estimated coefficients of Model 4 in Table 4 show that given that other conditions remain unchanged, the increases of correlation between “not very trust strangers,” “slightly trust,” “relatively trust,” and “totally trust” and SWB are, respectively, 17.28%, 20.35%, 28.75%, and 38.21% compared with “totally distrust.”
From the estimated coefficients of control variables, we can also find that female, middle school or above, good health status (good and very good), local hukou, family size, good health status of family members, per capita income of family, and per capita housing property of family are significantly positive at the 5% level in all models. The above indicates that women’s SWB is higher than that of men, local people’s SWB is higher than that of nonlocals, and higher education level, good health status of himself or herself and of his or her families, more family members, higher per capita income, and more per capita housing property of family are significantly positive correlated with people’s SWB. Table 4 also shows that with the improvement of people’s education level and health status, their correlation coefficients with SWB also gradually increases. Moreover, the estimated coefficient of age is significantly negative, while that of the age square is significantly positive. This indicates that the correlation between age and SWB shows a “U” shape. That is to say, as the age increases, people’s SWB declines first and then rises.
Robustness Test
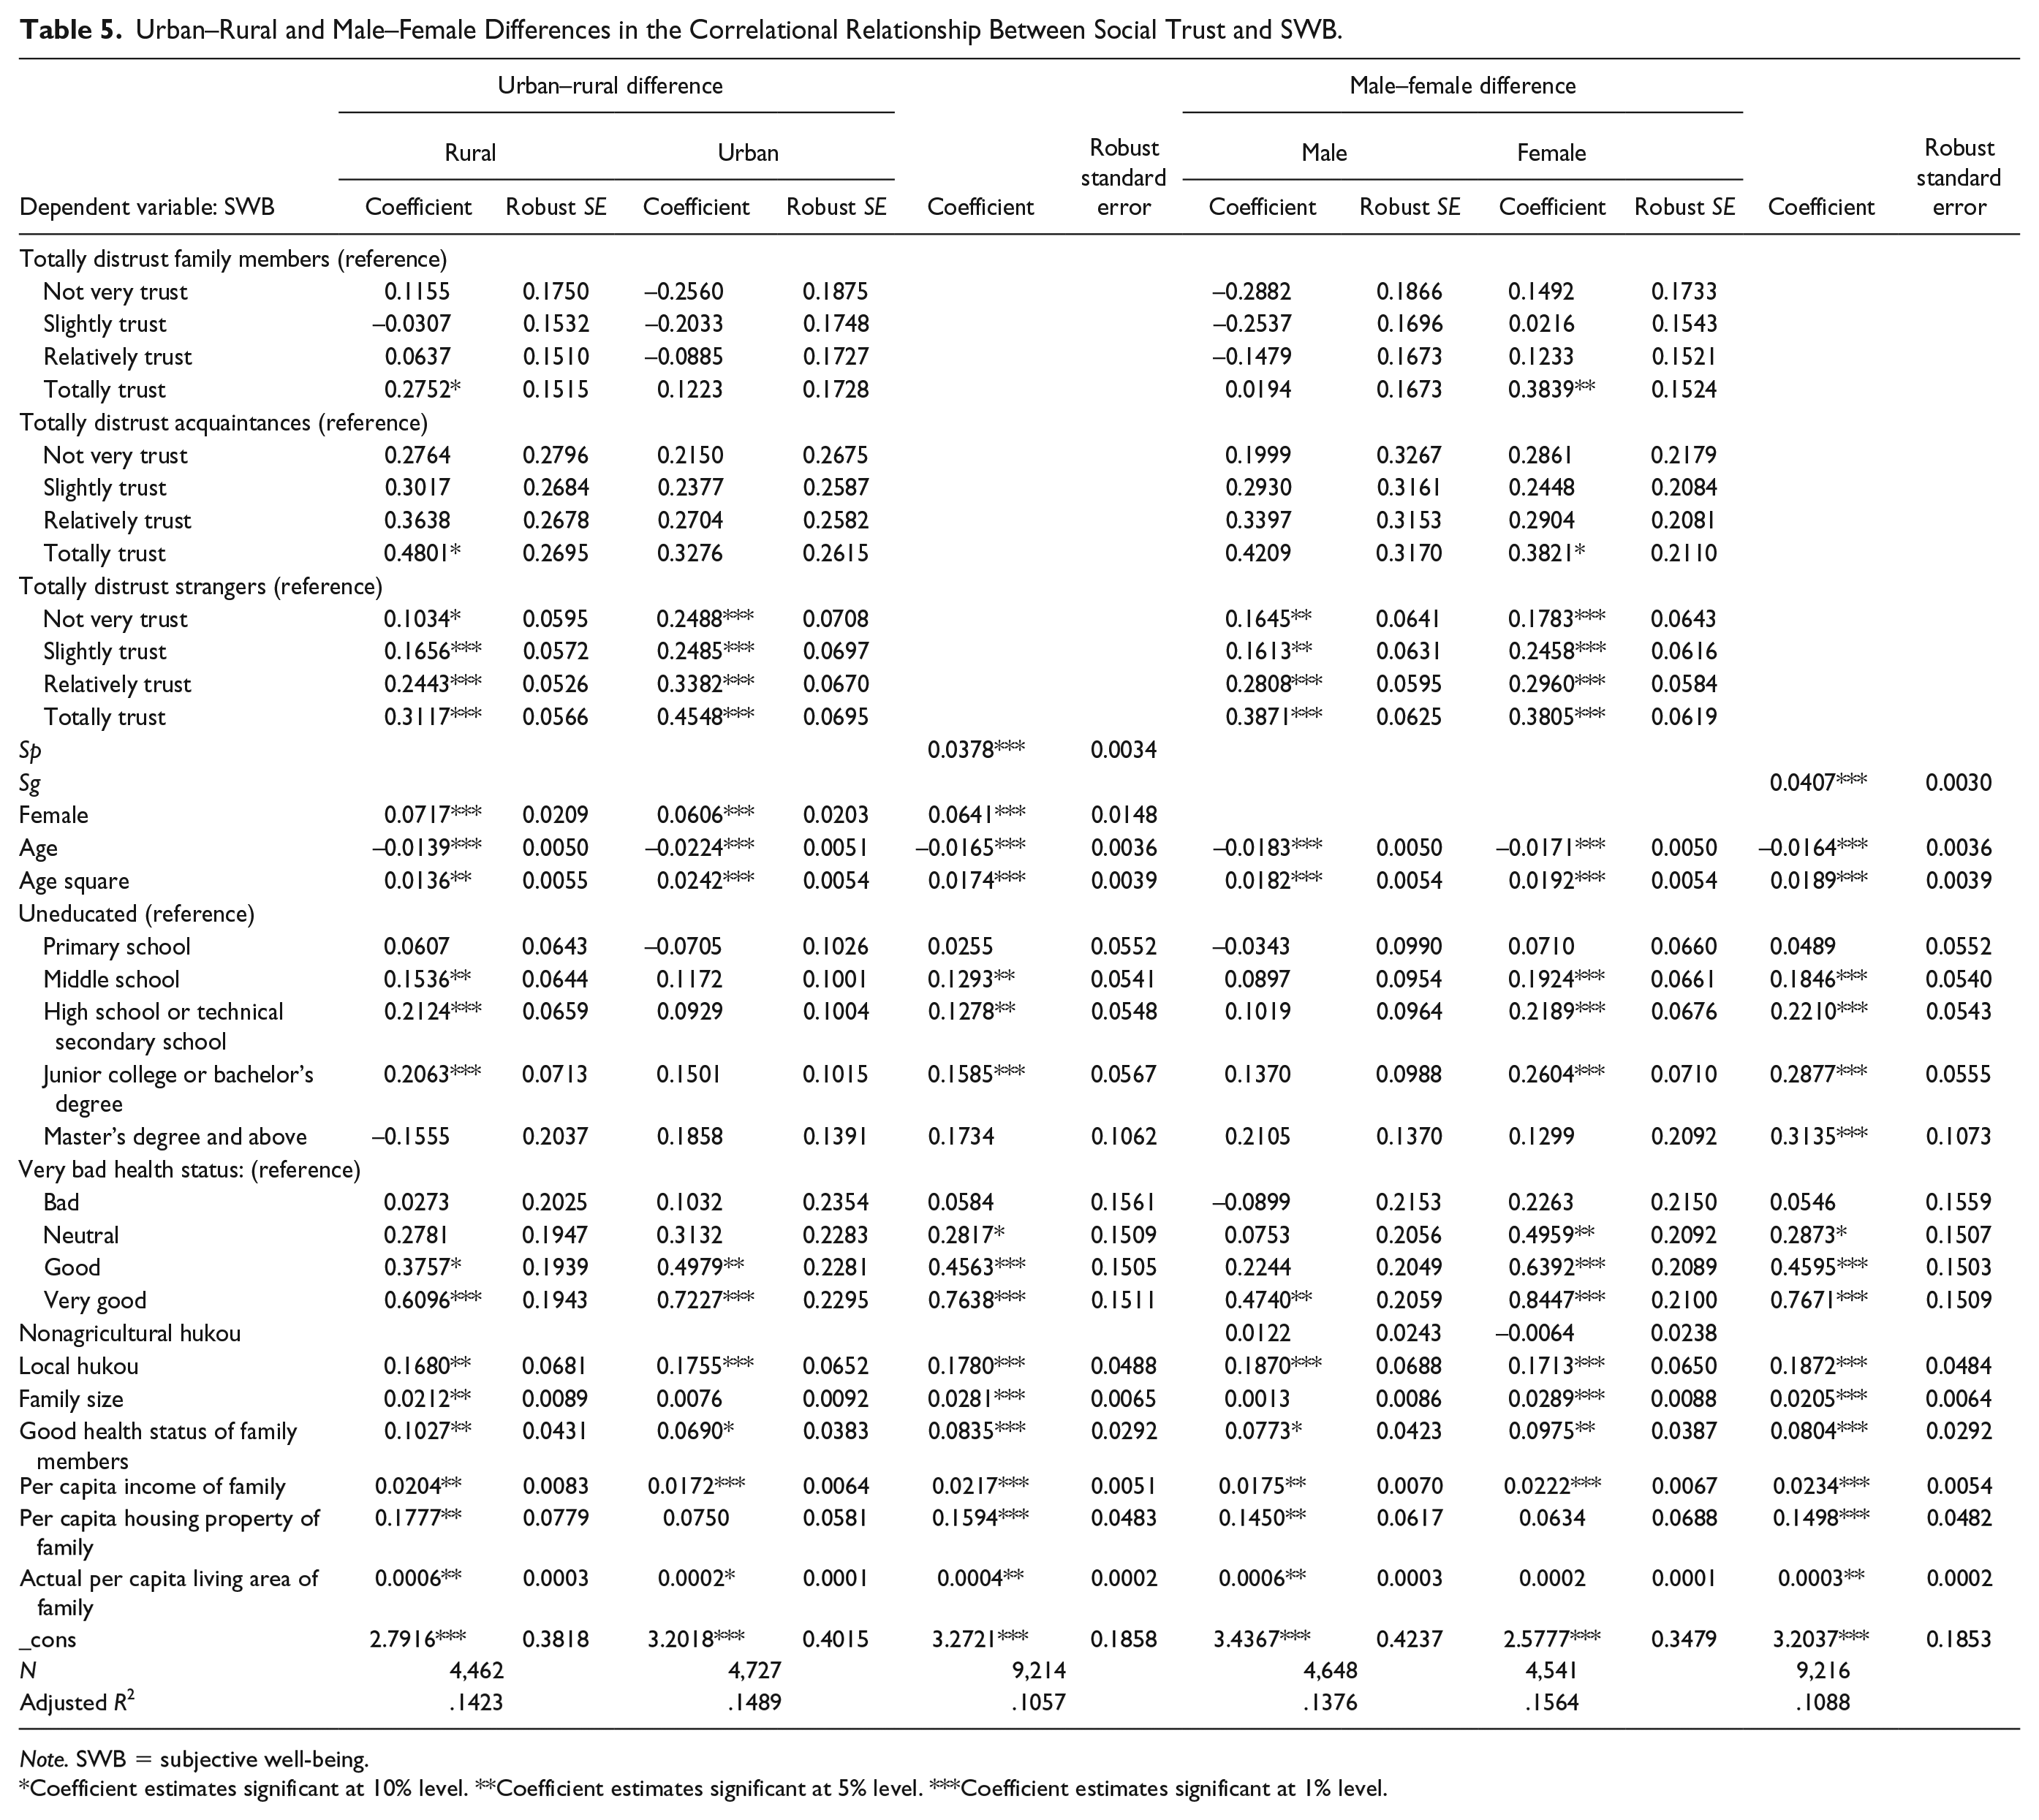
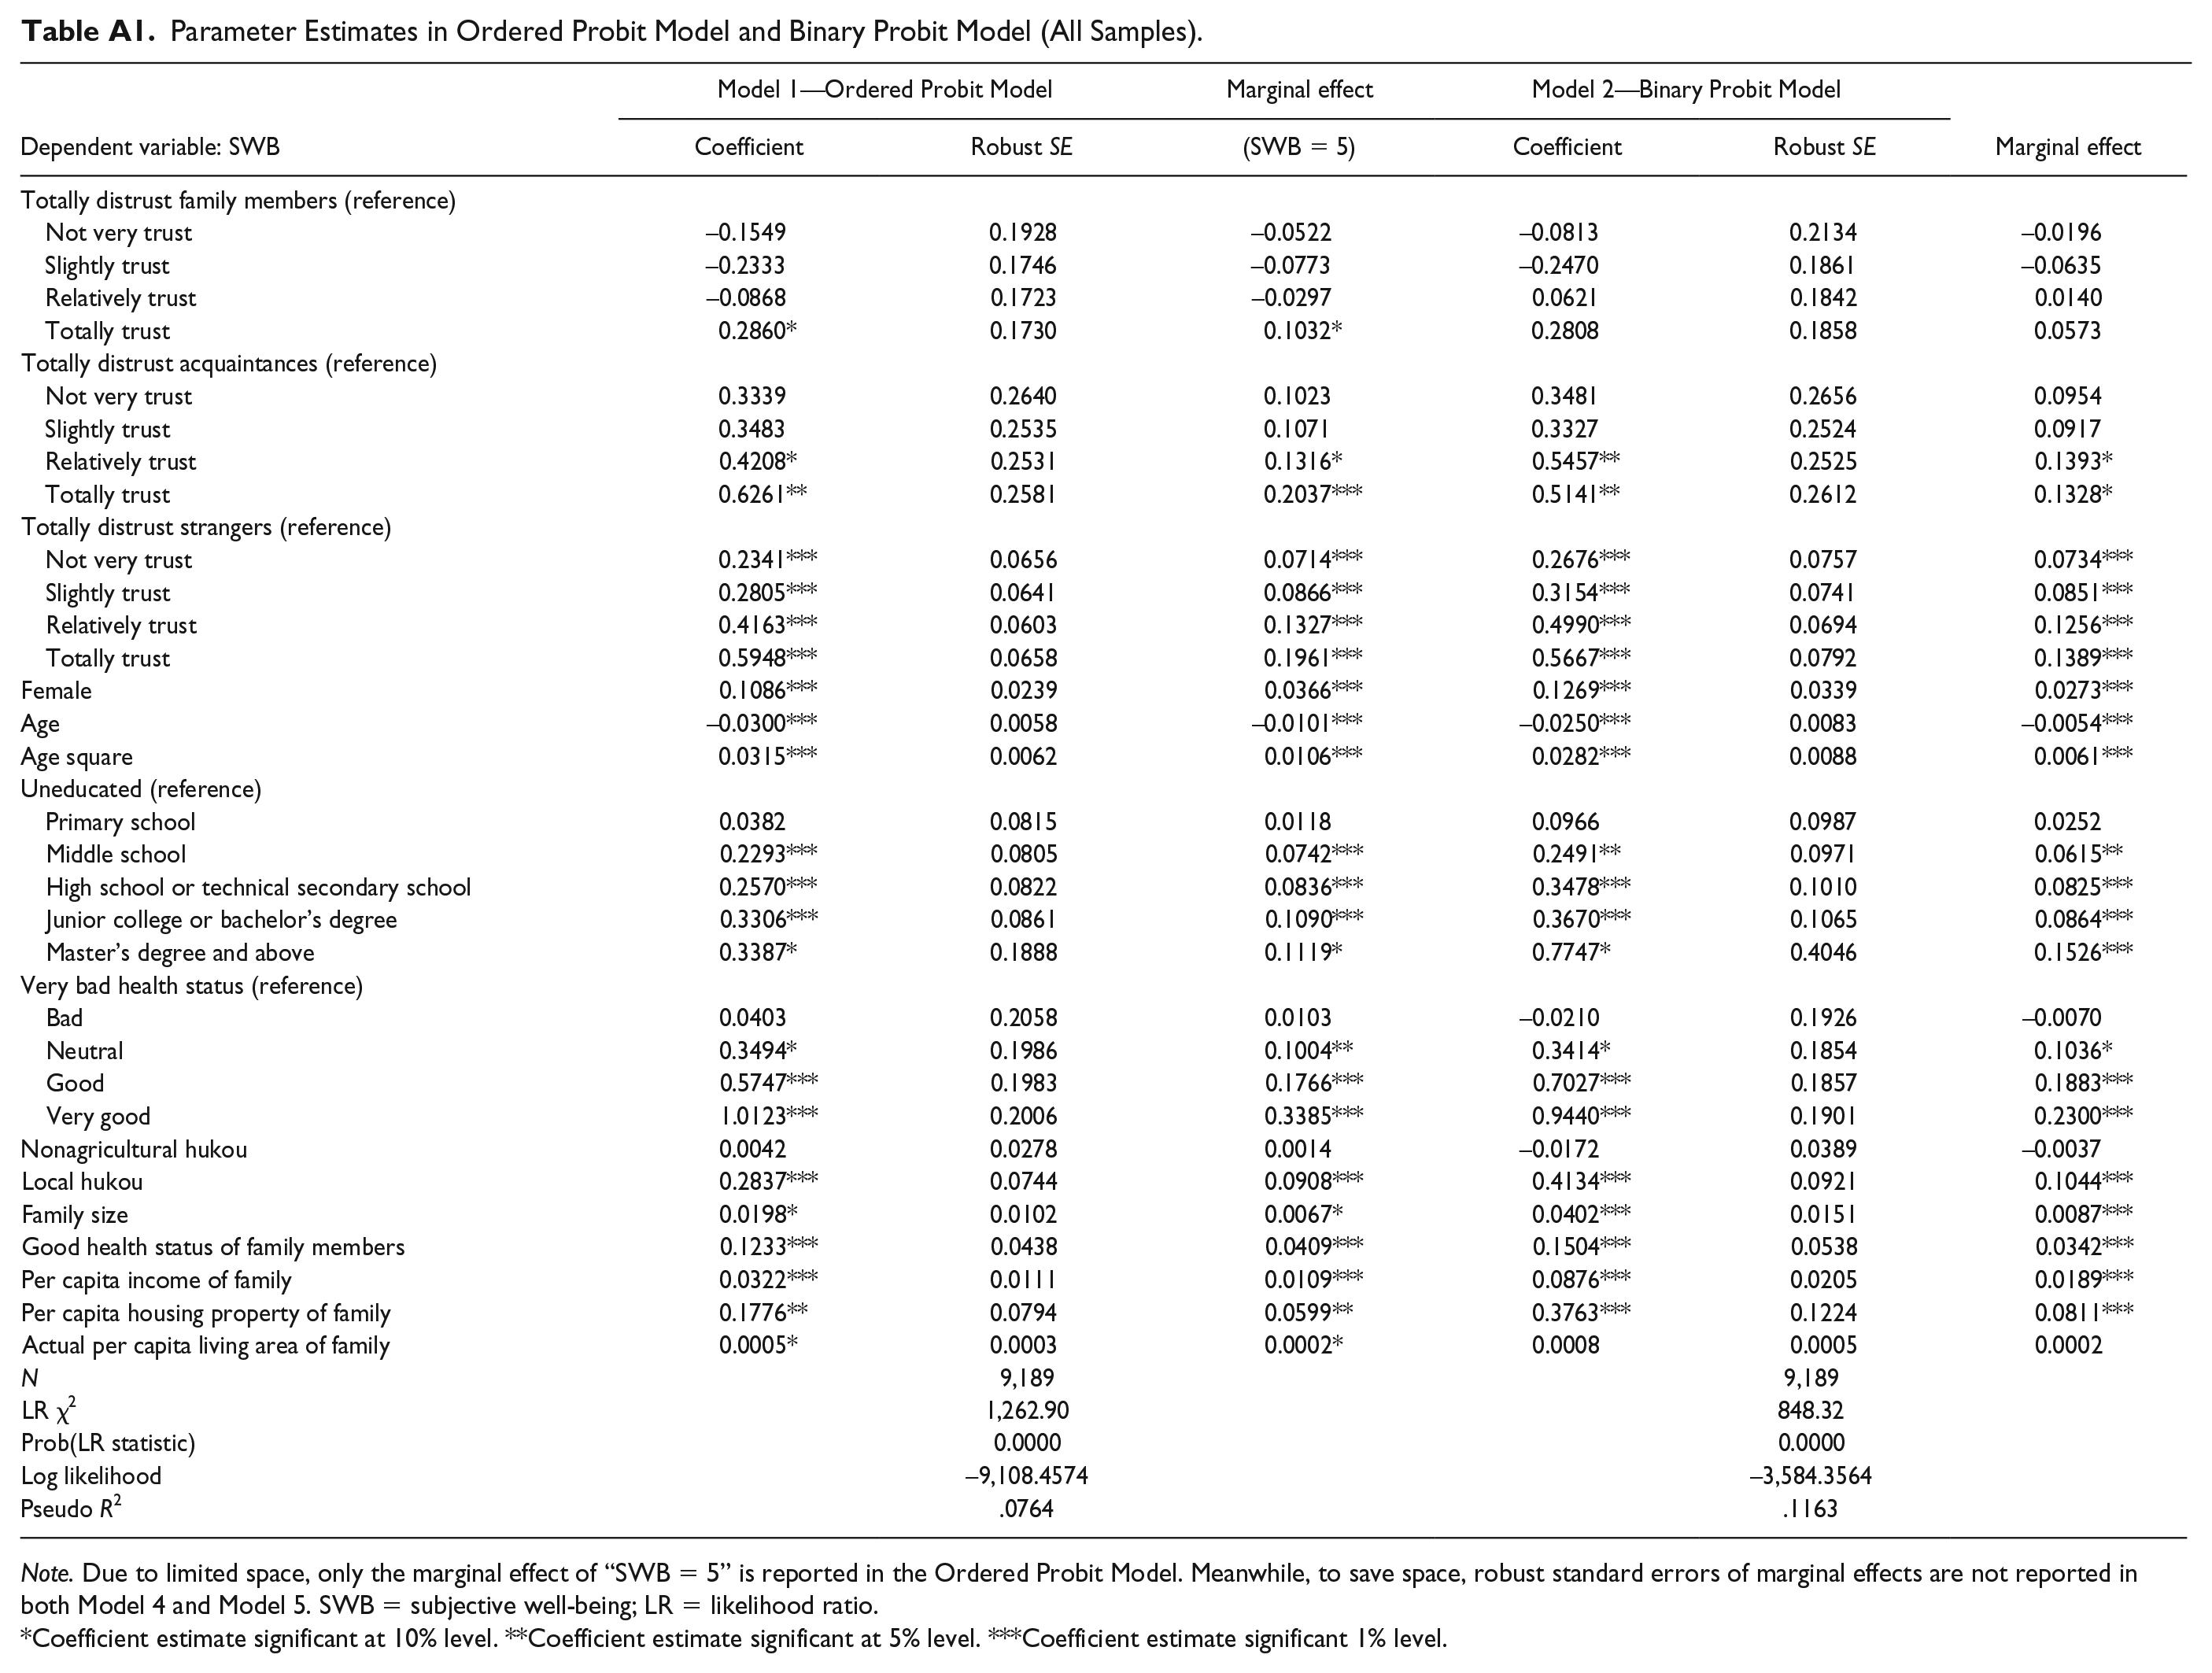
To verify the robustness of the results, the following two steps are performed: (a) take the SWB as ordered data, and then use Ordered Probit Model to reestimate the parameters and (b) take the 1 to 3 SWB levels as unhappy and assign value 0, and the 4 to 5 SWB levels as happy and assign value 1, and then use the Binary Probit Model to study the correlational relationship between social trust and SWB.
The results of the above two robustness tests are shown in Appendix Table 1. The regression results of Model 4 in Table 4 and Model 1 in Appendix Table 1 show that the sign and significance of estimated coefficients of the linear regression model (OLS) are highly consistent with those of the Ordered Probit Model except the specific values of regression coefficients. The findings by Ferrer-i-Carbonell and Frijters (2004) are further verified. From Appendix Table 1, it can be seen that no matter Ordered Probit Model or Binary Probit Model is used, the conclusions are almost the same: First, trust in family members has no significant correlation with SWB; second, for the levels of trust in acquaintances, only the coefficient of “totally trust” are significantly positive at the 5% level, indicating that only “totally trust acquaintances” show a significant positive correlation with SWB; third, for the levels of trust in strangers, compared with “totally distrust,” the estimated coefficients of other four trust levels (not very trust, slightly trust, relatively trust and totally trust) are significant at the 1% level, indicating that trust in strangers has a significant positive correlation with SWB. Meanwhile, in Model 1 and Model 2 in Appendix Table 1, the marginal effects of “not very trust,” “slightly trust,” “relatively trust,” and “totally trust” increase successively, indicating that as the level of trust in strangers rises, its correlation with SWB also gradually improves. The above robustness tests show that, regardless of using the Ordered Probit Model or the Binary Probit Model, the estimates are highly consistent with those in the OLS regression model. In a word, the conclusions on the correlational relationship between social trust and SWB are robust.
Urban–Rural and Male–Female Differences in the Correlational Relationship Between Social Trust and SWB
Urban–Rural Difference
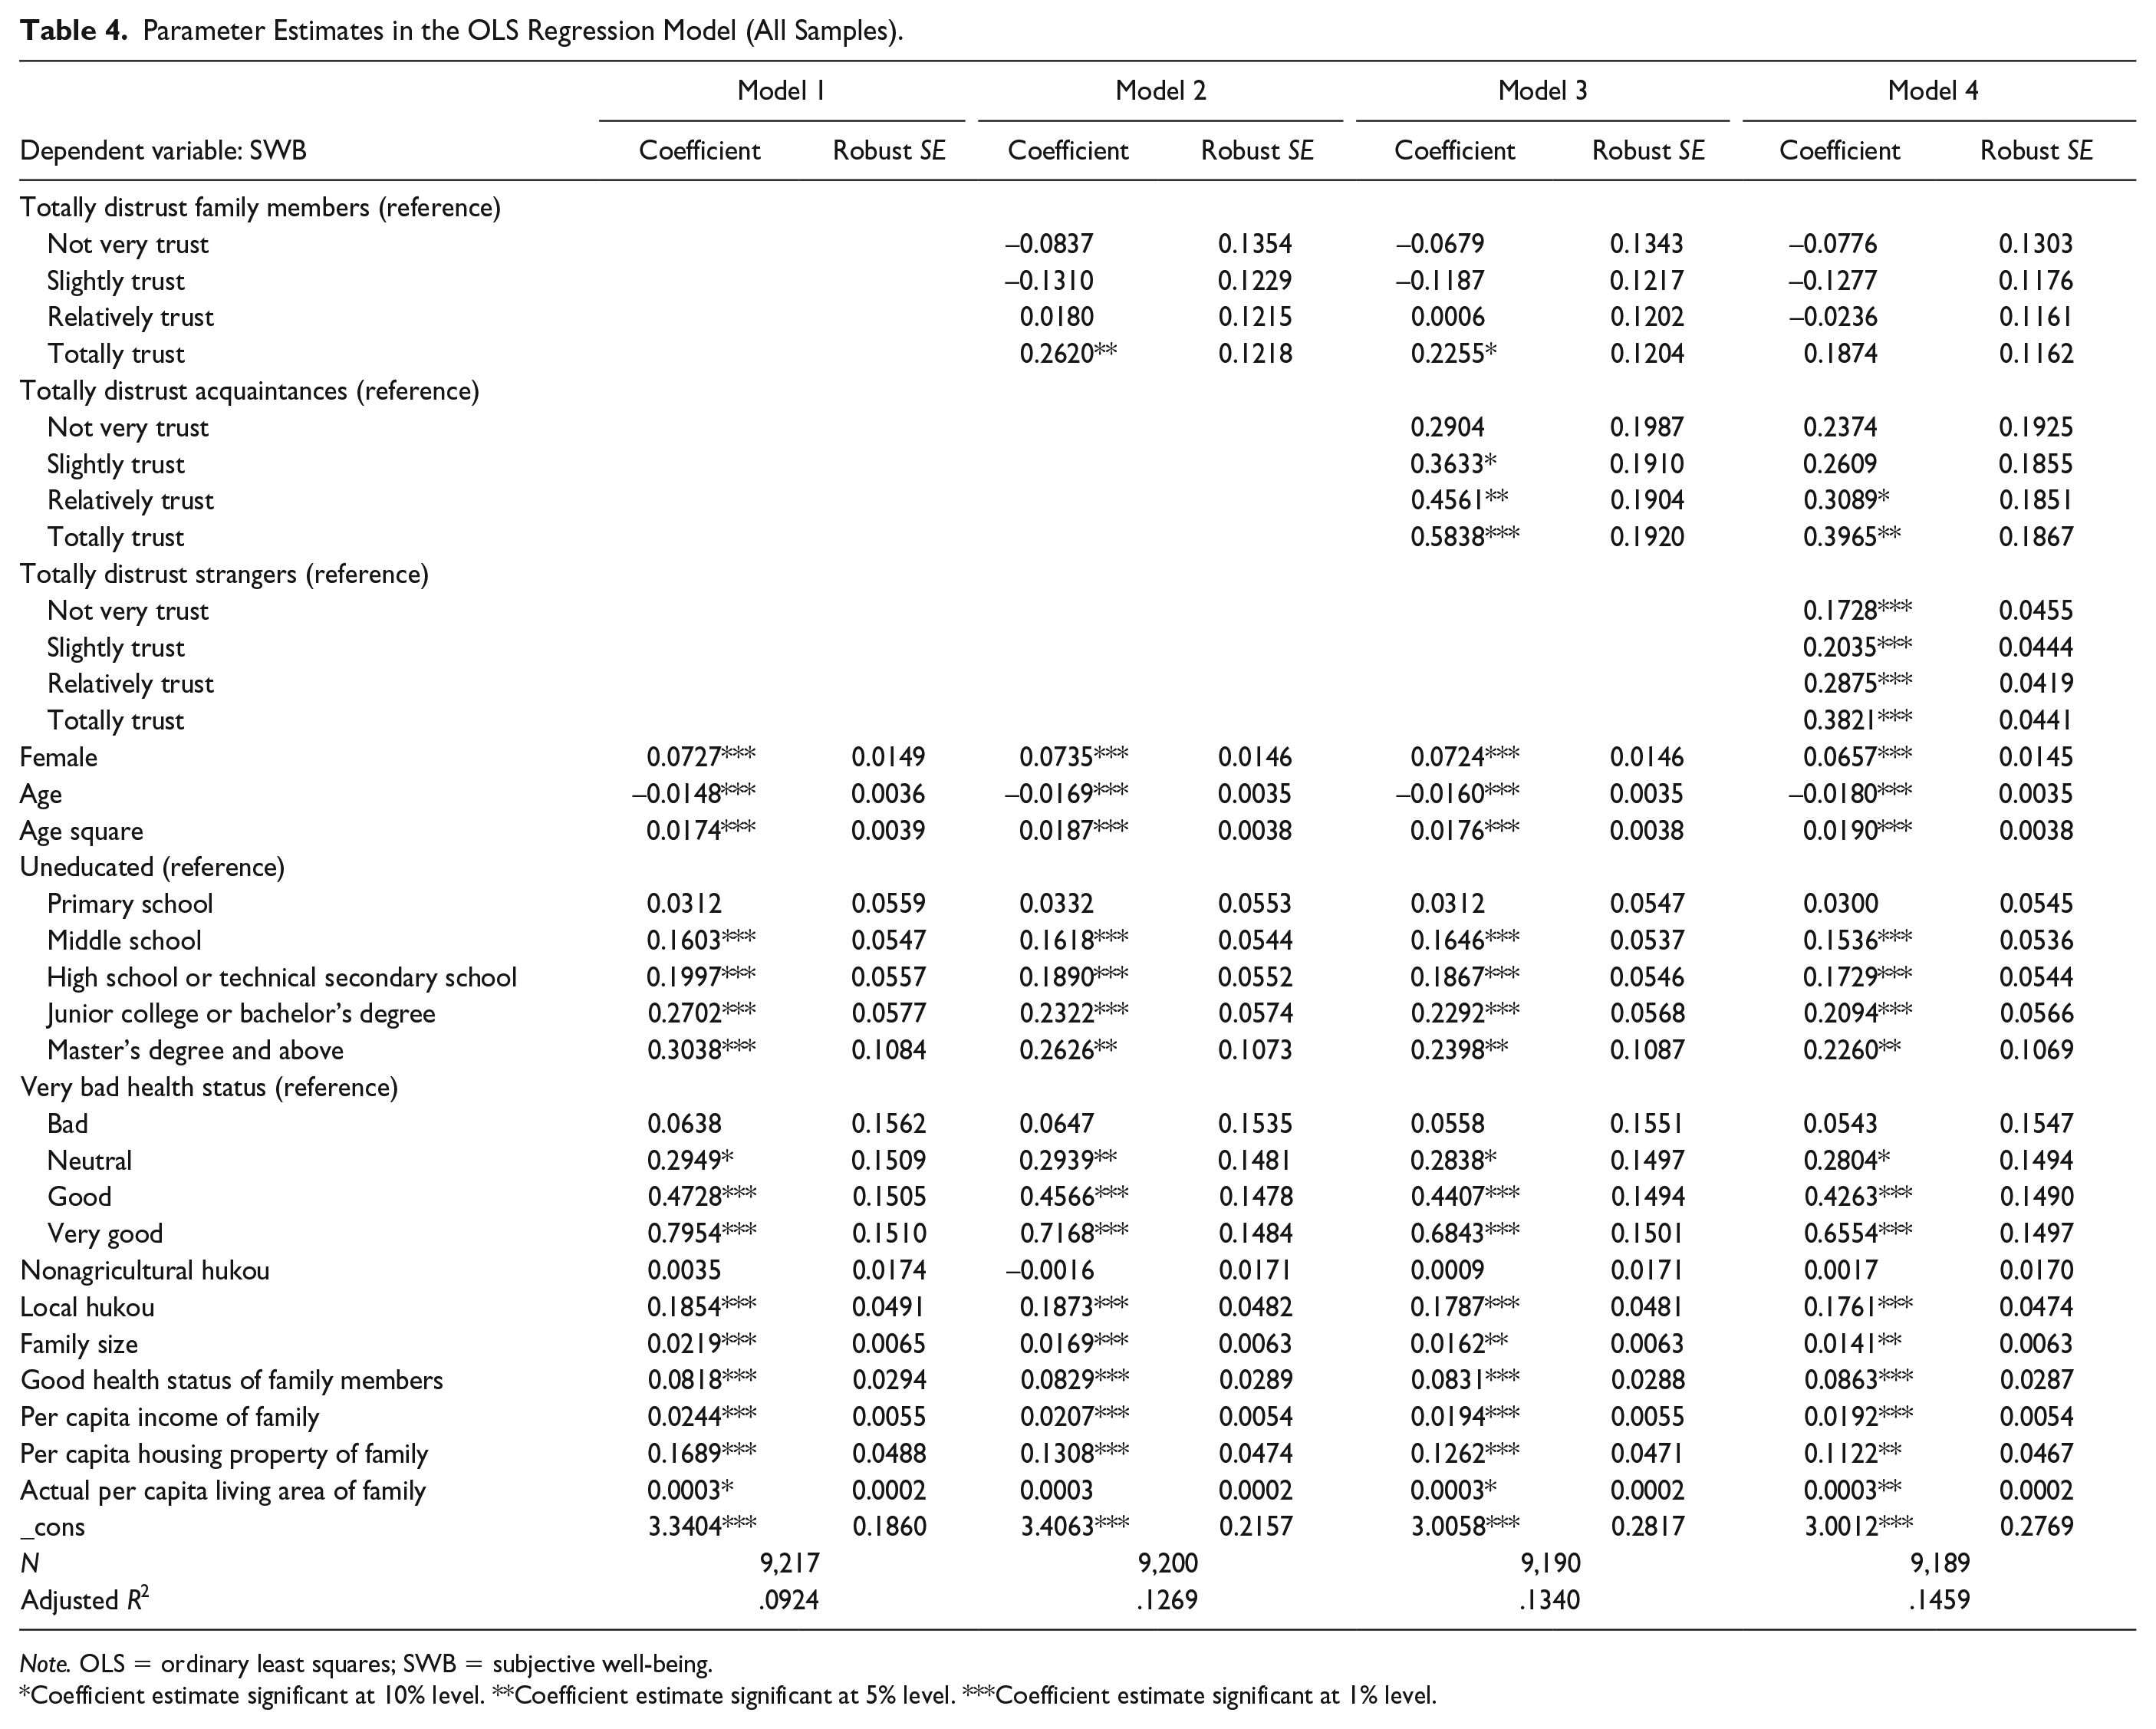
The regression results of all samples verify that the correlational relationships between different types of social trust and SWB vary greatly. Specifically, trust in family members has no significant correlation with SWB; only “totally trust acquaintances” show a significant positive correlation with SWB; compared with “totally distrust,” all other higher levels of trust in strangers show a significant positive correlation with SWB. Furthermore, as the trust level increases, its correlation with SWB also gradually improves. However, a dualistic structure system and a hukou barrier exist between urban and rural areas for a long time in China. Although a series of hukou system reform have been carried out in recent years, many resource allocation institutions still vary significantly between urban and rural areas. Hence, the correlational relationship between social trust and SWB may be also different between urban and rural areas. Based on the above considerations, the study samples are divided into two groups, that is, urban and rural residents according to their hukou status, and then regressions are respectively performed to verify whether the correlational relationship between social trust and SWB vary between urban and rural residents. The parameter estimates are shown in Table 5.
Urban–Rural and Male–Female Differences in the Correlational Relationship Between Social Trust and SWB.
Note. SWB = subjective well-being.
Coefficient estimates significant at 10% level. **Coefficient estimates significant at 5% level. ***Coefficient estimates significant at 1% level.
It can be seen from Table 5 that, no matter for the rural residents group or the urban residents group, the estimated coefficients of all levels of trust in family members and acquaintances are not significant at the 5% level. In the regression of rural residents group, compared with “totally distrust strangers,” the correlation between “not very trust” and SWB fails to pass the 5% significance test, while “slightly trust,” “relatively trust,” and “totally trust” are significantly positively correlated with SWB at the 1% level; in the regression of urban residents group, compared with “totally distrust strangers,” “not very trust,” “slightly trust,” “relatively trust,” and “totally trust” are significantly positively correlated with SWB at the 1% level. The regression results above indicate that trust in strangers has a significant positive correlation with SWB on the whole no matter for urban residents or rural residents. Meanwhile, with the increase in the level of trust in strangers, the estimated coefficients in both urban and rural resident groups are gradually increasing, which are consistent with the results of all samples. However, we can see that, for almost all levels of trust in strangers, the regression coefficients in the urban residents group are higher than the rural residents group. Is there an urban–rural difference in the correlational relationship between trust in strangers and SWB? To answer this question, in Table 5, it is tested by introducing the interaction term (sp) between trust in strangers and urban–rural type. The regression results show that the coefficient of the interaction term is significantly positive at the 1% level, indicating that there is indeed a significant urban–rural difference in the correlational relationship between trust in strangers and SWB. The correlation between trust in strangers and SWB in the urban residents group is significantly higher than the rural residents group.
For the control variables, in both urban and rural resident groups, women’s SWB is significantly higher than men’s, and local residents’ SWB is significantly higher than nonlocals’. Very good health status and higher per capita income of family also significantly correlate with people’s SWB at the 5% level. The correlation between age and SWB still shows a significant “U” shape. However, some control variables also are significantly different between urban and rural residents. For rural residents, the estimated coefficients of education level, family size, good health status of family members, per capita housing property, and actual per capita living area of family are significantly positive at the 5% level, but not significant at the 5% level for urban residents. Similarly, by introducing the interaction terms between the above-mentioned variables and urban–rural type, there is indeed a significant urban–rural difference in the correlational relationship between these variables and SWB.
Male–Female Difference
Some studies have found that a male–female difference exists in the factors affecting SWB (Chui & Wong, 2016; Grossbard & Mukhopadhyay, 2013; Hori & Kamo, 2018). Therefore, a male–female difference may exist in the correlational relationship between social trust and SWB. In view of this, all samples are divided into male group and female group, and then the male–female difference in the correlational relationship between social trust and SWB is tested with the help of the OLS regression model. The parameter estimates are shown in Table 5. It can be seen that, in the regression of female group, the estimated coefficients of “totally trust family members” is significantly positive at the 5% level, but not significant in the regression of male group. For the trust in acquaintances, no matter in the male or female group, the coefficients of all trust levels fail to pass the 5% significance test. For the trust in strangers, both in the male and female groups, compared with “totally distrust,” all other levels show a significant positive correlation with SWB, and pass the 1% significance test. Meanwhile, in the regressions of the male and female groups, the coefficients of “not very trust,” “slightly trust,” “relatively trust,” and “totally trust strangers” increases successively, indicating that as the trust level increases, the correlation with SWB also gradually improves. The results are consistent with the estimated results of all samples. However, by comparing the regression coefficients in the male and female groups, it can be seen that the regression coefficients of all levels of trust in strangers in the female group are higher than the male group on the whole. Similarly, in Table 5, the “interaction term (sg) between trust in strangers and gender” is introduced to further test whether the correlational relationship is significant different between men and women. The regression results show that the coefficient of the interaction term sg is significantly positive at 1% level, indicating that the correlational relationship between trust in strangers and SWB has a significant difference between men and women, and the correlation of female residents is significantly higher than that of male residents.
The estimated results of control variables show that, regardless of gender, local people’s SWB is higher than the nonlocals’, and higher per capita income of family significantly correlates with people’s SWB. However, the education level, health status, family size, per capita housing property, and actual per capita living area of family have a certain male–female difference in the correlation with SWB. For example, the correlations between education level and health status and women’s SWB are more significant than men’s, and the correlation between family size and SWB is significant positive for women, but not significant for men. Meanwhile, the correlations between per capita housing property and actual per capita living area of family and SWB are significant positive for men, but not significant for women. Similarly, as can be seen from Table 5, the interaction terms between these variables and gender are significant at the 5% level, indicating that there is a significant male–female difference in the correlation coefficients between these variables and SWB.
Conclusion and Discussion
As of now, many studies have shown that there is a significant correlation between social trust and SWB (Helliwell et al., 2014; Kuroki, 2011; Pena-López et al., 2017; Sulemana, 2015; Usher, 2007; Yamamura et al., 2015). But, they either do not classify social trust into subgroups, only examining the relationship between generalized social trust and SWB (Kuroki, 2011; Pena-López et al., 2017; Usher, 2007; Yamamura et al., 2015), or only classify social trust into generalized trust, interpersonal trust and institutional trust (Sulemana, 2015), trust in policemen, and trust in legal system (Helliwell et al., 2014), and so on, without studying the relationship between social trust and SWB from the perspective of interpersonal distance. However, a large number of studies have pointed out that under the special social structure of China, interpersonal trust shows a gradual decreasing law as the interpersonal distance becomes longer (Qi & Lai, 2014; Wang & Zhou, 2009; Yu, 2017). Therefore, considering that social trust in China is featured by the pattern of difference, it is classified into trust in family members, trust in acquaintances, and trust in strangers. The correlational relationships between the three types of social trust and SWB are discussed from the empirical point of view. Meanwhile, the urban–rural and male–female differences in such correlational relationships are examined.
First of all, by comparing the three types of social trust, we find that trust in family members, acquaintances, and strangers shows a decreasing law, which reflects that China’s social trust is featured by the pattern of difference to some extent. The concept of pattern of difference proposed by Fei (2015) is an important tool for understanding Chinese social structure and interpersonal relationships, and also inspires a series of studies on Chinese social phenomena (Hu, 2018). The phenomenon of pattern of difference is widespread in Chinese society, which can be found in many fields such as Chinese social trust (Qi & Lai, 2014; Wang & Zhou, 2009; Yu, 2017), food market (Xiong, 2011), transfer of agricultural land (Liu, Liang, Wang, Ma, 2018), and social networks (Zhang, 2008). Since Fei (2015) put forward the concept of pattern of difference, a large number of scholars have analyzed and discussed the pattern of difference in Chinese social trust. But most of them conduct a qualitative analysis, only Wang and Zhou (2009), Qi and Lai (2014), and Yu (2017) conduct a quantitative analysis on the pattern of difference. However, only an individual region is taken as the research object, and the sample size is also small. It should be noted that a particular region may be affected by local culture and other factors, which makes its social trust be of specificity. Therefore, to better understand the pattern of difference in Chinese social trust, it is necessary to conduct a large-scale national survey. The data used in this article is the sample survey data for the whole China. Hence, the conclusion that social trust is featured by the pattern of difference obtained with this data is more credible and persuasive.
Second, from the correlational relationships between the three types of social trust and SWB, only “totally trust acquaintances” shows a significant positive correlation with SWB; trust in strangers has a significant positive correlation with SWB, and as the level of trust in strangers increases, the correlation coefficient gradually improves. The classification of interpersonal distance is very necessary in socioeconomic research (D. Li, Eden, et al., 2008; Matthias & Benjamin, 2008). More and more scholars have applied it to the study of social trust and have drawn many valuable discoveries (Freitag & Bauer, 2016; Freitag & Traunmüller, 2009; Welch et al., 2005). However, these studies either simply statistically analyze the trust differences between groups with different interpersonal distances (Freitag & Traunmüller, 2009) or only examine the differences in the factors affecting the trust level between groups with different interpersonal distances (Freitag & Bauer, 2016; Welch, Sikkink, & Loveland, 2007). There is no literature to study the correlational relationship between trust in different groups with different interpersonal distances and SWB. China is a typical Confucian cultural country. Its social structure and social trust are quite different from the western developed countries (Churchill & Mishra, 2017; Delhey, Newton, & Welzel, 2011; Fei, 2015). The conclusions of this article show that not only is Chinese social trust featured by the pattern of difference (Fei, 2015; Qi & Lai, 2014; Wang & Zhou, 2009; Yu, 2017) but also the correlational relationship between social trust and SWB shows a reverse pattern of difference. This finding makes up for the gap in the research on the correlational relationship between trust in groups with different interpersonal distances and SWB. In addition, the reverse pattern of difference phenomenon in the correlational relationship between social trust and SWB also helps us understand China’s social structure and social trust more deeply.
Finally, from the urban–rural and male–female differences in the correlational relationship between trust in strangers and SWB, no matter for urban or rural residents and for men or women, trust in strangers has a significant positive correlation with SWB on the whole. However, this positive correlation between trust in strangers and SWB still has significant urban–rural and male–female differences. To be specific, this positive correlation of urban residents is significantly higher than that of rural residents, and this positive correlation of women is significantly higher than that of men. Existing studies have found that social trust (Kayaoglu, 2017; Y. Li, Pickles, & Savage, 2005) and SWB (Kuroki, 2011; Lee & Zhao, 2017) vary significantly between urban and rural areas and between men and women. But, at present, there is no literature to study the urban–rural and male–female differences in the correlational relationship between social trust and SWB, which is supplemented and expanded to some extent in this article.
This article discusses the correlational relationships between different types of social trust and SWB in China in the context of the pattern of difference as well as their urban–rural and male–female differences, and draws some interesting findings. But there are still some limitations and deficiencies. First, the “China’s Family Happiness Development Index” survey project was only conducted in 2012, and no tracking survey is performed. Due to the limitation of data availability, the data used in the empirical analysis of this article is cross-sectional data, so the problem of missing variables cannot be well solved. If there is a chance to get the tracking survey data in the future, then the problem of estimated bias caused by unobservable individual heterogeneity missing variables which do not change over time can be solved. Second, this article only discusses the correlational relationship between social trust and SWB. Due to the limited variables in the survey, the instrumental variable method cannot be used to identify the causal mechanism between them. If there is a chance to obtain other survey data with more variables so as to select better instrumental variables in the future, then the causal relationship and influence mechanism between them can be identified. Third, although the data used in this article is derived from 64 districts and counties in 16 cities in China, the cities or districts/counties to which the respondents belong are not disclosed. Hence, in the empirical analysis, it is impossible to cluster the samples to the city or district/county level. If the city or district/county to which each respondent belongs can be known, then not only can the research samples be clustered but also different types of social trust in China as well as the regional differences in the correlational relationship between different types of social trust and SWB can be further studied. Ultimately, Fei (2015) believes that China’s social structure is different from that of the West. The empirical results of Delhey et al. (2011) and Churchill and Mishra (2017) also indicate that China’s trust radius and the effects of trust on happiness are also quite different from the Western countries. This article finds that Chinese social trust is featured by the pattern of difference, and so do the correlational relationship between social trust and SWB. But is the pattern of difference in this correlational relationship unique to China? Is there a big difference with Western countries? As the data used in this article is only for China, this article cannot test if there is a big difference. In the future research, cross-national data can be used to compare the difference between China and Western countries, which is of great significance to deeply understand China’s social structure and social trust.
Footnotes
Appendix
Parameter Estimates in Ordered Probit Model and Binary Probit Model (All Samples).
| Dependent variable: SWB | Model 1—Ordered Probit Model |
Marginal effect |
Model 2—Binary Probit Model |
Marginal effect | ||
|---|---|---|---|---|---|---|
| Coefficient | Robust SE | (SWB = 5) | Coefficient | Robust SE | ||
| Totally distrust family members (reference) | ||||||
| Not very trust | −0.1549 | 0.1928 | −0.0522 | −0.0813 | 0.2134 | −0.0196 |
| Slightly trust | −0.2333 | 0.1746 | −0.0773 | −0.2470 | 0.1861 | −0.0635 |
| Relatively trust | −0.0868 | 0.1723 | −0.0297 | 0.0621 | 0.1842 | 0.0140 |
| Totally trust | 0.2860* | 0.1730 | 0.1032* | 0.2808 | 0.1858 | 0.0573 |
| Totally distrust acquaintances (reference) | ||||||
| Not very trust | 0.3339 | 0.2640 | 0.1023 | 0.3481 | 0.2656 | 0.0954 |
| Slightly trust | 0.3483 | 0.2535 | 0.1071 | 0.3327 | 0.2524 | 0.0917 |
| Relatively trust | 0.4208* | 0.2531 | 0.1316* | 0.5457** | 0.2525 | 0.1393* |
| Totally trust | 0.6261** | 0.2581 | 0.2037*** | 0.5141** | 0.2612 | 0.1328* |
| Totally distrust strangers (reference) | ||||||
| Not very trust | 0.2341*** | 0.0656 | 0.0714*** | 0.2676*** | 0.0757 | 0.0734*** |
| Slightly trust | 0.2805*** | 0.0641 | 0.0866*** | 0.3154*** | 0.0741 | 0.0851*** |
| Relatively trust | 0.4163*** | 0.0603 | 0.1327*** | 0.4990*** | 0.0694 | 0.1256*** |
| Totally trust | 0.5948*** | 0.0658 | 0.1961*** | 0.5667*** | 0.0792 | 0.1389*** |
| Female | 0.1086*** | 0.0239 | 0.0366*** | 0.1269*** | 0.0339 | 0.0273*** |
| Age | −0.0300*** | 0.0058 | −0.0101*** | −0.0250*** | 0.0083 | −0.0054*** |
| Age square | 0.0315*** | 0.0062 | 0.0106*** | 0.0282*** | 0.0088 | 0.0061*** |
| Uneducated (reference) | ||||||
| Primary school | 0.0382 | 0.0815 | 0.0118 | 0.0966 | 0.0987 | 0.0252 |
| Middle school | 0.2293*** | 0.0805 | 0.0742*** | 0.2491** | 0.0971 | 0.0615** |
| High school or technical secondary school | 0.2570*** | 0.0822 | 0.0836*** | 0.3478*** | 0.1010 | 0.0825*** |
| Junior college or bachelor’s degree | 0.3306*** | 0.0861 | 0.1090*** | 0.3670*** | 0.1065 | 0.0864*** |
| Master’s degree and above | 0.3387* | 0.1888 | 0.1119* | 0.7747* | 0.4046 | 0.1526*** |
| Very bad health status (reference) | ||||||
| Bad | 0.0403 | 0.2058 | 0.0103 | −0.0210 | 0.1926 | −0.0070 |
| Neutral | 0.3494* | 0.1986 | 0.1004** | 0.3414* | 0.1854 | 0.1036* |
| Good | 0.5747*** | 0.1983 | 0.1766*** | 0.7027*** | 0.1857 | 0.1883*** |
| Very good | 1.0123*** | 0.2006 | 0.3385*** | 0.9440*** | 0.1901 | 0.2300*** |
| Nonagricultural hukou | 0.0042 | 0.0278 | 0.0014 | −0.0172 | 0.0389 | −0.0037 |
| Local hukou | 0.2837*** | 0.0744 | 0.0908*** | 0.4134*** | 0.0921 | 0.1044*** |
| Family size | 0.0198* | 0.0102 | 0.0067* | 0.0402*** | 0.0151 | 0.0087*** |
| Good health status of family members | 0.1233*** | 0.0438 | 0.0409*** | 0.1504*** | 0.0538 | 0.0342*** |
| Per capita income of family | 0.0322*** | 0.0111 | 0.0109*** | 0.0876*** | 0.0205 | 0.0189*** |
| Per capita housing property of family | 0.1776** | 0.0794 | 0.0599** | 0.3763*** | 0.1224 | 0.0811*** |
| Actual per capita living area of family | 0.0005* | 0.0003 | 0.0002* | 0.0008 | 0.0005 | 0.0002 |
| N | 9,189 | 9,189 | ||||
| LR χ2 | 1,262.90 | 848.32 | ||||
| Prob(LR statistic) | 0.0000 | 0.0000 | ||||
| Log likelihood | –9,108.4574 | –3,584.3564 | ||||
| Pseudo R2 | .0764 | .1163 | ||||
Note. Due to limited space, only the marginal effect of “SWB = 5” is reported in the Ordered Probit Model. Meanwhile, to save space, robust standard errors of marginal effects are not reported in both Model 4 and Model 5. SWB = subjective well-being; LR = likelihood ratio.
Coefficient estimate significant at 10% level. **Coefficient estimate significant at 5% level. ***Coefficient estimate significant 1% level.
Acknowledgements
We are grateful to the China Population Welfare Foundation, School of Sociology and Population Studies of Renmin University of China, and National Scientific Data Sharing Platform for Population and Health-National Population and Reproductive Health Science Data Center for providing data, which had no role in study design, data collection and analysis, decision to publish, or preparation of the manuscript.
Declaration of Conflicting Interests
The author(s) declared no potential conflicts of interest with respect to the research, authorship, and/or publication of this article.
Funding
The author(s) received no financial support for the research, authorship, and/or publication of this article.