
Abstract
In the last decade of the 20th century, home advantage in the National Hockey League (NHL) fell by half, from 60% wins (or higher prior to 1991) to 55% wins, and has remained there until the present. This drop is much the largest and most abrupt of any change in home advantage in elite sports since the end of the Second World War. In addition, it is further complicated by two rule changes at the start of the decade. First, in 1991-1992 the NHL instituted instant video replay. Then the next year, 1992-1993, it imposed the instigator rule, which provided a game misconduct penalty (ejection from the game) for starting a fight and was followed by a prolonged drop in the frequency of fighting. Of the many theories of the home advantage, two are singled out as relevant to the fall in home advantage and possibly helpful in explaining it.
Introduction
The five major professional team sports for men in North America are baseball, football, hockey, basketball, and soccer. 1 Teams in all five sports win more often at home than they do away, and the home advantage is statistically reliable year after year, stretching back in each sport at least to the Second World War (Pollard & Pollard, 2005). The size of the home advantage differs, however, from sport to sport (Jones, 2018). Home advantage in four of the five sports has changed slowly, if at all. Figure 1 presents the courses home advantage has followed in these four sports since the end of World War II. The effect in baseball is smallest of the five, equaling close to 4% (the percentage of home wins minus 50%) for more than a century. It is highest in soccer and basketball, ranging in both sports as high as 15% just after the war, but declining slowly since, to a present level around 10%. Football has been slowly increasing since the war, roughly 3% in the same span of years.

Home advantage in basketball, soccer, football, and baseball from 1951 to 2013, by decade.
Hockey is the exception. For 45 years, the home advantage in hockey ranked close to that in soccer and basketball, with an average value a bit less than 12%. Then, in the 1990s, it dropped to 5% and has dropped another point in the 17 years up to the present. It dropped more in one decade than any of the other four sports dropped in seven decades. Figure 2 presents the home advantage in hockey from 1991-1992 to 2000-2001 by individual year, bracketed by two average figures before and two averages after. 2 This rapid drop in home advantage is all the more remarkable because it seems to have escaped notice in the scholarly literature. Theories of the home advantage abound. The popular theory attributes it to the hometown crowd, especially how big it is (Pollard & Gómez, 2014; Goumas, 2013), another argues that the home team wins more often than it loses because it is more familiar with its situation, playing surface, stadium, people (Barnett & Hilditch, 1993; Clarke & Norman, 1995; Romanowich, 2012; Zeller & Jurkovac, 1989), a third implicates hormonal action (Fothergill, Wolfson, & Naeve, 2017, and the most frequently cited takes a multi-factor approach (Carron, Loughhead, & Bray, 2005; Courneya & Carron, 1992). It is the business of a theory to explain things, and the big and sustained stumble that home advantage took in professional ice hockey is precisely the sort of thing that a theory should explain. Yet almost all of these theories content themselves with explaining why it is that teams seem always to win more often at home than away. Why is the home advantage larger, even much larger, in some sports than in others (as in Figure 1)? Why is it that some activities in team sports, for example, free throws in basketball, penalty kicks in soccer, and shootouts in ice hockey, show no home advantage at all? If a theory offers to explain home advantage as a stylized abstraction and no more (no boundary conditions, where the generality does not hold, no differences in magnitude, no changes in time), it is at best only a beginning.
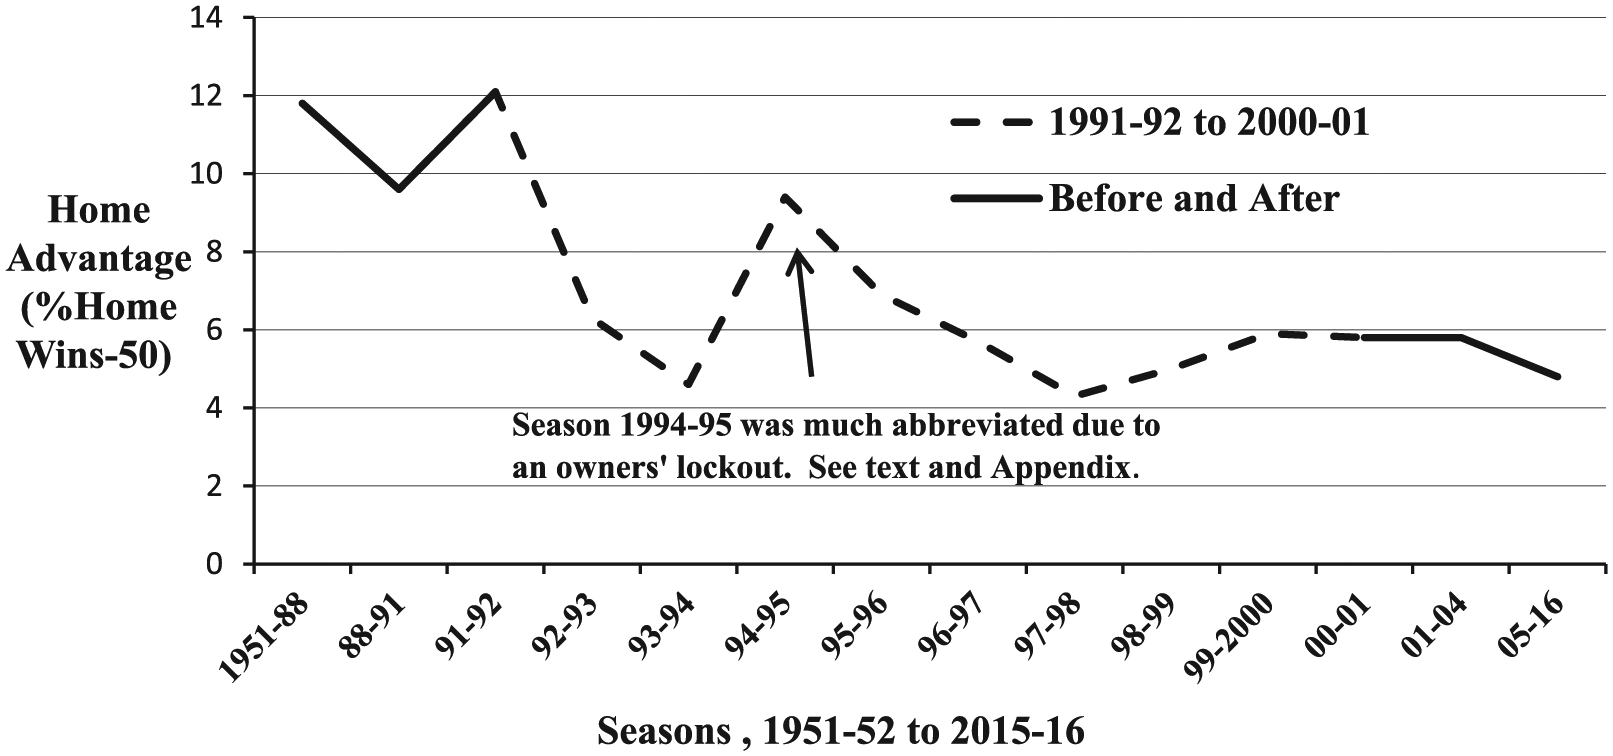
Home advantage in the NHL from 1991-1992 to 2000-2001 by individual year, bracketed by two average figures before (1951-1952 to 1987-1988) and (1988-1989 to 1990-1991) and two averages after (2001-2002 to 2003-2004) and (2005-2006 to 2015-2016).
In general, an investigator is well-advised to leave other theories than his or her own to their respective proponents. In the present case, however, still another theory (Nevill & Holder, 1999) explains or could explain what happened to the home advantage in the National Hockey League in so straightforward a way that an exception seems warranted. The theory is that the hometown effect is mediated by the on-site officials. This idea is not a conspiracy theory. The officials do not mean to favor the hometown crowd, typically they are not even aware of it, but the hometown crowd is hard to ignore. To buttress their argument, Nevill, Balmer, and Williams (2002) show, using videotaped incidents, that even experienced referees in soccer are affected by the hometown crowd.
Now it happens that in 1991-1992, just at the beginning of the steep decline in home advantage, the NHL introduced instant video replay. Decisions as to whether or not a puck has entered the goal mouth are often exquisitely close, and the officials on the ice cannot help but hear the partisan outpourings of the hometown crowd. It seems reasonable to suppose that they would tend unconsciously to decide that the home team had scored or the visiting team had not scored more often than from a strictly objective point of view they should. If so, then this bias in on-site officiating could have contributed strongly to the home advantage in NHL hockey prior to 1991-1992. Instant video replay removes this bias because the judges who evaluate the video are not on-site (but in NHL headquarters in Toronto). Hence, home advantage falls.
The main purpose of this article is to test this hypothesis, that is, that it was the introduction of instant video replay that caused the steep decline in home advantage in the NHL. Before we get started, a note on Figure 2 is in order.
The major irregularity in the downward course of home advantage in the 1990s (Figure 2) is the sharp upward peak in 1994-1995. As noted in the figure, 1994-1995 was an abbreviated season. The season did not begin until late January rather than the usual starting date in late October. To accommodate the late starting date, the League shortened the regular season from 84 to 48 games (24 at home and 24 away) and eliminated all interconference games. This coincidence raises the possibility that the schedule prescribed for the abbreviated season may have been partly responsible for the upward peak in home advantage in 1994-1995.
The ultimate prize in the NHL is the Stanley Cup and competition for it is conducted after the regular season. Entry into this competition is by conference, so many teams for the Eastern and so many for the Western. Therefore, teams in the same conference are in direct competition for a place in the postseason playoffs. In the abbreviated schedule, this competition is unrelieved; there are no interspersed (less consequential) games with teams in the other conference. In addition, the 48 games a team plays in the abbreviated season is decidedly less than the number of within-conference games it would play in an unabbreviated season. On both counts (all within-conference games and fewer of them), a single game in the abbreviated season counts more toward a place in the Stanley Cup competition than it would in the usual unabbreviated season. It also counts more for a privileged position in the playoffs. Seeding in the playoffs is determined by within-conference standing, and higher seeds are privileged, partly because they play lower seeds in the first playoff round and partly because the higher seed has home ice advantage throughout the playoffs. For all these reasons, the results for the 1994-1995 season merit a closer look (see the appendix).
Method
With one exception, home advantage in this article was taken from network sites: hockey-reference.com (NHL), who scored.com (English Premier League), pro-football reference.com (National Football League [NFL]), baseball-reference.com (Major League Baseball [MLB]), basketball-reference.com (National Basketball Association [NBA]). The exception concerned home advantage in the American Hockey League (AHL). Although the AHL began in 1938, the league’s official site contained home and away standings as far back as 1992-1993 but no further, and some notion of where the advantage lay before 1992-1993 would have been helpful in the analysis.
The Hershey Bears Hockey Club has been a member of the AHL since its foundation and is the longest continuously operating member of the league. It also has won more Calder Cups (11) than any other club in the AHL. 3 The Hershey Bears are owned by the Hershey Trust, which also owns the chocolate company and, among other local institutions, the Hershey Archives. The Archives collects materials related to the many Hershey enterprises, including the Hershey Bears. A search of the Archives turned up final standings for the AHL as a whole broken down by home and away for 8 years between 1956-1957 and 1974-1975. These years were added to the data available from the Internet.
Year-by-year logs of all incidents in which at least one player and usually both players were assessed 5-min fighting majors (and sometimes additional penalties) were obtained from hockeyfights.com.
Results
Figure 3 presents home advantage in the NHL, AHL, and ECHL by half decades from 1986 to 2014, that is, the years of the abrupt drop in the NHL. The decline from 1986-1990 to 2011-2014 is just as steep in the two minor leagues as it is in the NHL, in fact, a bit steeper. Prior to 1986, home advantage in the NHL was higher than it has been since (Figure 2). The official AHL website does not provide data prior to 1992. The Hershey Archives, however, yielded relevant data for 8 years in the interval from 1956 to 1975. Home advantage in the 8 informative years averaged 15.6%, even higher than in the NHL. In the ECHL, home advantage appears to peak in the 1991-1995 half decade, but the league had been in existence for only 3 years and the increase from the preceding half decade is small.
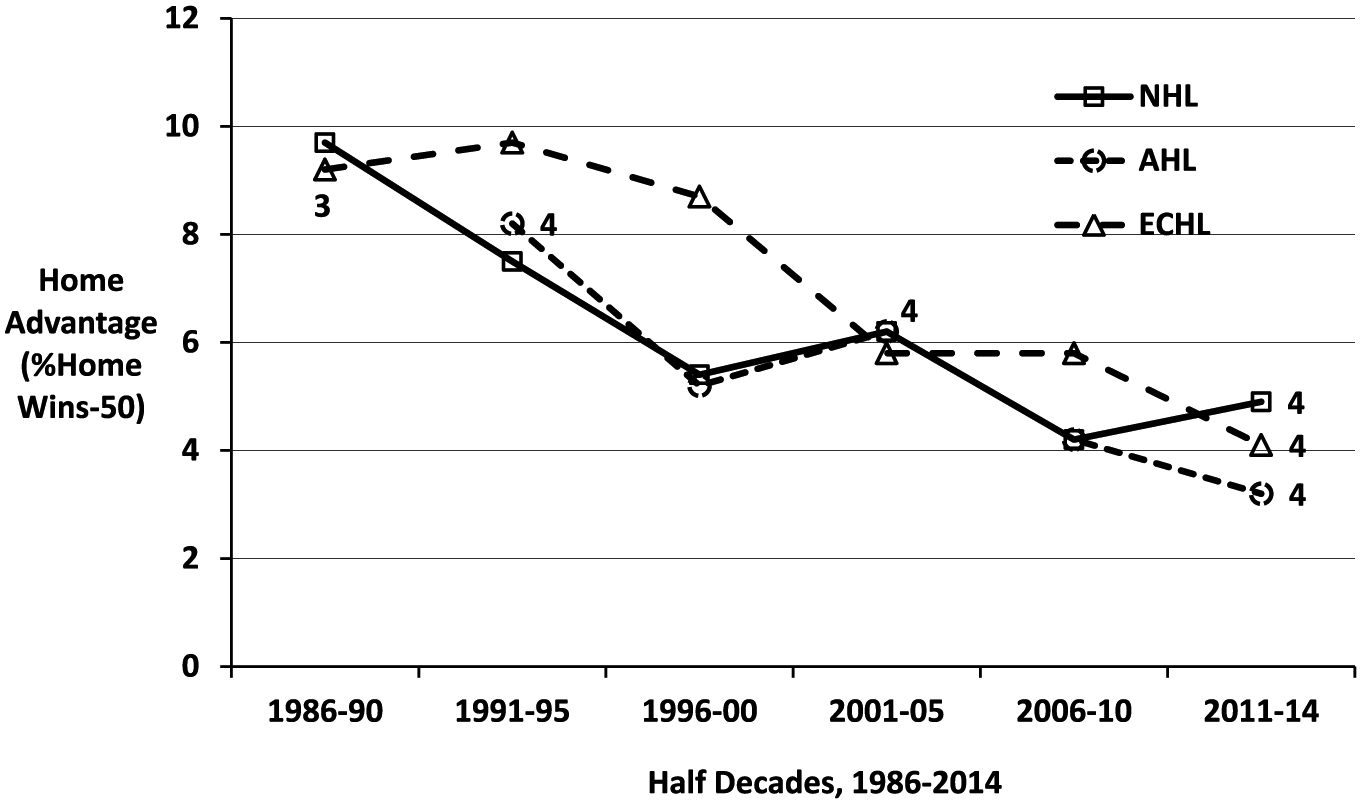
Home advantage in the NHL, AHL, and ECHL by half decades, 1986-2014.
Instant video replay was not instituted in the AHL until the 2012-2013 season, when the drop in home advantage in the NHL had been completed a decade earlier. 4 In the ECHL as of May 2015 it had still not been instituted. The drop in home advantage occurred over the same years in the two leagues most similar to the NHL; it was as steep in those two leagues as it was in the NHL; and those two leagues did not use instant video replay until well after the drop had completely run its course. Alleged causes are notoriously difficult to confirm, but excluding a cause is a great deal easier. One of the easiest is the case at hand; the alleged cause (instant replay) is completely absent in two cases where the specified effect (a large and abrupt fall in home advantage in the same sport and the same period of time) is fully present. Instant video replay cannot therefore have been a necessary or even a contributing cause of the drop in home advantage in the NHL.
Discussion
If the introduction of instant video replay was not responsible for the sudden fall of home advantage in the NHL, what was? This discussion will attempt an answer to this question, but, first, the historical context in which the fall took place is too relevant to be passed over without comment.
Expansion, Culture Clash, and Crisis
In its beginnings (1917) and for many years afterward the NHL was a Canadian league. As late as 1960, almost all of its players, 96.2% of them, were Canadian. Then its composition began to change. By 1990-1991, a quarter of the players were either U.S. born (16.7%) or European (9.7%). Today only half the players are Canadian (50.8%), 24.2% are American, and 25% are European. The NHL today is a thoroughly international league, the most prestigious of any hockey league in the world. Yet until recently, unlike any professional league in Europe or any nonprofessional league anywhere, it has regarded fighting “as part of the game” (Bernstein, 2006).
All sports include aspects of which the presiding authorities disapprove. Even in noncontact sports such as skiing, luge, cycling, or long distance running, people occasionally get killed. In all sports people sometimes get hurt. Baseball players get beaned. Tennis players injure their elbows. Ankle sprains, groin pulls, hamstring, or knee injuries are common. The authorities do what they can to minimize injuries. They authorize protective equipment, require on-site medical personnel to treat injured players, and, where they think a player is at fault for an injury or done something that might have caused one, he or she is penalized. In normal sport, these deaths, injuries, and illegal behaviors may be “part of the game” in the sense that they exist and to some extent are unavoidable, but they always stop the play of the game; they never serve an approved role within the game itself. Professional ice hockey in North America was the exception.
From its inception, the NHL regarded fighting as indispensable in policing the sport. Yes, there were rules and officials to enforce them but above and beyond both was the players’ code. This code placed the team under an obligation to retaliate against any opponent who committed an undetected foul against one of its players, especially a star player, or who had in some other way “disrespected” a teammate, especially (again) a star teammate. In the early years, almost everyone, players, the League, and fans, defended the code; very few voiced public opposition. The code, it was claimed, was the best way to minimize dirty hockey and the only way to protect star players (Allen, 1999; Bernstein, 2006).
In short, the code in ice hockey was a particular instance of a very old idea in human society, an idea that called on families, clans, tribes, and their individual members to retaliate personally against any outsider who offended them. It was at least as old as the fifth century BC, when Aeschylus made it an underlying and blood-soaked theme in his trilogy, the Oresteia. It was condemned in the New Testament. 5 And it has been a recurrent but gradually fading theme ever since, although the modern world still struggles with lynchings and other crowd actions, revenge murders, honor killings, and vigilante justice.
Nevertheless, at the end of the Second World War the code, hoary anachronism though it might be, was still a commanding presence in the NHL. In those years, the League consisted of six teams: Montreal, Toronto, New York, Boston, Chicago, and Detroit. The first expansion came in 1967-1968; the League doubled to 12 teams. In 1970-1971 it added two more, then another two in 1972-1973. This expansion process continued until by 1991-1992 the League numbered 22 teams. Of these 22 teams, 16 were based in the United States and only six in Canada. The expansion teams in Canada included no large urban centers additional to the original two, Montreal and Toronto. On the American side, New York acquired a second team and Los Angeles, Pittsburgh, and Philadelphia, not to mention more moderately sized cities like Washington, D.C., now had a new NHL hockey team.
For reasons that have not yet been carefully studied, fighting in the NHL increased hand in glove with the expansion of the League. In the 20 years from 1970 to 1990, the frequency of fights per game increased fourfold (see Figure 4). A popular theory has it that the League or at least the clubs encouraged fighting as a means of promoting revenue and popular interest in the sport. The expanding U.S. fan base was familiar with violent sports (football, boxing, even professional wrestling). It seemed likely that American fans would be attracted to a sport that included fighting. A recent econometric study of fighting in the AHL (Lockerbie, 2014) concluded that “fighting is not a profit-maximizing strategy for an AHL team owner.” The Lockerbie study, however, was carried out on archival data dating from 2002 to 2013; it followed the expansion period by a decade. It could be therefore that fighting was effective in promoting profit in the expansion period but not after the turn of the century. In addition, of course, the team owners may have thought it was a profit-maximizing strategy when, in fact, it was not. In any case, what caused the NHL to expand remains an open question.

Home advantage (the percentage of home wins minus 50) and the number of fights per game in the National Hockey League (NHL) by decades, 1951-2020.
The reaction to the increase in fighting began early in the expansion period. In a preseason exhibition game in 1969 a fight broke out between Ted Green of the Boston Bruins and Wayne Maki of the St. Louis Blues. The fight began with Maki pulling on Green’s jersey. Then Green gave Maki an elbow to the chin. Maki responded by spearing Green with his hockey stick. Green hit Maki over the shoulder with his stick, and Maki brought his stick down on Green’s head. Green fell to the ice and went into convulsions. He was rushed to hospital where he underwent the first of three operations on his multiply fractured skull.
Criminal charges were brought against both players. At the subsequent trials, the public was afforded a frank and detailed look at the players’ code. Its response was outrage, especially in the U.S. but also in Canada. Looking back on these events Allen (1999) wrote that the Green-Maki case “would create an impression about hockey in the United States that would be difficult to change. The brawl-filled 1970s followed, and the sport’s national growth [in the U.S.] was set back another quarter of a century.”
To many observers the most alarming aspect of the “brawl-filled 1970s” was the prevalence and growing importance of “enforcers.” Enforcers were players usually of minimal skills who were big and good at fighting. The code did not require a disrespected player to respond personally. It was sufficient if a teammate responded, and it did not have to be in the same game. An enforcer could punish the offender in a later game, when the circumstances better suited him, for example, when the enforcer’s team was playing at home. Owners and coaches did not like having to hire enforcers. Roster sizes were limited in size and NHL players were expensive. In 1990-1991, rosters were limited to 18 skaters plus 2 goaltenders, and player salaries averaged $271,000, 6 but there did not seem to be any alternative. According to an NHL Director of Hockey Operations, it was like having nuclear weapons. “They say: ‘I’ll get rid of mine if you get rid of yours. OK, you go first. No, you go first’” (Allen, 1999, p. 93).
There was more to the code than just fighting. It was also a cult of hypermasculinity, and it was here that the NHL Board made its first attempt to assert its authority over the code. In 1968, Bill Masterton was playing forward for the Minnesota North Stars. He was driven by a legal body check into the ice and hit the back of his head on the ice. He went into convulsions and was taken to the hospital, where he died 30 hr later. Though helmets were optional at the time, Masterton was not wearing one. Helmets were considered unmanly under the code and few players wore one.
“The majority of players had an awkwardly stoic reaction to Masterton’s death” (Allen, 1999, p. 191). It was an indication of their priorities that NHL players wore a cup and jock strap to protect their genitals while resistance to wearing a helmet to protect their brains was strong. Slowly, however, reality broke through and players began one by one to put on their helmets. Nevertheless, even though more and more players were choosing to wear them, the league did not mandate the wearing of helmets until 11 years later, in 1979. Even then, it only required players coming into the league to wear them. Veterans in the league were exempted. It was not until 1997 that the last helmetless player finally retired.
The Board’s second attempt to assert its authority over the code came closer to the bone. Hockey found many fans in America. They liked the sport as they liked almost all sports, including some that were more violent than ice hockey. And for the most part they did not dislike fighting. More than anything they were bewildered by it. What is it doing in a skill-and-combination sport like hockey? In bench-clearing brawls, all the suited players on both teams jumped onto the ice and attacked each other. It was impossible for the officials to control the fighting because there were too many fights going on simultaneously, and typically it required a considerable length of time before control could be restored. In 1984, a bench-clearing brawl between the Montreal Canadiens and the Quebec Nordiques lasted more than an hour. Bench-clearing brawls were as frequent in the 1980s as in the 1970s. In 1987, the League imposed a 10-game suspension on the first player off the bench to join a fight, the so-called “third-man-in” rule. There had been rules and penalties before 1987 for mass brawling but none of them were as harsh as the third-man-in rule, and there have been so far no further bench-clearing brawls.
The resistance to wearing helmets and mass brawling both belonged to the cult of hypermasculinity that enveloped the code. Neither served any conceivable police function. Not wearing a helmet was a show of disdain for physical injury, and the brawls were the very opposite of police action. Their successful curbing by the Board, while first steps in the struggle against the code, did not do much to damage the arguments in its favor. If anything, by eliminating two of its obvious excesses, it made the code somewhat easier to defend. So the upward trend in the frequency of one-on-one fighting, the core of the code, continued.
The climax came in September 1992. Everyone in the hockey world knew that the NHL Board had to do something and, when they heard what it had done, they expected it to work.
The Instigator Rule and the Frequency of Fighting
The instigator rule was instituted in 1992-1993, a year after video replay. The rule states that a player who instigates a fight should be given a 5-min major penalty for fighting, a 10-min misconduct penalty, and a game misconduct penalty; a 2-min minor penalty was added 4 years later. At the same meeting that the NHL board imposed these new rules, it also voted on a motion to impose a game misconduct on any player who became involved in a fight. This latter motion, if passed, would have ended fighting in the NHL. A game misconduct means ejection from the game and is sometimes accompanied by suspension and heavy fines on both the club and the individual or both. The 1992-1993 season was a banner year in many respects. Nevertheless, as at least one observer noted, the players were not oblivious to the Board’s actions: “During the following season [1992-1993], players got their acts together fast” (Lozo, 2015).
The instigator rule was (and is) very controversial. Its avowed purpose was to reduce fighting and, as can be seen (Figure 4), it was followed by a sharp and sustained fall in the frequency of fighting. Commissioner Bettman and the NHL club owners did not have home advantage in mind when they instituted the instigator rule in 1992. They had fights in mind; there were too many of them and something had to be done. The instigator rule was the something they did and their hope was that it would suppress fighting, not entirely perhaps but substantially. Hockey players, fans, and commentators, those who oppose the instigator rule as well as those who support it, are generally agreed that they succeeded. It is certainly true that the frequency of fights in the NHL has declined sharply since the early 1990s (Figure 4).
The rule, however, had other consequences, in fact, a cascade of them. To the extent that the instigator rule was less frequently invoked, the number of penalty minutes (PIMs) per game should decline. Given the known intent of the rule, infractions that frequently lead to fighting (roughing, spearing, high sticking, interference) would be expected also to decline. Overall, the average number of PIMs a team is charged with should decrease. PIMs per team per game declines 38.8% from the first two seasons to the last two (Figure 5). The decline, moreover, is regular. The rank correlation (τ) between PIMs and season 1991-1992 to 2000-2001 equals 0.87 (p < .001).
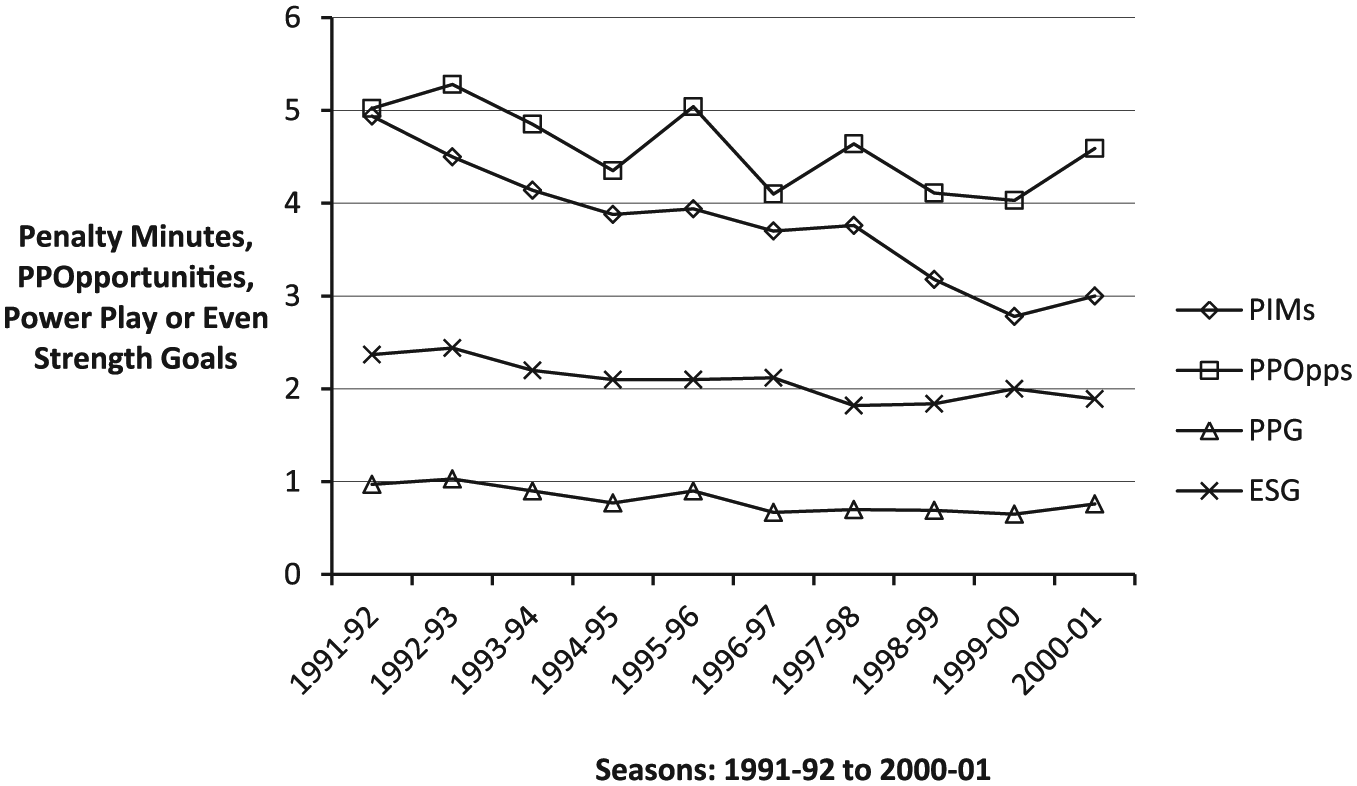
Penalty minutes (PIMs) in units of 5 min, power-play opportunities (PPOpps), power-play and even-strength goals (PPG and ESG), by season, 1991-1992 to 2000-2001.
PIMs did not result in a power play unless they were unbalanced; one team had more minutes than the other. Therefore, the decline in PIMs was not necessarily paralleled by a decline in power-play opportunities (PPOpps). In fact, however, it was (Figure 5). The decline from the first two seasons to the last two was shallower than for PIMs, 16.0%, but also reasonably regular (τ = .51; p < .05).
With declining opportunities for a power play, power-play goals would also be expected to decline; and so they did (Figure 5). The decline was roughly the same, 37.5%, as the decline in PIMS and also quite regular, though less so than the regularity of PIMs (τ = .67, p < .01).
Even strength goals are not directly affected by PIMs. It is therefore not expected that they should decline. Nevertheless, they do (Figure 5), by 19.1%, not as much as PIMs and power-play goals decline but with significant regularity (τ = .63; p < .01).
Figure 6 presents home advantage in the NHL in game outcome (wins or losses), goals, power-play goals, and even-strength goals by year, 1991-1992 to 2000-2001. The first two years, 1991-1992 and 1992-1993, are presented singly. The remaining eight years are pooled in pairs, 1993-1994 and 1994-1995,…, 1999-2000 and 2000-2001. The reason for the pairing is to eliminate some of the local irregularities so that the trends become more prominent.

Home advantage in game outcome, goals, power-play goals, and even- strength goals.
The result is surprisingly clear. The falls in home advantage of all four curves took place almost entirely in the first year that the instigator rule was instituted. In the remaining eight years of the decade they fell at most another point and in the 16 years since 2000-2001 they may have dropped another point.
Look back at Figure 4. Fighting could not itself have been responsible for the fall in home advantage. Most of it did not take place until after the decade of the 1990s had ended; and most of the decline in the 1990s took place after 1992-1993.
As for the performance consequences of the instigator rule, look back at Figure 5. In 1992-1993 PIMs dropped from 24.7 to 22.5 minutes out of the 9.8 points it dropped from the first two years together to the last two. The other three measures did not drop at all from the first to the second year. Over the entire decade the four measures follow a declining and irregular but basically linear course. In short, the performance consequences of the instigator rule depicted in Figure 5, while they clearly declined over the course of the 1990s, did so after the fall of home advantage. Therefore, they cannot have mediated the fall and must be ruled out as causal to it.
At the same time, the instigator rule does seem to have triggered the fall, even though it cannot be said to have “caused” it, at least not by itself. The response of the clubs and players to the rule must also have been involved. With the rule in place, the players’ behavior with respect to location, home or away, changed abruptly. They performed much better on the road than they had done for 40 years, and they have continued to perform better so far in the 21st century.
Theory, Away Disadvantage, Teamwork, and the Role of the Authorities
When the Board finally acted, home advantage fell immediately to half of what it was prior to the instigator rule, whereas fighting itself and the performance consequences of the instigator rule (PIMs, PPOpps, power-play goals, and even-strength goals) fell slowly and did not flatten out until at least the turn of the century. What accounted for this difference? Why did home advantage respond so much more quickly than the rule’s other consequences?
The following attempt to answer this question is based on the teamwork theory of home advantage (Jones, 2015, 2018). This theory is the latest attempt to explain a phenomenon that characterizes all team sports. 7 It begins conventionally with the idea that home advantage grows out of the situation a team faces “on the road,” where it plays against another team in its own arena (stadium, court, or field) and supported vociferously by the hometown crowd. It then parts company with its predecessors by arguing, first, that home advantage is better understood as an away disadvantage than as a home advantage and, second, that the home (away) effect is mediated by the interaction between players on the same team, their teamwork, and not by either what they do as individuals or by the officials (both of which have been argued by other theorists).
With respect to away disadvantage, it must be immediately conceded that home advantage and away disadvantage come to the same thing numerically:
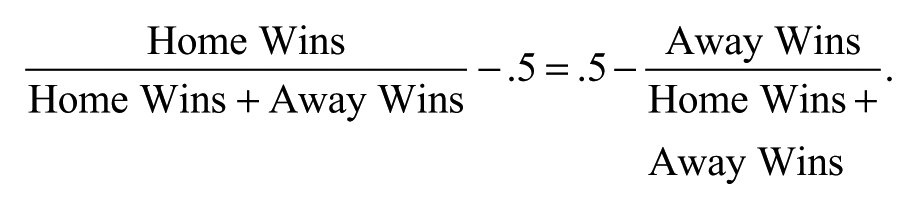
Nevertheless, the two formulations do differ in where the action is thought primarily to take place, and this difference may make one of the formulations a more comfortable theoretical context than the other.
The teamwork theory contends that a team is disadvantaged when it plays away (Jones, 2015, 2018). How does that work? A team playing away experiences a special kind of stress. The crowd wants the home team to beat them. When the away team does well, there will be silence; and when the home team does well, there will be wild cheering. Often the crowd is hostile; it not only wants a home win, it wants the home team to humiliate the visitors. This kind of stress is threatening. The away players feel under attack, not always, of course, and not to the same degree but much of the time and almost never warmly supported as they feel at home.
One of the best established results in the literature on stress is that threat produces “attentional narrowing” in the person threatened and, further, that this narrowed attention focuses on the objects which threaten them, in the case of team sports, the opposition players (Combs & Taylor, 1952; Driskell, Salas, & Johnston, 1999; Easterbrook, 1959).
Teamwork, however, requires a player to pay attention to his or her teammates, where they are, what they are doing, what they will do next. A basketball player needs to know who among his or her teammates is open and best positioned to shoot or advance the ball down the court. A quarterback needs to know not only the route a receiver is running but where on that route he is. The four players in a soccer back line need to move together in setting an offside trap. A defensive attitude focused on the opposition players tends systematically to disrupt teamwork. The away team’s attention is systematically misdirected,
The threat posed by playing away has three components. The threat is that the away players will lose and is loudly voiced by the hometown crowd, the home players are positioned to deliver the threat, and both components are intentional. Playing way, however, is not the only circumstance that puts a team on the defensive. Nor does every such circumstance lead to an away disadvantage. Injuries in the National Football League (NFL) are a case in point; as a season progresses, injury prevalence increases. As injury prevalence increases an as-yet-uninjured player has more and more reminders that he too can be injured, the more reason he has to play with caution and circumspection. Nevertheless, injury prevalence in football lacks all three of the defining components of a relevant threat. With rare exceptions, the hometown fans do not want to see a visiting player injured and, again with rare exceptions, the hometown players do not intend to injure their opponents. The injuries themselves are mainly accidental and do not always result from contact with an opposing player. Sometimes teammates collide and occasionally a player is injured without contact.
However, if injury prevalence is equal, home and away, and the home crowd and players do not intend to inflict injury on the away players, then, however antagonistic the home side may be in other respects, there is no additional threat due to injuries, and, therefore, no attentional narrowing, impaired teamwork, or away disadvantage (van Steenbergen, Band, & Hommel, 2011). 8
Fighting in hockey is another circumstance that puts a team on the defensive, and in this case “the defining components of a relevant threat” are definitely present. The hometown crowd roots as lustily for the home player in a fight as it does for the home team to win, and the home players do their best to realize their intentions. When fighting is “part of the game,” it amounts to an additional threat, not just to defeat the away team but to intimidate and beat it up as well. Thus, as the frequency of fighting declines, home advantage falls.
The teamwork theory explains why a fall in fighting would lead to a fall in home advantage but it does not explain, at least not as previously put forward, how the fall could take place in a single year. To explain why home advantage in the NHL fell abruptly in the one year 1992-93 requires an additional hypothesis. Any such hypothesis is ad hoc and therefore not especially convincing. It is advanced after the fact to explain an otherwise unexplained result. Of course, future results may confirm an ad hoc hypothesis and, even when it is first stated, it at least suggests the possibility of an explanation.
For 20 years the NFL expanded, primarily into the American market, and for 20 years the controversy over the abnormality of old style hockey intensified, as the frequency of fighting increased. Everywhere except in North American professional hockey, fighting meant ejection from the game and possibly additional suspensions, and the players themselves came increasingly from college hockey in the U.S. or Europe, where they had no experience of fighting as “part of the game.” Sooner or later the NFL would have to fall in line with the international consensus and the financial realities of the sport, and everyone knew it. After two successful attempts to curb the cult of hypermasculinity, the NHL Board of Directors finally imposed a rule directly curbing one-on-one fighting. The Board’s avowed intention was to reduce the frequency of fighting in the NHL. But the instigator rule addressed at most one of the two players involved in a fight and most of the time not even one, because which player had instigated was not clear. Nevertheless, the players and clubs responded as if the Board’s intentions had already been realized. Or so it seems. The ad hoc hypothesis simply asserts that what seems to have happened actually did happen, namely, that in exceptional circumstances coaches and players may respond to the intentions of the presiding authorities and their probable consequences rather than the immediate implications of a rule.
Footnotes
Appendix
Home advantage in the abbreviated season equaled 9.38%. The best available basis for estimating what it would have been if the 1994-1995 season had not been abbreviated is the pooled within-conference games in the immediately preceding and immediately following years, both unabbreviated. In the 1993-1994 season, there were 659 such games and in the 1995-1996 season 636. Home advantage based on the total of 1,292 games was 5.42%, making the extent to which home advantage in the abbreviated season jutted upward from the general course of the home effect 3.96%. This difference is not statistically significant (z = 1.55, p = .05). 9
A significant result, however, would not have resolved the problem, because the question at issue is to determine how much of the 3.96% difference is due to the abbreviated season and how much to sampling variation. Much or even all of the 1994-1995 effect could have arisen because of a sampling variation. It was selected for analysis because of its coincidence with the abbreviated season. A test of significance showing that the entire difference could not be explained as a sampling variation does not necessarily implicate any part of it as due to the abbreviated season. That association could still have been caused after the fact solely by its anomalous size and consequent selection.
Where an association is suggested by capitalization on chance, a formal test must be deferred to (necessarily other) data which are identified by the hypothesized causal conditions and not at all by the hypothesized effect. In the present case, another year or years must be found in which the schedule was abbreviated in the same way as in 1994-1995. The response, no longer an object of selection, can then be studied as a true effect. Fortunately and not a little surprisingly, there exists such a year. In 2012-2013, there was another owner’s lockout and another abbreviated schedule that started in late January instead of late October, and the League’s response was the same. The schedule was restricted to within-conference games. Even the number of games was the same as in 1994-1995; each team played 24 games at home and 24 away.
The analysis was carried out in the same way as in 1994-1995, by comparing home advantage in the abbreviated year with home advantage in the pooled within-conference games in the immediately preceding and immediately following years, 2011-2012 and 2013-2014. In 2012-2013, the home team won 409 out of 720 games, all within conference, for a home advantage of 6.81%. Within-conference games in the two adjoining years totaled 1,742, 10 of which the home team won 947, for a home advantage of 4.36%.
If this difference (6.81 – 4.36 = 2.45) were reliable, it would be appropriately interpreted as due to the abbreviated season. The corresponding difference in 1994-1995, 3.96, would then be attributable 62% to the abbreviated schedule and 38% to sampling variation. Furthermore, the estimate in Figure 1 for home advantage in 1994-1995 could legitimately be adjusted downward by 2.45 points, making the adjusted value equal to 6.93. The anomalous upward jut in 1994-1995 would then have been reduced to a normal bump.
Unfortunately, the difference of 2.45 percentage points between 2012-2013 and its immediately neighboring controls is not significant (z = 1.55; p > .05). Hence, in the rest of the analysis the estimate for 1994-1995, 9.38, has been treated as it stands in Figure 2. In Figure 6, for example, the estimate for 1993-1994 and 1994-1995 combined was taken as the average of the estimate for 1993-1994 and 9.38, weighted for sample size.
Declaration of Conflicting Interests
The author(s) declared no potential conflicts of interest with respect to the research, authorship, and/or publication of this article.
Funding
The author(s) received no financial support for the research, authorship, and/or publication of this article.