
Abstract
This meta-analysis attempts to synthesize the Monte Carlo (MC) literature for the linear mixed model under a longitudinal framework. The meta-analysis aims to inform researchers about conditions that are important to consider when evaluating model assumptions and adequacy. In addition, the meta-analysis may be helpful to those wishing to design future MC simulations in identifying simulation conditions. The current meta-analysis will use the empirical type I error rate as the effect size and MC simulation conditions will be coded to serve as moderator variables. The type I error rate for the fixed and random effects will be explored as the primary dependent variable. Effect sizes were coded from 13 studies, resulting in a total of 4,002 and 621 effect sizes for fixed and random effects respectively. Meta-regression and proportional odds models were used to explore variation in the empirical type I error rate effect sizes. Implications for applied researchers and researchers planning new MC studies will be explored.
Introduction
The linear mixed model (LMM), also commonly referred to as a multilevel model (Goldstein, 2010) or hierarchical linear model (Raudenbush & Bryk, 2002), is an extension of the multiple regression model to account for cluster dependency arising from nested designs. Included within nested designs are longitudinal designs where repeated measurements are nested within an individual. This data setup will serve as the primary focus of this article. These series of models were first introduced in the early 1980s (Laird & Ware, 1982), and the rapid improvement in computational power has helped these models become a popular data analysis method for researchers.
The LMM takes the following general matrix form:

This is very similar to the multiple regression model, except now there are additional terms,
The random components of the LMM (i.e.,
The statistical assumptions for the LMM are difficult to assess analytically due to the computationally intensive and iterative procedure of obtaining model estimates. In addition, when normality of the random components is not assumed, the mathematics becomes increasingly more difficult and intractable. As a result, Monte Carlo (MC) methods have been used to explore the relationship between assumption violations and model performance (Skrondal, 2000). MC studies have the advantage of strong internal validity due to the researcher directly manipulating the conditions of interest. The direct manipulation is not unlike true experiments, where the researcher can isolate the source of problems when estimating parameters (Skrondal, 2000).
The major drawback in MC studies is the potential lack of external validity (Skrondal, 2000). This weakness stems from the MC results being conditional on the conditions chosen to study. For example, if researchers conducting an MC study only simulate the random effects coming from a normal or chi-square(1) distributions, the question must be asked, can the study results be generalized beyond those two distributions. Hoaglin and Andrews (1975) started a discussion of best practices when reporting and conducting MC studies. More recently, Paxton, Curran, Bollen, Kirby, and Chen (2001) and Skrondal (2000) have offered design considerations to improve external validity. Much of the recommendations surround reducing the number of replications to increase the coverage of the simulation conditions (Skrondal, 2000).
Although the papers by Paxton et al. (2001) and Skrondal (2000) offer suggestions for improving new MC studies, the design considerations from past MC studies can not be altered to improve the external validity. As such, the current study aims to leverage prior MC studies to help improve the external validity of these studies, better understand gaps in simulation conditions, and succinctly inform applied researchers of assumption violations that can greatly affect the study results. This article aims to accomplish these three goals by quantitatively synthesizing the MC longitudinal LMM literature with a meta-analysis. The meta-analysis allows for the pooling of study conditions across numerous MC studies to increase sample size and depth of coverage of simulation conditions. In addition, many MC studies only report descriptive statistics for the study results and may miss complex interaction effects found through inferential modeling. A meta-regression was performed to overcome this limitation of some of the MC literature. A similar study for the one- and two-factor ANOVA models was done by Harwell, Rubinstein, Hayes, and Olds (1992).
Common Simulation Conditions With the LMM
MC studies exploring assumption violations with the LMM have focused primarily on the impact of nonnormal random effect distributions (LeBeau, 2012, 2013; Maas & Hox, 2004, 2005), the effect of serial correlation (Browne, Draper, Goldstein, & Rasbash, 2002; Ferron, Dailey, & Yi, 2002; Kwok, West, & Green, 2007; LeBeau, 2012; Murphy & Pituch, 2009), missing data (Black, Harel, & McCoach, 2011; Kwon, 2011; Mallinckrodt, Clark, & David, 2001), and estimation method (Delpish, 2006; Overall & Tonidandel, 2010). The random effect distributions simulated tend to be normally distributed, skewed (such as a chi-square distribution), or have heavy tails (such as a t or Laplace distribution). The serial correlation structures also tend to fall into three categories, independent structures, autoregressive (AR) type structures, or banded structures (such as the moving average models).
Most MC studies include sample size as a simulation condition, where, surprisingly, there is little variation in sample sizes used. The number of repeated measures is commonly less than 10 and the number of clusters rarely is larger than 100. The choice of sample size conditions is likely a function of using maximum likelihood for estimation. Maximum likelihood is an asymptotic estimation method, as such, understanding how the estimation method behaves for small samples is informative, and increasing sample size would likely improve estimation.
The number of fixed and random effects is another aspect of the simulation design that is chosen by the researcher. Unfortunately, these are two design choices that are commonly not manipulated directly. Instead, the number of fixed effects and random effects are held constant across studies. In addition, there is even less variation in the number of fixed and random effects chosen by researchers. It is uncommon for the number of fixed effects to be larger than six and the number of random effects to be larger than two.
The advantage of the current meta-analysis is to attempt to combine unique design choices made by independent researchers. This can offer some insight into data conditions that were not manipulated directly in a single MC study (such as the number of fixed effects), but do vary across studies. In addition, the slightly distinctive design choices made for a single manipulated condition (such as sample size or random effect distribution) can again be combined to explore whether one condition has a larger effect than others. This can aid applied researchers in their ability to understand implications when certain model assumptions are not met in practice. In addition, it can help inform researchers designing MC studies about gaps in the literature that would be worthy of further study.
Assumption Violations With the LMM
Results of the MC studies with assumption violations can be grouped into three categories. Estimation of the fixed effects tends to be unbiased regardless of the assumption violations (e.g., Kwok et al., 2007; LeBeau, 2013; Maas & Hox, 2004; Murphy & Pituch, 2009). This has been shown with nonnormal random effect distributions (LeBeau, 2013; Maas & Hox, 2004), different sample sizes (LeBeau, 2013; Maas & Hox, 2004, 2005), with the presence of serial correlation (Kwok et al., 2007; LeBeau, 2012; Murphy & Pituch, 2009), and with different estimation algorithms (Delpish, 2006). Therefore, if the researcher is solely interested in estimates of the fixed effects, then little care to assumption violations is needed.
However, if the researcher is interested in estimates of the random effects or inference with the LMM, then researchers need to pay specific attention to assumption violations. Nonnormal random effects can inflate estimates of the random effects, especially in small sample size conditions (LeBeau, 2013; Maas & Hox, 2004). In addition, not modeling serial correlation when present can also cause an inflation in the random effects and underestimate the standard errors for the fixed effects (Kwok et al., 2007; LeBeau, 2012; Murphy & Pituch, 2009). This can lead to an inflation in the empirical type I error rate. Finally, misspecifying, specifically underspecifying, the random effect structure can also lead to severe inflation of the empirical type I error rates for fixed effects (LeBeau, 2012).
These results suggest that checking of model assumptions is important when researchers are interested in conducting inference, which likely encompasses most applied researchers. In addition, inflated estimates of the variance of the random components can lead researchers to include predictors to explain variation, when in reality, this variation is smaller than expected. A quantitative synthesis can be informative for applied researchers to show which assumption violations are crucial to achieving valid inferences. The MC literature can also be better informed through the ability of this study to include moderator variables that were not directly manipulated within a study, but were between studies, such as number of fixed effects.
Research Questions
Based on the prior MC literature, the following research questions were explored in the current meta-analysis:
Method
Data Collection
Articles, dissertations, conference papers, or unpublished documents were gathered to attempt to answer the research questions above. Documents were selected if they are simulation studies that reported empirical type I error rates for the fixed effects. Only studies with continuous outcome variables were included to keep the comparison consistent. The simulation studies must include longitudinal data conditions, specifically multiple measurement occasions for individuals that are often smaller than cross-sectional models (Singer & Willett, 2003).
Based on the above criteria, the population of studies is defined as all possible MC LMM studies exploring data conditions similar to longitudinal studies using a continuous dependent variable. An initial search was performed in March 2012 and follow-up searches were performed in April 2013 and June 2014. Articles were selected for relevance based on their title. Abstracts from the articles selected by their titles were read to determine their relevance. If the study met the criteria established above, it was set aside to be read and code information from the study.
A Boolean search was used with the Eric, PsycInfo, and Dissertation Abstract databases to search for documents to be coded. The Boolean search string took the following form: (“Monte Carlo” or simulation) and (“linear mixed model” or “hierarchical linear model” or “mixed effects” or “mixed-effects” or longitudinal or LMM or HLM or LMEM) and generalized and (nonlinear or Bayesian or SEM or “structural equation model”).
The search identified 223 articles for review. Of those 223 articles, a total of 25 were selected for inclusion and were read further to include in the meta-analysis. There were three primary reasons why studies were excluded: (a) The article did not report empirical type I error rates (or it was not an outcome), (b) the study was cross sectional, or (c) the study was done in the structural equation modeling framework.
After studies were found using the above manner, Google Scholar was used to find articles that cited the articles found above. Footnote chasing was also used by exploring the titles in the reference list of the articles selected. The titles and abstracts of studies identified through Google Scholar were screened for inclusion.
From each of the sampled studies, effect sizes and a number of study characteristics were coded to help with the data analysis step of the meta-analysis. Three independent readers, who had completed PhD training or were in a PhD program related to quantitative methods, completed the coding of the studies included in this meta-analysis. One individual coded all the studies and the other two individuals independently coded approximately half of the studies to evaluate coding consistency. Internal consistency was high on all coded variables, including the primary dependent variable, the empirical type I error rate. For the primary dependent variable, 98% of the values were coded the same across coders. Those that did not match were reviewed by looking at the original study for verification of the correct values.
Data Evaluation
Studies were first checked to ensure that they contained the dependent variable of interest, the empirical type I error rate. If the studies do not contain the empirical type I error rate or if the study used an empirical type I error rate other than 0.05, the study was not coded. The studies were then checked for methodological/coding flaws. Evidence that the data were generated accurately was explored first. If studies appear to show inaccuracies when the model assumptions have been met compared with the body of MC literature, they will be excluded from the sample of studies due to severe methodological or coding flaws. No studies were removed due to methodological or coding flaws.
All studies were read one at a time to code the variables of interest. Each MC study contributes many effect sizes to the meta-analysis; however, due to the quasi-random number generation within each study, the effect sizes are assumed to be independent within a study. However, there may be coder or author effects that need to be considered, and this potential dependency was adjusted by using an LMM and is discussed in more detail below.
Accuracy in coding was checked to ensure that all the effect sizes were coded properly. Summary statistics and plots were used to examine the distribution of effect sizes looking for possible extreme values because of erroneous coding. Very large or small empirical type I error rates were checked against the values published in the manuscripts. After errors were corrected, exploratory and inferential data analyses were used to attempt to explain variation in effect sizes. The coded variables and analyses are described in more detail below.
Dependent Variable
The primary dependent variable in the current meta-analysis was the empirical type I error rate for each condition in the MC studies. The type I error rate is commonly reported as the proportion of tests that reject a true null hypothesis. Statistical theory informs us that the proportion of rejected tests when the null hypothesis is true should be very close to the
Independent Variables
The primary independent variables were the conditions that the MC studies directly manipulated. Variables commonly manipulated are the cluster sample size (i.e., how many individuals), presence of serial correlation, what kind of serial correlation structure is assumed, and the number of measurement occasions. Other conditions that are commonly not manipulated within an MC study that were coded included how many fixed effects are in the model, the number of random effects in the model, the number of replications within a cell of the study design, estimation method (e.g., full information maximum likelihood, restricted maximum likelihood [REML]), and whether the design was balanced or unbalanced.
The random effects are commonly assumed to follow a normal distribution, and violating this assumption has been studied thoroughly with numerous MC studies. The simulated random effect distribution was coded. In addition to the name of the coded distribution, the theoretical and empirical skewness and kurtosis values were coded for the random effects distribution. These independent variables were used to help determine whether the skewness or kurtosis of the distribution has a larger impact on the type I error rate.
Data Analysis
Exploratory data analyses were used to explore variation in the effect sizes. If significant variation in the empirical type I error rates was found, an LMM was used to see whether any moderator variables explain variation in the type I error rates. The LMM was chosen due to the hierarchical structure of the empirical type I error rates, which is illustrated in Figure 1.

Data structure for model.
The empirical type I error rates are proportions. As a result, the variance is a function of the specific value of the empirical type I error rates and the sampling distribution is unlikely to be normally distributed. Therefore, the empirical type I error rates were transformed using the Freeman–Tukey transformation (Freeman & Tukey, 1950). This transformation takes the following form:

where
The variance of the transformed proportions (

where

where
Inferential model
The LMM was fitted with REML as this has been shown to produce less biased estimates of the random components (Fitzmaurice, Laird, & Ware, 2004; Raudenbush, 2009). The LMM took the following general form:

In Equation 5,
First, an omnibus model with no covariates was used to explore the heterogeneity in the effect sizes. The Q test was used to assess the amount of heterogeneity (Cooper, Hedges, & Valentine, 2009). If this test was significant, covariates were added to attempt to explain variation in the effect sizes with a meta-regression (Cooper et al., 2009). The covariates will take the form of simulation conditions that were coded and discussed above. Descriptive analyses will help to inform which covariates are included in the model. Significant predictors will be identified when the z value is greater than 2.33 in absolute value, representing a p value less than .01. The level of significance was selected to help control for compounding type I error rates from many tests of predictors in the analysis and better reflect covariates of practical significance.
To assess the amount of explanatory power of the predictors, an

where
A similar analysis to that described above was also done using the empirical type I error rate for the random effects. In this analysis, the dependent variable was
Proportional Odds Models (POMs)
POMs (Yee, 2015) were also explored to further attempt to understand variation in the empirical type I error rates for the fixed effects. A new dependent variable was defined that represented three ordinal categories. These ordinal categories represented conservative tests (with a level of significance less than .05), accurate tests, and liberal tests (with a level of significance greater than .05).
To determine which group each observation belonged in, confidence intervals (CIs) were created for the empirical type I error rate reported for each condition. These took the following form:

where
This variable was then modeled using a POM that had three categories. This model took the following general form:

where the log odds of being less than or equal to a given category
The POM assumes that the regression weights are consistent between the two cumulative logits defined above, referred to as the parallel regression assumption (Yee, 2015). This assumption will be explored empirically using nested model chi-square comparisons (Yee, 2015). If there is evidence that the slopes vary, these will be allowed to vary between the two cumulative logits modeled. This strategy revealed that the covariate, model term (i.e., intercept, linear slope for time, other within slopes), did not satisfy the parallel regression assumption; as a result, these were allowed to vary between the cumulative logits described above.
A POM was also fitted for the empirical type I error rate of the random effects. There was a total of 160
Software
Data analysis was performed with R (R Core Team, 2015) using the metafor package (Viechtbauer, 2010). This included the fitting of the model shown in Equation 5 and the calculation of the Freeman–Tukey transformation, back-transformation, and the variance shown in Equations 2 through 4. POMs were fitted with the VGAM package (Yee, 2010, 2015). Figures were generated with the ggplot2 package within R (Wickham, 2009).
Limitations
There are at least three limitations of this study. The first stems from the nature of the meta-analysis, in that, studies that did not report the empirical type I error rate cannot be included in this meta-analysis. Second, the studies included in this meta-analysis are not a random sample of the population of MC studies; therefore, the results are fixed to the MC conditions coded from the included studies. The extent to which the studies not included (due to omission or did not report the empirical type I error rate) are significantly different than the included studies could bias the results. For this reason, some care needs to be taken when interpreting the results and the external validity may be affected. Both limitations overlap as the MC studies that did not report the type I error rate were also more likely to be journal articles. The degree to which these studies are different than the ones included in this meta-analysis may bias the results. Finally, many of the coded studies included in the meta-analysis were published in social science journals or were other document types completed within a social science context. The degree to which the data conditions included in the primary studies is different in disciplines outside of social science domains may affect the external validity.
Results
Fixed Effects
Summary information about the 13 articles coded in the meta-analysis is shown in Table 1 (two articles, Kwon [2011] and LeBeau [2012], are represented in four rows of Table 1 as they had two studies within a single article). As can be seen from Table 1, there are a total of 4,002 empirical type I error rates for the fixed effects with an average unweighted type I error rate of 0.063% and 95% CI = [0.055, 0.070]. The distribution of weighted effect sizes was highly concentrated between 0 and 0.1, but there were effect sizes greater than 0.15 and even one effect size larger than 0.4.
Article Summary Information of Unweighted Empirical Type I Error Rates for the Fixed-Effects and Other Monte Carlo Conditions.

Note. K = number of effect sizes; Repl = replication; T1 = type I error rate; Med = median; Min = minimum; Max = maximum; FE = fixed effects; CS = cluster size; wCS = within-cluster size; Jour = journal article; Diss = dissertation.
Additional summary statistic information for weighted back-transformed empirical type I error rates separated by various potential moderators can be seen in Table 2. From the table, there appears to be differences based on many of these moderators. For example, missing a random effect appears to have a strong impact on type I error rate with a mean of 0.078 compared with 0.055 when all random effects are modeled. Figure 2 shows the interaction between missing a random effect and the fixed effect term (e.g., intercept, time, or other within). As can be seen from Figure 2, the empirical type I error is only inflated for the fixed effect terms associated with time, the others are similar to one another.
Summary Statistics of Weighted Back-Transformed Empirical Type I Error Rate for the Fixed Effects by Parameter, Level of Parameter, Article Source, Cluster Size, Within-Cluster Size, Serial Correlation, Random Effect Distribution, and Missing Random Effect.

Note. T1 = type I error rate; Med = median; Min = minimum; Max = maximum; K = number of effect sizes; Intercept = regression terms modeling the intercept; Time = regression terms modeling time; Within = regression terms of another within-cluster variable.

Density plot of weighted empirical type I error rates by missing a RE and fixed effect term.
Table 2 also shows that there are some differences in the empirical type I error rate for differing simulated random effect distributions. The empirical type I error rate for the Laplace and chi-square(1) distributions were inflated at 0.067 and 0.066, respectively, compared with the other two distributions at 0.054 and 0.056 for normal and uniform, respectively. The distributions of the empirical type I error rate for the simulated random effect distributions also showed evidence of being positively skewed. This can be seen from the median being less than the mean and with large maximum values most notably for the normal, Laplace, and chi-square(1) distributions.
The effect of sample size is difficult to see from Table 2. For many sample sizes, the empirical type I error rate is close to the theoretical value of 0.05. Some deviations from this occurs when the cluster sample size is 25 and the within-cluster sample size is 6, 8, and 20. There may be more complicated effects that underlie the data here, and these differences will be explored in more detail with the inferential model.
Finally, considering the variance and the number of replications, the weighted average empirical type I error rate was 0.058 with a 95% CI = [0.054, 0.062]. In addition, the omnibus Q test was significant,
Inferential statistics
Expanding on the significant Q test, simulation conditions were added to the model to attempt to explain variation in the empirical type I error rate. The predictors explained significant variation as shown by the significant chi-square test for moderators,
Fixed Effect Meta-Regression Results for Significant Predictors in the Transformed

Note. Reference groups were dissertations, normal random effect distributions, intercept fixed effect terms, and independent fitted and generated serial correlation structures. CI = confidence interval; RE = random effect; Fit = fitted; SC = serial correlation; ARMA = autoregressive moving average; MA = moving average; Miss = missing; w/ = within; colon (:) = an interaction.
The average empirical type I error rate for the intercept term (i.e., initial status) is very close to 0.05 at 0.048. This suggests that, on average, the empirical type I error rate control is very good for the reference group. More specifically, this is for dissertations, a normal random effect distribution, and independent fitted and generated serial correlation structures. More simply, this would represent the situations where model assumptions have been adequately met. Assumption violations, such as nonnormal random effects, does not affect the empirical type I error rate for the intercept. This can be seen from Table 3, where the back-transformed values associated with the intercept are zero to two or three decimal places.
On average, the time or linear trend fixed effect did not show evidence of being significantly different from the initial status. However, there was evidence of inflation, on average, when the random effect distribution was misspecified, an increase of 0.028 in the empirical type I error rate metric. This results in an estimated empirical type I error rate of 0.076, an approximately 50% increase in the empirical type I error rate metric.
There is evidence that including some form of serial correlation does improve the empirical type I error rate, but does not fully overcome the inflation due to misspecification of the random effect structure. This can be seen by the negative coefficients for the time by fitted serial correlation by misspecification of the random effect three-way interaction. Estimates for these terms are not as large as the time by misspecification of the random effect two-way interaction, suggesting an adjustment but not full correction of the inflation. The first-order autoregressive (AR(1)) and first-order autoregressive moving average (ARMA(1, 1)) seem to do the best job of correcting the inflation, shown in Figure 3. The figure shows the fixed effects associated with time and a misspecification of the random effect structure, the empirical type I error rate is inflated. The effect is particularly large when the fitted serial correlation structure is independent (i.e., assuming no serial correlation underlies the data). Including some form of serial correlation does help to limit the strong inflation however.
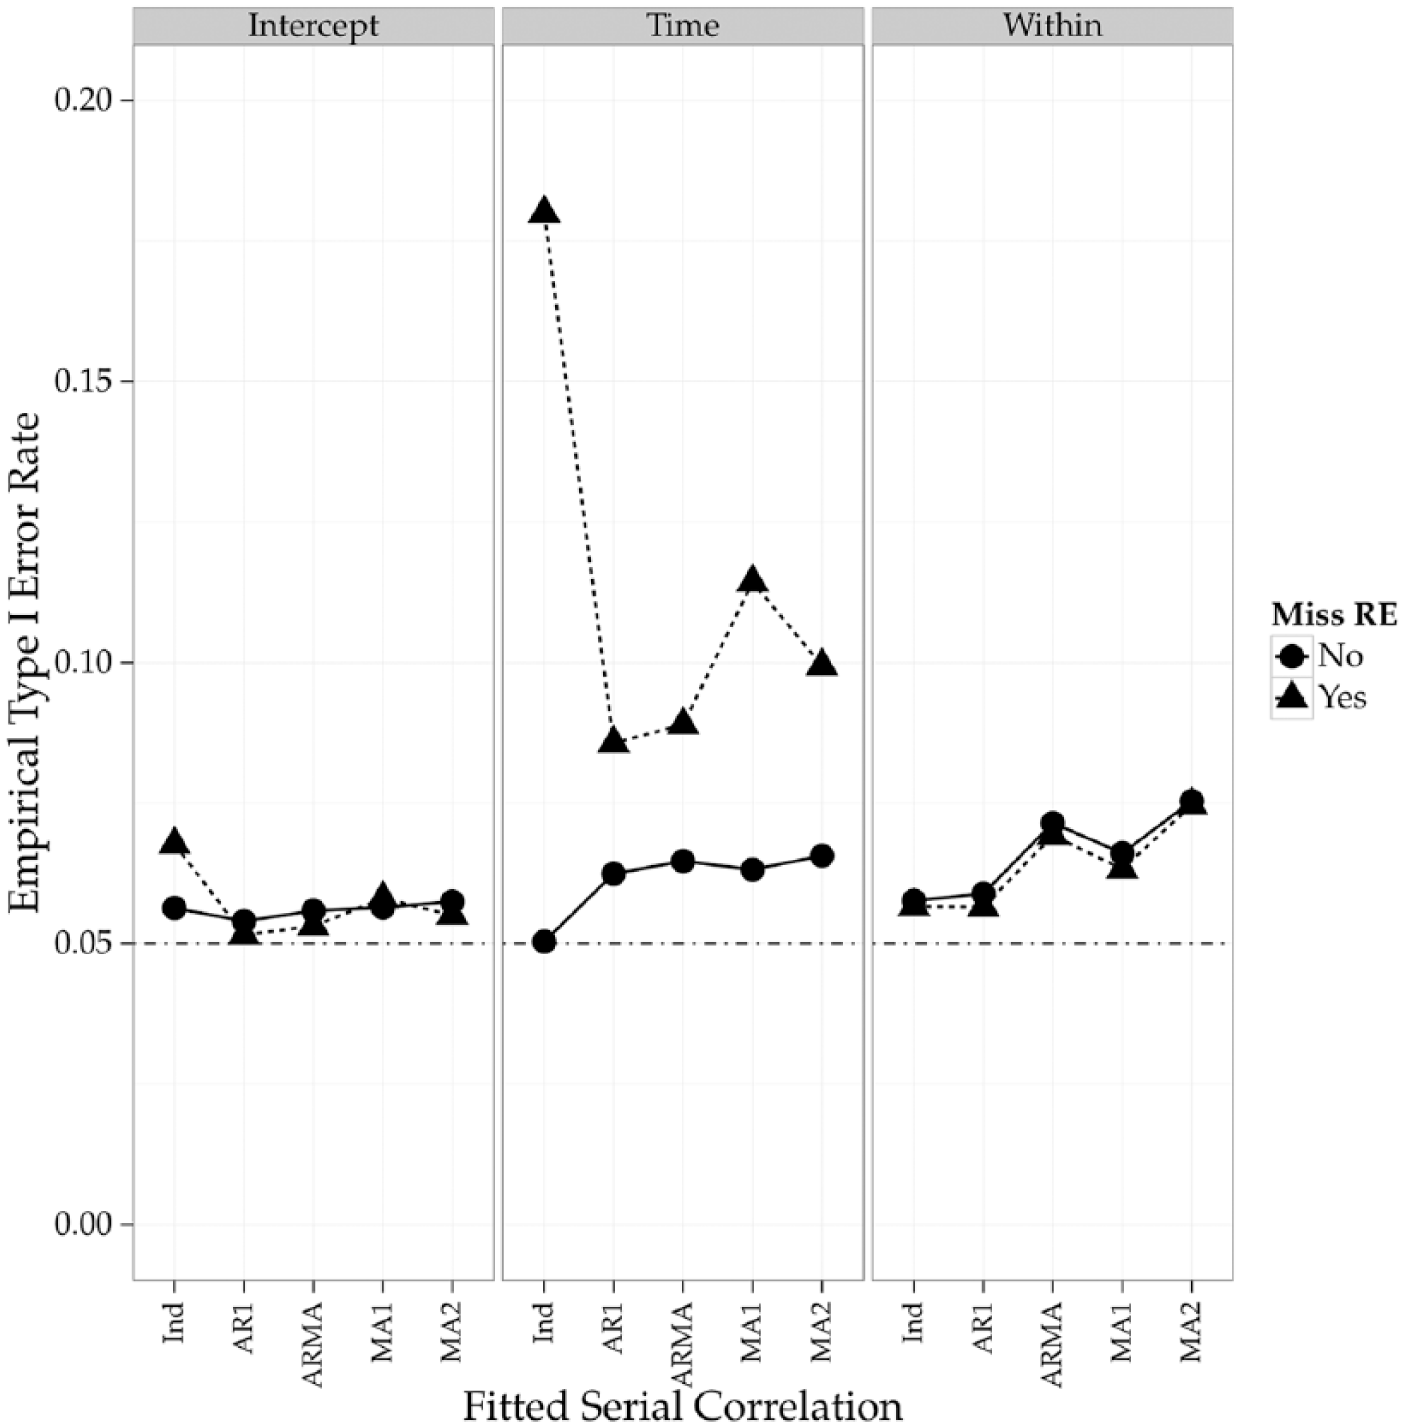
Interaction plot showing three variable interaction between fixed effect term, fitted serial correlation structure (Toeplitz and unstructured omitted from figure), and misspecification of the random effect structure.
Other within individual variables behave very similar to the intercept term. There are significant terms labeled as “Within” in Table 3, but many of these have very small estimates suggesting terms of little practical significance.
POM
Results for the final POM can be seen in Figure 4 for covariates of primary interest. This plot depicts an interaction between the generated and fitted serial correlation structure, the model term, whether the random structure was misspecified, and the two cumulative logits shown with solid lines (

Interaction plot showing results of the partial proportional odds model by the fitted serial correlation structure, generated serial correlation structure, fixed effect term, and misspecification of the random effect structure.
The middle panel in Figure 4 shows the model results for fixed effects associated with the linear slope. As can be seen from the figure, there is an interaction effect where misspecification of the random effect structure significantly decreases the probability of being in Group 1 or 2. This suggests that the probability of having an inflated type I error rate is larger than .75 in many cases. When all the random effect terms are correctly modeled, the probability of having an inflated type I error rate decreases significantly as shown in the bottom plot of the middle panel.
Finally, the rightmost panel in Figure 4 shows the effect for terms associated with other Level 1 slopes not including the intercept or linear slope for time. Compared with the intercept, the probability of being in both Groups 1 and 2 is slightly smaller, suggesting that the probability of being in Group 3 is higher than the intercept and the linear slope when the random effect structure is correctly modeled.
Throughout all the conditions, the AR(1) fitted serial correlation structure did increase the probability of being in Group 1 or 2, especially for the linear slope and other within slopes (middle and right panels of Figure 4). The independent generated serial correlation structures also provided the highest probability of being in Group 1 or 2, a situation that is not surprising, given that these are cases where serial correlation is not present in the data, and the random effects should adequately represent the dependency due to repeated measures. Finally, Figure 4 also depicts across all conditions that the probability of being in Group 1 (type I error rate smaller than the nominal rate) is not common. Liberal tests are a much larger concern than conservative significant tests, particularly when serial correlation is present in the underlying data.
Random Effects
The unweighted empirical type I error rate for the random effects can be seen in Table 4. Of the 13 articles coded, only seven reported empirical type I error rates for the random effects, resulting in a total of 621 effect sizes. On average, the unweighted empirical type I error rate was at 0.066 with evidence of positive skew and large variation as shown by the minimum and maximum values.
Article Summary Information of Unweighted Empirical Type I Error Rates for the Random Effects and Other Monte Carlo Conditions.

Note. K = number of effect sizes; Repl = replication; T1 = type I error rate; Med = median; Min = minimum; Max = maximum; RE = random effects; CS = cluster size; wCS = within-cluster size; Jour = journal article; Diss = dissertation.
Considering the number of replications and variance, the weighted average empirical type I error rate was 0.066 with a 95% CI = [0.048, 0.087]. The omnibus Q test was also significant
Inferential models
With the significant Q test, a meta-regression was performed to attempt to explain the significant variation in the empirical random effect type I error rates. Significant predictors at the .01 level are shown in Table 5. The conditional model explained significant variation as shown by the significant chi-square moderator test,
Random Effect Meta-Regression Results for Significant Predictors in the Transformed

Note. Reference groups were dissertations, two fixed and random effects, within-cluster residuals. CI = confidence interval; FE = fixed effect.
POM
Results for the POM can be seen in Figure 5 for significant covariates. This plot shows the effect of the number of fixed effects and the random effect term on the probability of the empirical type I error rate to be conservative, accurate, or liberal. In this figure, the solid lines represent the probability of a conservative test, the dashed lines represent the probability of an accurate or conservative test, and one minus the probability of the dashed lines represent liberal tests. Increasing the number of fixed effects significantly increases the probability of being in Group 1 or 2 compared with Group 3, suggesting that these tests are more likely to be accurate or conservative rather than liberal, with the probability being very close to 1. However, with only a couple fixed effect terms in the model, the probability of a liberal test is much larger, as likely as .7 for the significant test associated with the variance of the intercept.

Interaction plot showing results of the partial proportional odds model by the random effect term and number of fixed effects.
The within-cluster residuals (labeled as Res) and the variance of the intercept tend to be accurate tests (most likely to be in Group 2), particularly when more fixed effects are included in the model. In contrast, there is a rather large probability (about .90) of the empirical type I error rate to be conservative for the variance of the slope when more than six fixed effects are included in the model as shown in Figure 5.
Discussion
The purpose of this meta-analysis was to help improve the external validity of MC LMM studies, better understand gaps in simulation conditions, and inform applied researchers of assumption violations that can affect the study results. A meta-analysis of the empirical type I error rates from MC studies was performed and the manipulated and nonmanipulated study conditions were combined to empirically understand which are most important.
There are a handful of takeaway messages from this meta-analysis. First, not modeling a random effect when that term is underlying the data leads to inflated type I error rates. For example, in the study by LeBeau (2012), the data were generated with a random effect for time, but this random effect was omitted during model fitting. This leads to inflated type I error rates for the fixed effect parameters associated with that random effect. This inflation of the type I error rate could lead researchers to reject true null hypotheses more often than one would expect given their specified
Fitting a serial correlation structure has the effect of helping to correct the inflation in type I error rates when a random effect is missing. However, fitting the serial correlation structure does not fully recover the type I error rate to nominal levels. In addition, by looking at the parameter estimates and Figure 3, the AR(1) and ARMA(1, 1) structures seem to do a better job of reducing the type I error rate than the MA(1) or MA(2) serial correlation structures (−.013 and −.012 vs. −.0006 and −.010, respectively). This may be due to AR(1) and ARMA(1, 1) structures better representing longitudinal data structures (i.e., correlation decreasing between measurement occasions as the time lag increases), whereas the MA structures may better align with other nested data structures.
No relationship was found between the random effect distribution and the type I error rate for the fixed effects, which has been found previously in the literature (LeBeau, 2013; Maas & Hox, 2004, 2005). Similarly, the generated serial correlation structure does not have an impact on the type I error rates of the fixed effects. This suggests that the random effects do an adequate job of accounting for the dependency due to repeated measurements, regardless of the type of serial correlation structure underlying the data.
Finally, the small effects related to the sample sizes is an interesting finding. With maximum likelihood being an asymptotic estimation method, the larger sample sizes may have provided better estimates. The small effect helps to inform researchers with relatively small sample sizes that the type I error rate can be held in check with few observations and relatively few clusters (12 clusters was the smallest condition in the current meta-analysis). However, sample size may play an important role in the estimates of the variances of the random components and would be worthy of further study.
Informing Applied Researchers
There are three recommendations for applied researchers with respect to empirical type I error rates for the LMM. First, results suggest that conservative tests are less common with the LMM for the fixed effect terms (see Figure 4). Instead, significant tests are much more likely to be liberal. One aspect to be particularly careful with is when the random effect for time is not included in the final model. This could be a case where the random effect structure is misspecified, and severe inflation of the empirical type I error rate may be present for fixed effects associated with the linear slope. In these situations, exploring variation in the trajectories of individuals would be helpful to see whether there is variation in the data not being captured by the LMM. If there is evidence of misspecification of the random effect structure and the inclusion of the random effect for the linear slope leads to nonconvergence, using robust standard errors may be a way to alleviate elevated empirical type I error rates.
A second recommendation is to check for the presence of serial correlation in the data, especially when the repeated measurements are measured close in time. Adding serial correlation to the LMM can help to statistically adjust for a potential source of random effect misspecification and help alleviate severe empirical type I error rate inflation. Finally, this meta-analysis also found that simpler serial correlation structures (AR(1)) perform just as well as more complicated structures (ARMA(1, 1)) as shown in Figure 3 and Figure 4.
Finally, statistical tests for the random effects also show evidence of being too liberal on average (see Table 5), particularly with few fixed effects included in the model (see Figure 5). This can be problematic if applied researchers are counting on these tests for inclusion of random effects in the LMM. However, as shown by the fixed effect results, it is extremely problematic to underspecify the random effect structure; therefore, including more random effects than needed is likely less problematic as long as the model still converges. Research into this would be worthy of further study.
Informing Future MC Studies
This meta-analysis can help inform additional areas of study. None of the MC studies allowed for variables to vary besides the initial status and linear trend. The implications for the empirical type I error rates when the trajectory of additional variables is allowed to vary between clusters would be interesting to explore, especially in relation to cases when the random structure is misspecified.
Second, the number of fixed effects in the MC studies coded were homogeneous and were not significant in the final inferential model. As can be seen in Table 1, most studies had between four and six fixed effects and only a single study included more with 10 fixed effects. Many applied studies using the LMM tend to have more than four to six fixed effects, for example, Harwell, Post, Medhanie, Dupuis, and LeBeau (2013) has 33 covariates included in a three-level longitudinal LMM. Better understanding the implications when there are many fixed effects related to assumption violations and small sample size conditions would be a welcome addition to the MC literature. Relatedly, little attention in the MC LMM literature has been given to three-level models and would be worthy of more attention.
Footnotes
Declaration of Conflicting Interests
The author(s) declared no potential conflicts of interest with respect to the research, authorship, and/or publication of this article.
Funding
The author(s) received no financial support for the research, authorship, and/or publication of this article.