
Abstract
The 2016 election provided more language and polling data than any previous election. In addition, the election spurred a new level of social media coverage. The current study analyzed the language of Donald Trump and Hillary Clinton from the debates as well as the tweets of millions of people during the fall presidential campaign. In addition, aggregated polling data allowed for a comparison of daily election-relevant language from Twitter and fluctuations in voter preference. Overall, Trump’s debate language was low in analytic/formal thinking and high in negative emotional tone and authenticity. Clinton was high in analytic and positive emotions, low in authenticity. The analysis of almost 10 million tweets revealed that Trump-relevant tweets were generally more positive than Clinton-related tweets. Most important were lag analyses that predicted polling numbers a week later from tweets. In general, when Clinton-related tweets were more analytic, her subsequent poll numbers dropped. Similarly, positive emotion language in the Clinton-related tweets predicted lower poll numbers a week later. Conversely, Trump-related tweets that were high in positive emotion and in analytic thinking predicted higher subsequent polling. In other words, when Twitter language about the candidates was used in ways inconsistent with the candidates themselves, their poll numbers went up. We propose two possible explanations for these findings: the projection hypothesis, a desire to seek qualities the candidates are missing, and the participant hypothesis, a shift in who is participating in the Twitter conversation over the course of the campaigns.
Keywords
The 2016 presidential election offered two very different candidates in Hillary Clinton and Donald Trump. Where Clinton was the picture of the traditional politician, Trump was decidedly not. Despite the skepticism of pundits and experts, Trump won both the Republican primary and the general election. Although the candidates themselves were starkly different, the election process itself was unique in its heavy reliance on social media. For the first time, voters were able to track the almost-daily barrage of messages sent out by the candidates and their surrogates.
Although the first tweet was sent out in 2006, Twitter did not have a major impact on the tenor of a presidential election until 2016. Donald Trump personally tweeted almost daily providing followers and the media with his thoughts, jokes, and attacks. Clinton, on the contrary, used Twitter more sparingly although her surrogates tweeted frequently on a wide range of issues surrounding the campaign. Because so many tweets were disseminated by the campaigns, their impact on the election has become a hotly debated topic.
Although the candidates’ tweets provided one source of information about the candidates themselves, there was a much larger volume of tweets sent out by millions of Twitter users which revealed their own opinions about the election. The purpose of this article is to explore how campaign-related tweets influenced the perceptions of the candidates. More specifically, we sought to determine whether and how Twitter activity influenced voters’ election decisions as well as how voters’ attitudes may have affected campaign-related tweets.
The words people choose to use can provide insights into their psychological states. Automated natural language analysis has become a widely used and well-validated methodology for psychological research in recent decades (see Boyd & Pennebaker, 2015). One major benefit of psychological language analysis methods is they are generally free of the biases inherent with self-report measures (i.e., response biases, social desirability) and allow access to populations not available for traditional studies like politicians. Numerous studies have shown how language can be used to measure processes like thinking style, depression-proneness, and deception (Edwards & Holtzman, 2017; Newman, Pennebaker, Berry, & Richards, 2003; Robinson, Navea, & Ickes, 2013).
Language analysis can be particularly useful in the arena of politics. From debates to speeches to press conferences, politicians provide a wealth of information about themselves through the words they use. For example, first person singular pronouns (or I-words such as I, me, my) have been found to be related to self-focus. In speeches, politicians who use higher rates of I-words are perceived to be more grandiose, informal, and dynamic (e.g., Ahmadian, Azarshahi, & Paulhus, 2017). Use of we-words in political discourse, on the contrary, have the paradoxical effect of making candidates appear more detached and less trustworthy (e.g., Pennebaker & Lay, 2002; Slatcher, Chung, Pennebaker, & Stone, 2007). These and numerous other studies (Conway et al., 2012; Crew & Lewis, 2011; Laver, Benoit, & Garry, 2003; Winter, 2011) show that language analysis can be a useful tool in quantifying important psychological characteristics of political figures without relying on self-reports or expert ratings. For the current study, we focus on three dimensions measured with language: analytic thinking, emotional tone, and authenticity.
People naturally differ in the ways they think. Some people are very logical and formal in their communication while others are more narrative and intuitive. Through analysis of the words people use, we have found that analytic thinkers tend to use more articles and prepositions while more narrative thinkers tend to use more pronouns, adverbs, and auxiliary verbs (Pennebaker, Chung, Frazee, Lavergne, & Beaver, 2014). Analytic thinking has been found to be related to nonpolitical outcomes like academic performance and cognitive ability (Pennebaker & King, 1999; Robinson et al., 2013) as well as political outcomes like electoral success (Conway et al., 2012; Thoemmes & Conway, 2007).
We also consider emotional tone. The ways people use emotional language has long been thought to be critical in the ways voters’ perceive a candidate (Gunsch, Brownlow, Haynes, & Mabe, 2000; Ridout & Searles, 2011). Specifically, the use of positive versus negative emotion (i.e., emotional tone) can be useful in understanding whether someone is upbeat and optimistic or pessimistic and gloomy. Emotion can be a useful measure in understanding psychological processes from mental health and depression (Coppersmith, Dredze, & Harman, 2014; Edwards & Holtzman, 2017) to people’s attitudes toward political candidates (González-Bailón, Banchs, & Kaltenbrunner, 2012; Groshek & Al-Rawi, 2013).
A third useful construct to consider is authenticity, or the extent to which a person is honest and non-evasive, which is not always a trait associated with the stereotypical politician. Newman et al. (2003) demonstrated that when people are lying versus telling the truth, they tend to use less complex language, fewer references to self (such as I-words), and, in some cases, more negative emotion words. Other studies have found the same markers of deception in dyadic interactions in a lab setting (Hancock, Curry, Goorha, & Woodworth, 2007), prison populations (Bond & Lee, 2005), and fact-checking presidential candidates (Bond et al., 2017). The degree to which candidates are deceptive, evasive, or distant versus authentic and open has potentially important implications for how people perceive them and discuss them online.
Developments in the collection of social media data and analysis of natural language provide a new tool by which to analyze social media used in posts/tweets and metadata like retweets, likes, and location. Past work using social media data has helped to identify mental health problems, understand the impact of traumatic events, and measure individual differences just to name a few (for review, see Murphy, 2017).
One area in which social media research has become increasingly important is in the political sphere. Through the use of social media by politicians as well as online and traditional news sources, social media sites like Facebook and Twitter have become a central component of political discourse. Several studies have sought to use social media to predict elections with mixed results (Gayo-Avello, Metaxas, & Mustafaraj, 2011; McKelvey, DiGrazia, & Rojas, 2014; Tumasjan, Sprenger, Sandner, & Welpe, 2010). Others have looked at the link between social media and changes in polling (González-Bailón et al., 2012; O’Connor, Balasubramanyan, Routledge, & Smith, 2010). However, previous studies have tended to rely on sentiment analysis or simple features like mentions. Here we seek to expand on existing work by considering more diverse linguistic dimensions to track support and perceptions of the 2016 candidates. It would follow that closer analysis of tweets by and about the two leading candidates in the 2016 election could serve as a way to track the voter preferences over time.
The purpose of the current study was to explore the language styles between Donald Trump and Hillary Clinton and people tweeting about them during the 2016 election campaign in the weeks leading to election day. More specifically, we sought to establish possible links between Twitter language and the results of polling. The following questions were addressed:
How did the candidates and the people tweeting about them differ in terms of the language they used?
How did the conversation about Trump and Clinton change during the election?
How did the conversation on Twitter relate to people’s attitudes toward the candidates (i.e., how well they were polling)?
Method
Using the Twitter Streaming API (Twitter Developer, 2017), tweets referencing the two major candidates were collected from September 24, 2016, to December 5, 2016, using the following keywords: Trump, Clinton, Hillary. These keywords were chosen based on the most common references of the candidates before the collection period started. Only tweets in English were collected and retweets were removed. In addition, tweets under 10 words were discarded as short tweets are difficult to quantify with the methodology we used. The final dataset therefore consisted of 13,240,823 tweets with a mean word count of 20.55 (SD = 4.39). For the purpose of the current study, we focused on tweets mentioning one of the major candidates (but not both) tweeted before the election on November 8. Of the final set of tweets, 6,417,599 mentioned Trump and 3,172,995 mentioned Clinton.
To measure how people’s attitudes were changing during the election, we used polling data modeled by FiveThirtyEight (Silver, 2016). While polls are typically conducted over a period of a few days, FiveThirtyEight’s approach models how polls overall were changing over time, thereby diminishing the error that would come with using single polls. Given the period of time over which polls were collected and incorporated into the model, we used a 7-day lag for the polling averages to allow the poll numbers to catch up to current events. By using FiveThirtyEight’s election forecast model, we are able to capture on people’s day to day attitudes toward the candidates.
Individual tweets were analyzed using LIWC2015 (Pennebaker, Booth, Boyd, & Francis, 2015), a tool for measuring psychological processes from language. While LIWC2015 includes more than 80 categories, we pay particular attention to those dimensions which reflect how people may be thinking or feeling. Here we focus on the three psychological dimensions discussed in the introduction which are measured by LIWC: analytic thinking, emotional tone, and authenticity.
Analytic thinking is a standardized, composite measure of articles and prepositions minus pronouns, auxiliary verbs, adverbs, conjunctions, and negations (from Pennebaker et al., 2014). Analytic scores range from 0 to 100 with low scores indicating more narrative, intuitive, and informal ways of thinking and high scores indicating more analytic, logical, formal ways of thinking. Emotional tone was measured as the difference between positive and negative emotion words which were adjusted along a 100-point scale so that scores above 50 reflect a greater usage of positive emotion word usage and scores below 50 reflect a greater use of negative emotion words. Positive emotional tone is indicated by words such as happy, optimistic, and respect, whereas negative tone includes words such as angry, kill, and sad. Finally, authenticity is a composite measure based on a series of experiments that identified word patterns associated with honesty versus deception (Newman et al., 2003). Overall honesty or authenticity is measured with greater use of I-words (e.g., I, me, mine), insight words (e.g., think, know), differentiation words (e.g., except, but, without), relativity words (e.g., now, near), and lower use of discrepancies (e.g., should, could) and she-he words (e.g., he, hers). Authenticity scores range from 0 to 100 where 100 reflects most authentic and open language.
Finally, we collected comparison data of the public language of Trump and Clinton outside their tweets. The comparison language data set was based on the language of the two candidates in the Fall 2016 presidential debates to better reflect the candidates themselves. While using the Twitter accounts of the candidates would be a more straightforward comparison, there are a number of issues with that approach. First, the candidates’ tweets generally did not represent the candidates themselves but rather their social media teams. Second, candidates’ tweets were not frequent enough nor long enough for an accurate measure of their linguistic styles. Therefore, the candidates’ debate performances were used in order to best measure their natural style as debates represents a relatively off-the-cuff context. Transcripts for the three general election debates were obtained from the Washington Post. Across the three debates, Clinton spoke an average of 6,490 words while Trump spoke an average of 7,508.
Results
To ensure robust estimates, 112 random samples were taken from the full ~10 million tweet data set. Given the size of the data set, the following sampling procedure was used. Each tweet was given a unique id number. For each random sample, a random number was generated, and tweets with id numbers divisible by the random number were added to the sample. A second random number was used to skip over tweets to ensure duplicate samples were not created. This procedure did create samples of unequal sizes, but this did not pose an issue for the chosen analyses. Each sample contained between 35,617 and 598,524 tweets (M = 375,301, SD = 108,654). For each sample, summary statistics were computed for each of the linguistic variables by day and topic of the tweet (Clinton or Trump). In addition, a correlation was computed between each of the linguistic variables and the time-lagged polling averages for Clinton or Trump. Separate correlations were estimated for tweets about Trump and tweets about Clinton. For each construct, we discuss how the candidates differed in the debates, how everyday twitter users talked about the candidates during the election, and how the language of twitter users related to how the candidates were polling.
Analytic Thinking
One of the clearest differences between Hillary Clinton and Donald Trump during the campaign was how analytic the two were. Clinton’s speaking style was often formal, logical, and, in her words, “wonkish.” In her debates, interviews, and even tweets, she was generally high in analytic thinking using facts and figures to make logical arguments. Trump, on the contrary, was a consistently intuitive thinker; he used stories and anecdotes and engaged in a more stream of consciousness manner of speaking. Across the debates, the average analytic scores for Clinton were much higher than Trump’s (M = 42.79, SD = 5.18 vs. M = 23.77, SD = 1.96; Jordan, 2016).
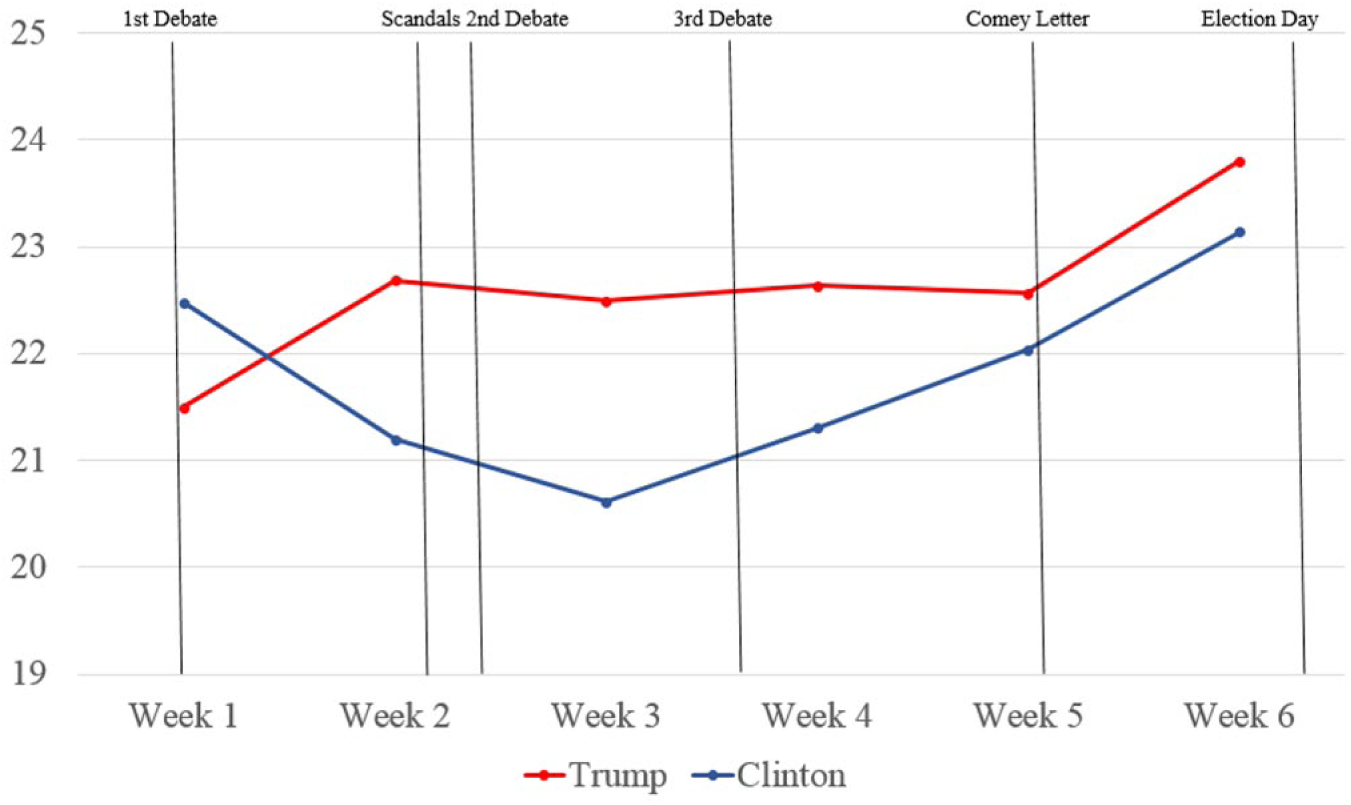
The difference in analytic thinking, though smaller, was also found on Twitter in how people talked about the candidates. People tweeting about Clinton throughout the general election were more analytic than those tweeting about Trump. Tweets about Trump were consistent in their analytic language throughout the election. Likewise, after a slight drop between the first and second debates, tweets about Clinton were consistently slightly more analytic than tweets about Trump (see Figure 1). Interestingly, the time period where there was the least difference between tweets about Clinton and Trump, from the leaks of the Access Hollywood Tape (where video was released from 2005 showing Trump making degrading statements about women) and Wikileaks documents (in which the private emails of Clinton’s campaign chairman were published) and the final debate, coincided with Clinton being most highly favored to win (FiveThirtyEight, 2016).

Analytic thinking of the tweets about the candidates over time.
To what degree do tweets predict subsequent polling results and, by the same token, do polling results affect later tweeting? To answer these questions, 1-week lags were computed between the tweets and polls that were available on a daily basis. Recall that the national surveys on which the FiveThirtyEight polling data were based were generally collected over 2 to 3 days. The aggregated polling results from several organizations were released daily. The tweet-polling lag results were computed each day correlating the tweet language analyses from Day X with the polling results from Day X + 7. The polling-tweet analyses were based on simple correlations between the polling results of Day X with the tweet analyses of Day X + 7. A seven day lag was chosen as polling data is collected across multiple days and takes time to impact the model. Multiple lag lengths (4-7 days) were tested all yielding similar results; a longer lag helps to ensure that changes in polls were truly reflective of recent events. The simple correlations, then, were simply aggregated over the fall election time period.
The tweet-polling lag analyses assumed that the ways that people in the Twitter world were tweeting about the candidates were both reflecting and influencing people in ways that would later be reflected in the polls a few days later. Separate analyses were computed for tweets mentioning Clinton and mentioning Trump. For the Clinton-related tweets, higher analytic language at any given time was negatively correlated with her poll numbers a week later, mean r = −.57 (95% confidence interval [CI] [–.59, –.55]). An opposite pattern emerged for tweets mentioning Trump, mean r = .21 (95% CI [.18, .27]).
Consider the meaning of these patterns. When people tweet in analytical ways about Clinton (either positively or negatively), her poll numbers were lower a week later. And, conversely, the more the tweets were more informal, narrative, or in the here-and-now, her subsequent poll numbers would be higher. The irony is that when people were more analytical in their tweets concerning Trump, his subsequent numbers would increase. Note that the magnitude of these lagged correlations are impressive.
The polling-tweet lag analyses assumed that poll results could, in some way, affect the ways that people subsequently tweeted. Such a pattern could emerge by a poll influencing the ways the candidates changed their messages which could, in turn, affect the ways people subsequently tweeted. Not surprisingly, the polling-tweet lag correlations were substantially lower than the tweet-polling patterns. For Clinton, changes in her poll numbers did not substantially change how analytic the conversation about her was (r = .01, 95% CI [–.02, .04]). When Trump was doing better in the polls, later tweets about him tended to be somewhat less analytic (r = −.07, 95% CI [–.10, –.04]).
Emotional Tone
In the debates, Clinton’s language was far more optimistic (M = 58.29, SD = 3.09) than Trump’s (M = 34.07, SD = 6.60). Clinton sought to convince voters that the country had fared well under Democratic leadership while Trump tried to cast the nation as a disaster zone that could only be fixed by his leadership (Jordan, 2016).
Despite the language of the candidates themselves, the emotional tone of the tweets about the candidates was decidedly different. As depicted in Figure 2, tweets about Trump were consistently more positive than about Clinton and the difference in emotional tone tended to become larger over the course of the election season. Interestingly, the tweets about Clinton became more negative in the days following the Access Hollywood/Wikileaks scandals and become slightly more positive following the last debate and in the days leading up to Election Day.

Emotional tone of the tweets about the candidates over time.
The lag analyses yielded particularly interesting effects. The tweet-polling lag analyses for the tweets mentioning Clinton found that the more positive the tweets, the lower her poll numbers a week later (r = −.36, 95% CI [–.39, –.34]). Conversely, when tweets about her were more negative, the subsequent poll numbers improve. A typical Clinton-related tweet that preceded improvements in her poll numbers was: I’m a Clinton supporter. The tax thing is a losing story. No one cares. The Dems team is screwing up bad.
Tweets about Trump followed the opposite pattern. When the tweets about him were positive, he polled better in the week afterward (r = .63, 95% CI [.62, .65]). From an intuitive perspective, the tweets that preceded higher poll numbers reflected an optimistic tone from the Trump base. A typical tweet in the week before Trump’s numbers increased: I’m so excited for our country right now I’m voting Trump.
The polling-tweet lag analyses were weaker than the tweet-polling correlations. For Clinton-related tweets, higher poll numbers were associated with more positive tweets in the following week (r = .31, 95% CI [.28, .34]). The opposite pattern emerged for Trump-related tweets, such that higher poll numbers resulted in somewhat more negatively valenced tweets (r = −.27, 95% CI [–.30, –.24]).
Authenticity
During the debates, Trump was often described by supporters as “telling it like it is” and being a straight talker, whereas Clinton was often described as evasive and deceptive. Indeed, analysis of their language during the debates bears out this difference (Jordan, 2016). In terms of the LIWC analyses of language in the debates, Trump had a more authentic language style (M = 34.01, SD = 8.17) than Clinton (M = 22.13, SD = 1.24).
As the campaign progressed, the authenticity difference was also seen in how people were talking about the candidates on Twitter. Particularly in the middle weeks following the Access Hollywood tape scandal and the Wikileaks scandal people tweeting about Trump were more authentic than those tweeting about Clinton (see Figure 3).
Authenticity of the tweets about the candidates over time.
Unlike analytical thinking and emotional tone, the lag analyses for authenticity were relatively weak. For the tweet-polling lag correlations for Clinton-related tweets, higher authenticity tweeting was associated with subsequent lower polling the following week (r = −.29, 95% CI [–.32, –.27]). A much weaker, yet significant, pattern emerged for tweets about Trump such that the more authentic the tweets, the higher is subsequent polling (r = .03, 95% CI [.002, .07]).
The polling-tweet lag patterns were modest and in the opposite directions of the tweet-polling findings. When Clinton was doing better in the polls, tweets about her generally become more authentic (r = .31, 95% CI [.28, .34]). Trump’s doing better in the polls predicted tweets about him being less authentic (r = −.09, 95% CI [–.12, –.06]).
Discussion
The current project points to some important and unexpected patterns between the candidates’ language in the campaign and the ways Twitter users talked about them. Equally striking were the findings linking the Twitter data with polling results conducted around the same times. The 2016 presidential election pitted two very different candidates against each other. In their debates (and speeches and interviews not reported here), Trump was more pessimistic, narrative, and authentic in his language style, whereas Clinton’s language was more optimistic, analytic, and distant. In some cases, the differences between Clinton and Trump debate language were reflected in how normal Twitter users tweeted about the candidates. When tweeting about Trump, people tended to be more narrative and authentic. When tweeting about Clinton, people tended to be more analytic and distant. The one striking difference was emotional tone. Whereas Clinton’s debate language was far more optimistic and positive than Trump’s, Clinton-related tweets were consistently more negative than Trump-related tweets.
Particularly interesting were the results of the lag analyses between daily tweets and polling results. By tracking the analytical thinking and emotional tone of the tweets about the respective candidates, it was possible to predict shifts in polling a week later. For Trump-related tweets, the more analytic and optimistic, the more his polling numbers increased. For Clinton, however, the opposite pattern emerged: More analytic and optimistic tweeting was correlated with drops in polling a week later.
Consider the possible meaning of these results. Across the board, Trump was viewed as far less analytic and logical in his thinking and much more negative. However, when tweets about him became more analytic and more positive, his numbers improved. Clinton, who was far more optimistic and analytical and formal in her speaking style, showed drops in her polling numbers when tweets about her were also analytical and positive. In the cases of both Trump and Clinton, when the Twitter populace revealed styles opposite to the candidates, polling numbers increased. In other words, Trump-related tweets becoming more formal presaged higher ratings. When Clinton-related tweets became less logical and more negative, her numbers went up.
The language patterns suggest what we call the projection hypothesis. People want to see their candidate as possessing traits that their candidate does not have. As the Twitter conversation portrayed Trump as a more logical, upbeat person, people may have shifted their perceptions of his potentially negative attributes and viewed him more favorably as a candidate. Likewise, as the Twitter conservation around Clinton shifted toward a more narrative, human, emotionally authentic view, people may have viewed her as a more viable, desirable candidate. The authors readily admit that the data for the project hypothesis is far from convincing. It is based on correlational analyses and does not take into account the precise nature of the tweets or even how is doing the tweeting (e.g., pro- vs. anti- Trump or Clinton). Furthermore, the polling data actually fluctuated very little on a day-to-day basis. It should also be emphasized that the polling results should not be confused with the actual election patterns.
Another possible explanation of these findings could be described as
A secondary finding was that, in general, the tweet-polling lag patterns were much stronger than the polling-tweet lags, especially for the analytic and emotional tone results. That is, the ways people are tweeting at time one does a much better job at predicting polling results a week later than vice versa. Logically, of course, this makes sense. However, it is important to appreciate that people who tweeted about the candidates represented only a small and nonrepresentative percentage of actual voters. Similarly, it is likely that only a small percentage of people who were part of the polling samples were active tweeters. In short, the tweet-polling lag results reflect two partially overlapping samples that reflect more broadly the views of the candidates.
There were three significant instances of strong correlations for the polling-tweet lags worth discussing. Namely, when Clinton was doing better in the polls, later tweets about her tended to be more positive and authentic, and when Trump was doing better in the polls, later tweets about him tended to be more negative. Two factors likely helped to drive these patterns. First, the polls themselves are election relevant events which are frequently covered by media outlets, hence in addition to events like debates and scandals, reporting of poll results can drive the conversation about the election and the candidates. In our dataset, this may create some feedback loops in the lag analyses. Second, the polling-tweet lag trends may be explained partially by selection bias. As previously noted, Twitter users are not necessarily representative of the American voter population. Twitter users reactions to poll fluctuations were likely based on their own candidate preferences, and while we were not able to measure which candidate users supported, the polling-tweet lag results could indicate a greater prevalence of Clinton supporters as our sample seemed to react more positively to Clinton gains and more negatively to Trump gains. Future research could help to isolate the effects of these factors and better understand how political preferences might be realized through a person’s social media posts.
Perhaps the most promising aspect of the current study is the possibility that Twitter and other social media data can be mined to get a much better sense of attitude change and voting proclivities. We still are not able to determine the degree to which Twitter actually influences voting and attitude change versus just reflects people’s worldviews. There is the impression that Twitter played an important role beyond what the candidates and other political operatives were tweeting. The tweets of everyday users about the candidates played a role in understanding the changing shifting electoral fortunes of the candidates. While the current study is only an exploratory look into one unique election, there are useful implications for going beyond sentiment analysis to understanding what people are thinking and feeling about political candidates in real time.
Footnotes
Declaration of Conflicting Interests
The author(s) declared no potential conflicts of interest with respect to the research, authorship, and/or publication of this article.
Funding
The author(s) disclosed receipt of the following financial support for the research, authorship, and/or publication of this article: Preparation of this article was aided by grants from the John Templeton Foundation (#48503), and the National Science Foundation (IIS-1344257).