
Abstract
Passive alerts highlighting abnormal results in the electronic health record (EHR) are abundant. However, their impact on EHR use and contribution to alert fatigue remains unknown. We examined the impact of passive laboratory alerts on EHR usability and recognition of patient safety issues during a simulated intensive care unit (ICU) rounding exercise. We performed a post hoc comparison of simulated ICU rounding exercises, comparing performance with and without passive laboratory alerts. Participants (physician trainees and advanced practice providers) reviewed EHRs depicting critically ill patients, which included multiple embedded patient safety issues. We employed eye tracking during chart review to determine the impact of alerts on EHR navigation. 92 simulations were reviewed, 46 with passive alerts activated. Passive alerts were associated with reduced gaze fixations on both normal and abnormal laboratory results. Activation of alerts was also associated with increased time to first fixation on abnormal results and increased saccadic eye movements. Alerts had no impact on either the duration spent reviewing laboratory results or identification of patient safety issues. Activating passive alerts in the EHR was associated with increase scanning behavior, which may explain why reductions in gaze fixations on lab results did not translate into improved efficiency or performance. This may be due to alert fatigue in the form of oversearching.
Keywords
Introduction
The electronic health record (EHR) is an essential tool in the modern practice of health care given its proven benefits and incentivized use (Blumenthal & Tavenner, 2010; Chaudhry et al., 2006). Unfortunately, the abundance of data embedded within the EHR may increase the cognitive burden on users, promoting errors and burnout (Bloomrosen et al., 2011; Patel, Kushniruk, Yang, & Yale, 2000). Alerts offer a technological solution to this problem by utilizing EHR data to alert clinicians to potential dangers and best practices. They may be used to visually highlight important data or abnormal results (passive alerts), or interrupt workflow with a popup warning or recommendation (active alerts). They are implemented with the goal of minimizing user errors, but there has been increasing emphasis on understanding their unintended consequences (Kane-Gill et al., 2017). These consequences may contribute to the category of adverse events associated with EHR use described as “e-iatrogenesis” (Weiner, Kfuri, Chan, & Fowles, 2007).
Adverse effects associated with alerts are described as alert fatigue. Mechanisms hypothesized to explain this phenomenon include desensitization and cognitive overload. Desensitization refers to diminishing responsiveness in association with frequency or duration of exposure to alerts, particularly false positives. Cognitive overload refers to diminishing efficacy in association with workload or stress. Both are established consequence of audiovisual alerts. For example, increasing burden of alarms in the intensive care unit (ICU) has been associated with decreased responsiveness by health care workers (Keller, 2012; Sendelbach & Funk, 2013). Responses to audiovisual alerts also decrease in the presence of a high degree of workload or stress (Rayo & Moffatt-Bruce, 2015). Given the similarity in function, it should come as no surprise that alert fatigue is observed in relation to EHR alerts.
Active EHR alerts have been associated with alert fatigue and may contribute to e-iatrogenesis. This type of alerts interrupts EHR workflow with a popup screen until acknowledged by the user with a keystroke or mouse click. Active alerts are frequently implemented at the point of computerized provider order entry (CPOE) as a decision support tool to help avoid adverse drug reactions and increase best practices. Qualitative surveys have indicated that providers describe alert fatigue after simulated CPOE exercises (van der Sijs, van Gelder, Vulto, Berg, & Aarts, 2010). Desensitization and cognitive overload related to active alerts have both been observed to affect clinician behavior (Ancker et al., 2017; Embi & Leonard, 2012). Ultimately, clinicians disregard from 70% to more than 90% of active alerts, the majority of which are false positives (Nanji et al., 2017; Wong et al., 2017; Straichman et al., 2017). The frequency of exposure to false positive CPOE alerts has been associated with inappropriate alert overrides (Miller, Boro, Korman, & Davoren, 2011), a behavior which has been associated with adverse events (Wong et al., 2017). Despite over a decade of literature describing active EHR alerts and their optimization, reducing alert fatigue remains a concern and a target for quality improvement efforts (Kane-Gill et al., 2017; Payne et al., 2015).
In contrast, the role of passive alerts in causing alert fatigue is not established. Passive alerts visually emphasize important or abnormal data without interrupting EHR workflow. Examples include highlighting or bolding text, or adding adjacent asterisks or exclamation points. Passive alerts are applied in multiple domains within the EHR including vital signs, laboratory data, and medication administration records. The risk for alert fatigue from this type of alert is likely to be magnified in the ICU given the voluminous data generated on patients who are critically ill—on average, more than 1,300 data points in a 24-hr period (Manor-Shulman, Beyene, Frndova, & Parshuram, 2008). Thus, a typical ICU provider caring for a census of 14 patients could be exposed to approximately 2,300 new passive alerts each day, most of which correspond to lab results (Kizzier-Carnahan, Artis, Mohan, & Gold, 2016). The majority of these are false positives given their clinical irrelevance, increasing the likelihood of causing desensitization (Kilickaya et al., 2014). Whether passive alerts contribute to cognitive overload or alter user behavior and cause e-iatrogenesis is not known.
Given the visual nature of passive alerts, eye tracking is a natural tool for studying their effects on user performance. Eye tracking utilizes infrared sensors to capture data related to eye movements, such as the timing and duration of gaze fixations on areas of interest (AOI) and visual search patterns. These metrics have been increasingly applied in human computer interface and health care information technology (HIT) research (Asan & Yang, 2015; Poole & Ball, 2006). Some eye-tracking observations have been associated with expertise or performance. For example, experienced radiologists identify abnormalities faster using fewer gaze fixations (van der Gijp et al., 2017). Similarly, experienced cardiologists require fewer gaze fixations to make a diagnosis from electrocardiograms (Wood, Batt, Appelboam, Harris, & Wilson, 2014). In contrast, inexperience has been associated with more gaze fixations, orderly search patterns, and visual neglect of important information, all of which have been observed to correlate with cognitive workload during EHR review (Moacdieh & Sarter, 2015). We have shown that gaze fixation data can predict a user’s ability to recognize patient safety issues during simulated ICU rounds (Gold, Stephenson, Gorsuch, Parthasarathy, & Mohan, 2016). These associations provide the basis for using quantitative eye-tracking metrics as surrogates for performance during EHR review tasks.
The goal of this study was to utilize eye tracking during EHR review to identify unintended consequences of passive laboratory alerts during a simulated ICU rounding exercise. We tested the hypothesis that passive laboratory alerts improve performance and facilitate the recognition of safety issues by performing a post hoc analysis of the simulations, comparing cohorts with and without passive alerts. Primary outcomes included the recognition of embedded patient safety issues and eye-tracking surrogates for usability and performance. Our results illustrate both intended and unintended consequences of passive EHR alerts, shedding light on their potential contribution to e-iatrogenesis.
Methods
The study was approved by the Oregon Health and Science University Institutional Review Board (IRB). All participants were provided with an IRB-approved information sheet about the protocol. All data were de-identified and stored securely.
Simulation Environment
The testing environment consisted of a high fidelity simulation that depicted ICU rounds. Two simulated patient cases (Case A and Case B) were created within our enterprise-wide EHR (EPIC Care; Epic Systems, Madison, Wisconsin, USA) as previously described (Stephenson, Gorsuch, Hersh, Mohan, & Gold, 2014). The cases contained robust clinical data including laboratory results, thus depicting a typical multiday ICU admission. Case A contained 14 and Case B contained 15 embedded patient safety issues including abnormal data trends and management errors. When study participants logged into the EHR, they encountered an exact replica of their current practice environment, including user-optimized customizations such as EHR screen view settings.
Participants
Participants included interns, residents, critical care fellows, and advanced practice providers. All users had prior training and experience working with our EHR. At the start of the simulation, participants were provided a 1-page written summary of the history and physical exam. They subsequently spent 10 minutes analyzing data in the EHR before presenting the patient during simulated ICU rounds. A member of the study team scored participants on whether they identified the embedded patient safety issues during rounds. The full details of the validation of the scenarios and the performance of the individuals in the simulation have been previously published (Stephenson et al., 2014). A minority participated twice, going through the simulation exercise for both Case A and Case B, and are subsequently referred to as repeat participants. Repeat participation is associated with improved performance on these simulations and was treated as a potential confounding variable in our analysis.
Passive Laboratory Alerts
Our EHR utilizes red exclamation points as passive alerts to highlight all abnormal laboratory results, which was the exposure of interest in our study. A systematic error associated with data entry was present in an initial cohort of simulations such that the passive laboratory alerts were omitted from the EHR. This error was addressed such that a subsequent cohort of simulations included passive alerts, thus mimicking clinical practice. The improved method of data entry also introduced new rows of automatically calculated parameters to the laboratory results screen corresponding to estimated glomerular filtration rate and albumin corrected anion gap. As a result, the total number of data rows increased by 8% for Case A and 10% for Case B, which we later discuss as a confounder in comparisons of the two cohorts of simulations. Each cohort included simulations with both Case A and Case B, as well as participants from different levels of training, which were also treated as potential confounding variables. The simulated EHR and methods were otherwise identical for the two cohorts.
Eye Tracking
Simulations were performed in the ICU using a mobile computer workstation with eye- and screen-tracking capabilities. A commercially available eye tracker (Tobii X1 Light Eye Tracker [30 MHz]; Tobii Systems, Danderyd Municipality, Sweden) was mounted below the computer screen. Users sat in a fixed back chair situated approximately 65 cm away from the monitor to optimize performance. At this distance, the eye tracker can capture viewing angles up to 30° with a 0.3° accuracy. The eye tracker was calibrated before each simulation using the manufacturer’s 9-point calibration algorithm. Real-time spatiotemporal gaze data and screen recordings were captured during the rounding exercise. Analysis was performed using the accompanying software (Tobii Studio; Tobii Systems). Gaze fixations were arbitrarily defined as a point of focus lasting at least 35 ms. Ocular saccades were defined by a velocity of eye movement greater than 30°/s. If participants looked away from the screen, the eye tracker was capable of recapturing their gaze once they looked back. When gaze data were absent for more than 6 seconds in the presence of other recorded computer use (e.g., mouse movement, mouse clicks, or keystrokes), the recording was deemed corrupt and excluded from analysis.
Areas of Interest
Analyzing the effect of passive alerts on eye-tracking metrics requires the creation of AOIs on the screen recordings. AOIs allow for calculation of total number of gaze fixations, dwell time (sum duration of all gaze fixations), duration of the first gaze fixation, and time to first fixation. We were interested in these metrics for individual laboratory results encountered in daily ICU practice including basic chemistries, renal function, liver enzymes, blood counts including bands, pH, point of care glucose, and lactate. As our EHR tabulates results for each laboratory in rows, we sought to create AOIs corresponding to each row of data. This task was difficult due to the density of data, difference in users’ laboratory results screen customization, and the ability of users to manipulate the screen by scrolling. We go on to describe the standard methodologies we applied in attempt to minimize these potential confounders.
The Tobii eye tracker requires AOIs be defined with a minimum dimension corresponding to a viewing angle of at least 1°, approximately 40 pixels for the screen resolution used in these simulations. The height of each row in the lab results spreadsheet in our EHR ranges from 15 to 20 pixels tall, depending on the participant’s customizations. To address this limitation, a buffer of 15 pixels was added above and below the row boundaries. Furthermore, adjacent labs were combined if related (blood urea nitrogen [BUN] and creatinine, hemoglobin and hematocrit, etc.). This resulted in each AOI measuring 45 to 70 pixels in height. These adjustments were applied identically for all recordings, irrespective of the presence or absence of passive alerts.
AOIs also had to be toggled and moved to accommodate changes associated with scrolling and transitions to and from the lab review screen. AOIs were inactivated whenever the corresponding labs were not visible on screen. Time to first fixation was defined as the sum total of time that an AOI was visible on the screen until fixated on. In addition, the vertical location and width of AOIs was adjusted continuously, on a frame-by-frame basis, to accommodate changes associated with scrolling. These dynamic adjustments are unlikely to result in errors in calculating gaze fixation metrics, as the transitions were extremely brief.
Data Analysis
We performed a post hoc analysis, comparing the cohorts with and without passive laboratory alerts to determine the influence of this exposure on EHR usability, and efficiency and performance on the simulations. Usability was assessed using established eye-tracking metrics including the number of gaze fixations, total gaze duration (dwell time), and time to first fixation. Between-cohort comparisons of gaze metrics were performed for each unique laboratory AOI, rather than by combining all AOIs, to minimize confounders associated with variations in their size and duration of visibility. Search patterns were assessed by measuring number and duration of saccadic eye movements. Efficiency was measured using the time spent reviewing laboratory results and the number of visits to the results screen. Performance was measured by recognition of the embedded patient safety issues. The results of performance on these simulations were reported in a prior analysis of these simulations (March et al., 2013; Stephenson et al., 2014). Outcomes were compared between the two cohorts using standard statistical methods including simple t test, Mann–Whitney test, chi-square test, and Fischer’s exact test as indicated. Results are reported as mean ± standard error of the mean unless otherwise specified. All analyses were performed using GraphPad Prism (GraphPad, La Jolla, CA), and a p value < .05 was considered statistically significant.
Results
A total of 92 simulations were reviewed, including 46 with alerts deactivated and 46 with alerts activated. Baseline characteristics of the two cohorts, with emphasis on potential confounding variables, are summarized in Table 1. The two groups were similar with regard to training level. Neither cohort included significant numbers of repeat participants. There was a significant difference in the distribution of Case A and Case B before and after activating passive alerts (p = .01). Eye-tracking data were available for 30 simulations with alerts deactivated and 35 with alerts activated; 27 simulations were excluded from analysis of gaze and saccade outcomes due to corrupt eye-tracking recordings.
Baseline Characteristics of Participants in the ICU Chart Review Simulations Based on Whether Passive Alerts Were Activated.

Note. The only significant difference between groups was the distribution of the two simulated cases. ICU = intensive care unit; APP = advanced practice provider (nurse practitioner or physician assistant).
Gaze Fixations
We first examined the effect of activating passive alerts on visualization of abnormal lab results. When alerts were active, the average number of gaze fixations on AOIs corresponding to abnormal labs decreased from 13.2 ± 0.8 to 9.2 ± 0.7 (p < .0001). This finding was consistent across multiple lab domains (Figure 1). We also observed significant reductions in the duration of gaze fixations after activating alerts, including the first gaze fixation (214 ± 13 to 144 ± 7 ms, p < .0001) and the total gaze dwell time (3.33 ± 0.24 to 1.83 ± 0.16 s, p < .0001). The dwell time for each AOI is illustrated in Figure 2, revealing that the effect of activating passive alerts was reproducible across multiple abnormal labs.

Number of gaze fixations on each lab domain/AOI before (30 simulations) and after passive alert activation (35 simulations).
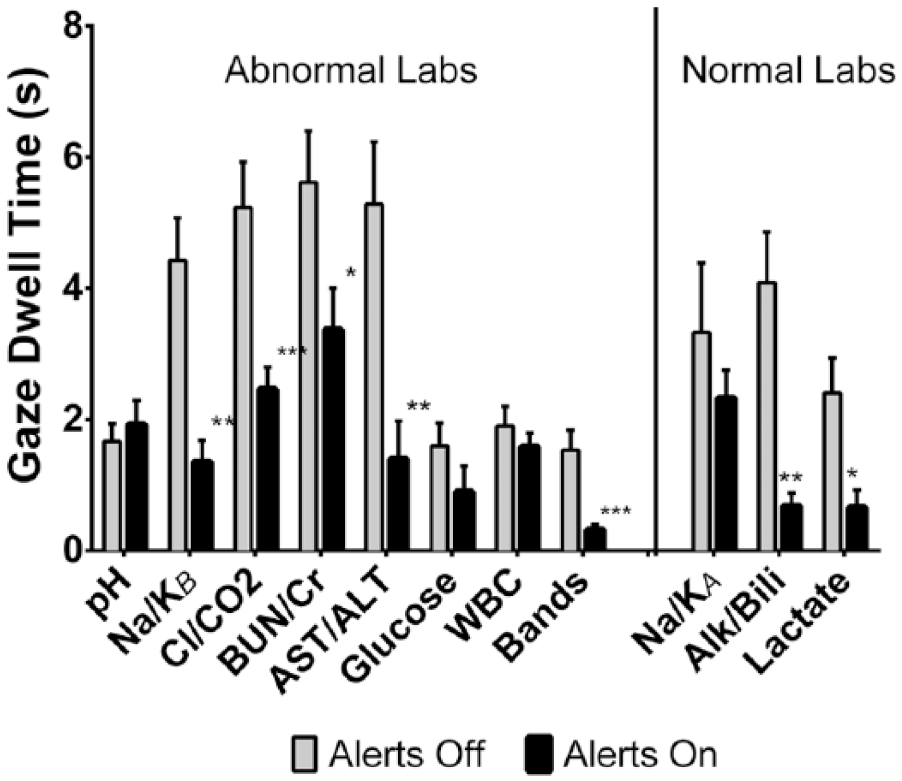
Total gaze dwell time on each lab domain/AOI before (30 simulations) and after passive alert activation (35 simulations).
A similar analysis was performed for normal lab results, which were not associated with passive alerts in either cohort, to see whether the reductions in gaze metrics were a universal phenomenon associated with activating passive alerts. For normal results, the mean number of gaze fixations was reduced from 13.9 ± 1.9 to 7.9 ± 1.0 (p = .03) and mean total dwell time was reduced from 3.27 ± 0.46 to 1.59 ± 0.27 s (p = .001). The decreases in the number of gaze fixations and total dwell time were significant for the AOIs representing serum alkaline phosphatase/total bilirubin and serum venous lactic acid (Figures 1 and 2, respectively).
We next examined the effect of passive alerts on the time to first fixation on each area of interest. On average, users looked at labs at the top of the screen first and subsequently reviewed data lower down. This pattern appeared to be independent of the presence of passive alerts. Activating alerts significantly prolonged the time to first fixation for multiple AOIs corresponding to abnormal results including serum sodium/potassium, chloride/bicarbonate, and BUN/creatinine (Figure 3). The lone outlier was the AOI for serum glucose, which was fixated on significantly earlier with alerts active. The results for BUN/creatinine and serum glucose are most likely to be affected by the addition of calculated rows of data, which were added in cases with passive alerts as described in the methods. Albumin corrected anion gap was added above BUN/creatinine and estimated glomerular filtration rate was also added above glucose.
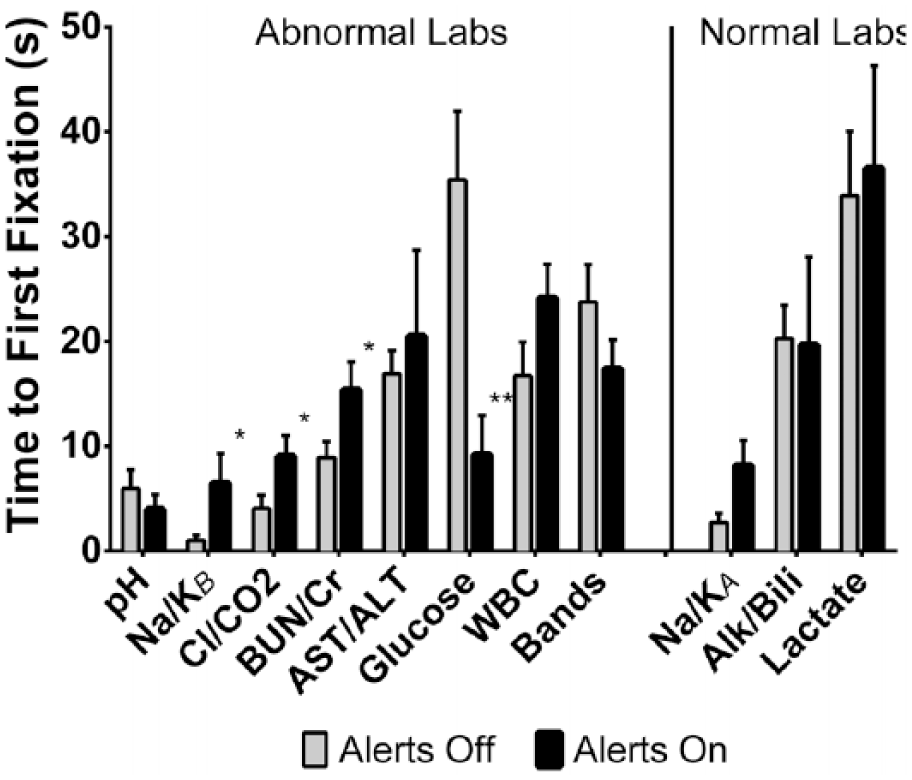
Time to first fixation on each lab domain/AOI before (30 simulations) and after passive alert activation (35 simulations).
Data Review Time and Search Patterns
As a metric of data search efficiency, we analyzed the screen recordings to determine the time spent reviewing lab results for each participant (Figure 4). Screen recordings were available for 44 simulations with alerts deactivated and 42 with alerts activated. On average, users spent 133 ± 11 s reviewing labs with alerts off versus 123 ± 9 s with alerts active (p = .72). However, visits to the lab results screen were significantly reduced after alerts were activated (3.0 ± 0.2 vs. 1.9 ± 0.2 visits per simulation, p < .0001).

Total duration of lab results visualization and number of visits to the lab results screen before (44 simulations) and after activating passive alerts (42 simulations).
As activation of alerts led to a decrease in the total dwell time associated with gaze fixations but no significant change in the total lab review time, we sought to determine what users were doing with the remainder of the time. We first calculated the time without any eye-tracking data during the lab results review, which represents off screen gaze or failure of the eye tracker to register pupils. This was not significantly different between the initial cohort and following alert activation (52.9 ± 7.8 vs. 54.6 ± 6.6 s, p = .73). Next, we computed the proportion of time that the eye tracker detected saccadic eye movements during lab review (Figure 5). The average number of saccades increased by 25% after alerts were activated, from 245 ± 27 to 306 ± 23 (p = .027). We also observed a trend toward an increase in the total duration of saccadic movements from 14.9 ± 1.9 to 17.4 ± 1.6 s (p = .08). The remainder of the changes in data review after activation of passive must correspond to gaze fixations on parts of the screen outside the AOIs, or gaze patterns that did not meet criteria for fixations (point of focus less than 35 ms) or saccades (velocity of eye movement less than 30°/s).

The number of saccades and duration of saccadic eye movements before and after activating passive alerts.
Identification of Safety Issues
Finally, we evaluated the effect of passive alerts on performance, defined by the verbalization of prespecified patient safety issues embedded within each case during simulated rounds. Performance data were available for 40 cases with alerts deactivated and 35 cases with alerts activated (Figure 6); repeat participants were excluded from this analysis as this would independently impact performance based on prior analysis of these simulations (Stephenson et al., 2014). Users identified fewer errors after alert activation, but this was not statistically significant (39.1 ± 2.5% vs. 34.8 ± 3.0%, p = .32). When restricting analysis to the patient safety issues directly related to laboratory results, we observed a similar outcome, with users recognizing an average of 44.4 ± 4.1% of errors with alerts off vs. 40.5 ± 3.9% with alerts activated (p = .25).

Performance on simulated ICU chart review based on recognition of embedded safety issues.
Discussion
We used a simulated rounding exercise with a detailed EHR representing critically ill patients to test the hypothesis that passive laboratory alerts, which highlight abnormal results, improve EHR usability and recognition of safety issues. Our results indicate that activating passive alerts changes the way providers interface with tabulated data in the chart, with reduced gaze fixations on data but more scanning eye movements. Despite this, we observed no net improvement in terms of efficiency or performance. We conclude that alert fatigue in the form of overcomplete searching may counteract the benefits of passive laboratory alerts in the EHR.
Passive alerts are purported to facilitate the analysis of individual data, and our results support this beneficial effect. Activating alerts was associated with significant decreases in gaze fixations and dwell times across multiple lab domains. Surprisingly, this observation was a universal effect, for both abnormal and normal lab results. This suggests that passive alerts made laboratory data more meaningful and less confusing, based on the existing literature associating eye-tracking metrics with computer search tasks (Goldberg & Kotval, 1999; Jacob & Karn, 2003). Reaching diagnostic conclusions with fewer gaze fixations has also been associated with expert performance in both radiology and ECG interpretation (van der Gijp et al., 2017; Wood et al., 2014). Gaze fixations have also been directly associated with cognitive workload during EHR tasks (Moacdieh & Sarter, 2015). Therefore, we surmise that passive alerts make it easier to come to conclusions about laboratory data in general.
Despite reduced gaze fixations and dwell times, we did not observe improvements in performance or efficiency after passive alert activation. There was no statistically significant association between activating passive alerts and recognition of patient safety issues embedded within the simulated cases. Participants spent the same amount of time reviewing data regardless of whether passive alerts were active or not. It appears that they visited the lab results screen one fewer time on average, suggesting that they spent more time reviewing the data during each visit. These observations suggest that passive alerts cause an unproductive behavior change that consumes user attention without improving performance.
We suspect that the null overall effect of activating alerts may be associated with the observed increase in searching behavior. The average number of saccadic eye movements increased by 25% after activation of alerts, which has been identified as an eye-tracking surrogate for increased searching behavior (Byrne, Anderson, Douglass, & Matessa, 1999). A fraction of this increase could be explained by the addition of calculated rows of data (albumin corrected anion gap and estimated glomerular filtration rate). However, addition of these resulted in only a minor increase in data presented to users and cannot entirely explain the observation. The duration of saccadic eye movements increased, but did not reach statistical significance. This argues that saccades were both more frequent and shorter in duration, possibly representing a transition to a more orderly search pattern with short distances between gaze fixations. We hypothesize that the increase in saccades may represent a transition to an overcomplete searching behavior, which may be counterproductive.
Overcomplete searching may also explain the observed increases in time to first fixation on several lab results. On average, users scanned down the page from top to bottom, but when alerts were activated, it took them longer to reach results lower on the screen. This observation is consistent with an increase in orderly scanning of data from top to bottom of the page. Notably, there was one lone outlier, serum glucose, where the time to first fixation decreased after alerts were activated. This may be due to the addition of new calculated rows of data after alert activation. These additional rows of data pushed the serum glucose AOI below the boundary of the results review screen for some users, depending on their EHR customizations. As a result, the glucose AOI became active only after users where ready to scroll beyond the initial screen, such that the time to first fixation “timer” started at nearly the same time the user was ready to fixate on the result. Overall, the time to first fixation observations are supportive of an orderly scanning pattern in association with passive alert activation.
Overcomplete searching has been identified as an adverse consequence of the implementation of EHRs in general (Ash, Berg, & Coiera, 2004). This phenomenon is akin to that of task saturation, wherein the process of searching consumes users’ attention such that there is less cognitive capacity for other tasks relevant to patient care, such as reviewing other parts of the medical record or synthesizing assessments and plans. Eye-tracking studies comparing novice and expert reviewers of radiographic images or ECGs suggest that a meticulous orderly search pattern is associated with less experience (van der Gijp et al., 2017; Wood et al., 2014). It may also be adopted in the setting of increased cognitive workload, as described in an eye-tracking study of EHR search tasks (Moacdieh & Sarter, 2015). Given these associations with performance and cognitive workload, we conclude that overcomplete searching behavior may be counterproductive and, thus, reflect alert fatigue in our simulations.
An alternative explanation for our observations is that the process of reviewing lab results consumes a fixed duration of attention, such that time saved after activating alerts in terms of gaze fixations could be applied to saccadic data visualization to further inform user decision making. This is in line with the fixed allocation model used to explain the effects of passive alerts in the form of computer aided detection (CAD) for mammograms (Drew, Cunningham, & Wolfe, 2012). Regardless of whether CAD alerts are active, radiologists are observed to spend a fixed amount of time reviewing images. The regions identified by CAD are challenging to interpret, which may explain why users spend more time fixating on these regions and are left with less time to scan the remainder of the image. In our simulations, the alerted data are definitively abnormal such that users spent less time fixating on alerted data. In a fixed allocation model, this leaves more time to scan lab results and apply saccadic decision making.
Increasing the amount of saccadic decision making may be a productive consequence of passive alerts, even though it was not detected in our performance analysis. Saccadic decision making has been identified as an alternative data processing strategy in reading tasks (Carpenter & McDonald, 2007). Our group has hypothesized that a similar behavior may also play a role in EHR review. In a separate analysis of our simulations, we have shown that saccadic eye movements predict error recognition better than gaze fixations (Gold et al., 2016). We have also shown that reviewing data trends, a process requiring saccadic eye movements, is associated with performance in our simulations (Gold et al., 2016). Although we did not detect any improvement in performance in this study, our analysis may have been insensitive to detect subtle benefits associated with increased saccadic decision making.
Our observations have significant implications to further research and implementation of passive alerts in the EHR. We have shown that in the ICU setting, passive laboratory alerts may influence behavior and cause overcomplete searching, which has been associated with poor performance and increased workload in other settings. Given the burden of these alerts, particularly within the ICU, there may be a role for improving the signal to noise ratio by applying context-specific alerts (Kilickaya et al., 2014). This could include applying customized reference ranges for passive alerts based on patient location, severity of illness, user profession, user preference, and so on. Algorithms could also be designed to adjust reference ranges automatically using discrete EHR data, improving alert specificity similar to strategies reported for active CPOE alerts (Seidling et al., 2014).
Unfortunately, strategies to increase the specificity of passive alerts may not translate to improved data search behaviors, user experience, or patient safety. It is also unknown whether concurrent reductions in sensitivity associated with context-specific passive alerts might lead to cognitive blind spots and unanticipated errors. Therefore, we advocate for prospective evaluation of future optimizations of passive EHR alerts, echoing calls for studying clinical decision support systems (CDSS) before implementation (Kane-Gill et al., 2017). Such studies can be performed safely, efficiently, and under realistic conditions using high fidelity EHR simulation. Future research should assess both patient safety and user-centered outcomes. Eye-tracking metrics as described in our research would be complemented by the addition of validated surveys of usability and cognitive workload.
Limitations
The strength of our conclusions would have been improved if we had included additional metrics of performance. In a prospective study, cognitive workload could have been measured using validated surveys such as the NASA-Task Load Index (TLX). Pupillometry can also be used as a surrogate for workload, but despite capturing pupil diameter data, we did not prospectively control for the effects of ambient light, thereby rendering these data impossible to interpret. In addition, analysis of global search patterns for each screen recording using gaze plots could have provided qualitative data regarding search patterns. Finally, an ideal simulation would have included review of multiple patient charts in succession, reflecting real-world practice, which may influence the effects of passive alerts.
Our conclusions are limited by the post hoc nature of our comparison between the cohort with and without passive alerts activated. As mentioned previously, a known confounder is the addition of new rows of calculated data to the results screen after alert activation. Another potential confounder is that the distribution of simulations using Case A and Case B was not uniform in the two cohorts. However, as Case A and B contained similar numbers of lab abnormalities (88% vs. 83% of lab AOIs contained abnormal results, respectively) and embedded errors (14 vs. 15, respectively), this is not likely to have a significant effect. We detected no other significant differences between participants in the two cohorts, but cannot exclude unmeasured confounders.
There are a few additional limitations to our study. First, we cannot exclude that artifacts due to the size limitations and dynamic nature of AOIs described in the “Methods” section may affected gaze fixation parameters. These limitations are less likely to be significant because we made comparisons for each individual laboratory AOI. Such artifacts would not affect our measures of saccadic eye movements, efficiency, or performance. Second, we only analyzed results for the most commonly reviewed results screen in a single EHR platform. Different EHRs, and even alternative screens within our EHR, utilize passive alerts differently and at different thresholds. Also, our clinical practice is in an academic teaching institution with the vast majority of participants being trainees, and we realize that our conclusions may not apply to an exclusive population of experienced users. In addition, the AOIs used for gaze analysis corresponded to routine labs, and the effect of passive alerts on infrequently ordered tests were not assessed.
Conclusion
In this simulated ICU rounding exercise, we used eye tracking to show that activating passive laboratory alerts in the EHR was associated with significant changes in data review behavior. On one hand, gaze fixation data suggest that users recognized and processed individual results easier. On the other hand, an increase in saccadic eye movements indicated that users scanned the laboratory screen more thoroughly. Given that there was no improvement in efficiency or performance, we conclude that overall the change in search behavior may not be productive. We hypothesize that passive alerts cause alert fatigue by promoting oversearching, a counterproductive behavior which may reduce user efficiency and increase workload.
Footnotes
Author Contributions
J.A.G. and V.M. were primarily responsible for design of the study and oversight of data collection analysis and manuscript preparation. B.J.A. was primarily responsible for data analysis and manuscript preparation. K.M. and G.S. were responsible for data collection and experimental design.
Declaration of Conflicting Interests
The author(s) declared no potential conflicts of interest with respect to the research, authorship, and/or publication of this article.
Funding
The author(s) disclosed receipt of the following financial support for the research, authorship, and/or publication of this article: This work was funded by the Donaghue Foundation and Agency for Healthcare Research and Quality (AHRQ)—R01HS023793, R18HS021637.