
Abstract
Outdoor walking has positive impacts on older adults’ health. It is crucial to identify less active older adults and to encourage them to take outdoor walks. Previous studies have shown that physical activity levels vary according to socioeconomic deprivation. However, knowledge on objectively measured older adults’ outdoor walking levels is limited. This study investigated associations between area (socioeconomic) deprivation and older adults’ objectively (geographic positioning system [GPS]) measured outdoor walking levels (i.e., walking durations and frequencies) in Birmingham, United Kingdom. It used a multilevel approach. The final sample included 173 participants (65 years and above). A questionnaire was used to collect data on personal characteristics (e.g., educational attainment as a proxy of individual deprivation, age, and marital status). The results show that independent of personal characteristics, area deprivation associates with outdoor walking durations. Participants from high-deprivation areas spend less time for outdoor walking than those from low-deprivation areas. Associations between area deprivation and outdoor walking frequencies were nonsignificant. Future research needs to investigate how attributes (e.g., environmental attributes) of low- and high-deprivation areas drive disparities in outdoor walking durations among older residents of low- and high-deprivation areas.
Physical activity has positive impacts on health (Department of Health, 2011). It is especially important for older adults, who are at risks of chronic disease (Department of Health, 2011) and isolation (Age, 2010). For older adults, walking is an excellent type of physical activity (Centers for Disease Control and Prevention, 1999; Cunningham & Michael, 2004). As Broderick, McCullagh, White, Savage, and Timmons (2015) have reported, walking and being able to spend time outdoors is very important for older adults. Outdoor walking (total walking for transport, recreation, and exercise in outdoor space) reduces risks of chronic disease (e.g., diabetes II and stroke) and improves social interactions (Lee & Buchner, 2008; Sugiyama & Thompson, 2007). Thus, development of interventions aiming at encouraging older adults to take outdoor walks has been recommended (Department of Health, 2011). Addressing outdoor walking is especially important for urban planning discipline, because outdoor walking takes place in outdoor spaces such as urban streets and urban open spaces. One of the aims of a healthy urban planning is encouraging outdoor walking among all people (Barton & Tsourou, 2000; World Health Organization [WHO], 2011). Great health benefits could be obtained by encouraging older adults who are less active—and, therefore, are more at risks of health problems—than others (Hillsdon, Lawlor, Ebrahim, & Morris, 2008). Reducing inactivity and eliminating disparities in physical activity are important public policy priorities (Healthy People, 2006; Public Health England, 2014; Ruseski, 2014). Therefore, it is necessary to examine disparities in older adults’ outdoor walking levels and to identify less active groups of older adults.
Evidence indicates a socioeconomic deprivation gradient in older adults’ health (Grundy & Sloggett, 2003; Lima-Costa, De, Oliveira, Macinko, & Marmot, 2012) and health behavior (e.g., healthy eating; Bianchetti, Rozzini, Carabellese, Zanetti, & Trabucchi, 1990; Conklin et al., 2014; Conklin, Forouhi, Surtees, Wareham, & Monsivais, 2015). Socioeconomic deprivation is defined as relative disadvantage in terms of social and material resources (Crampton, Salmond, Woodward, & Reid, 2000). It has been shown that high socioeconomic deprivation increases risks of chronic disease associated with low level of outdoor walking (e.g., cognitive function, Lang et al., 2008; diabetes II, Espelt et al., 2011; and stroke, Cox, McKevitt, Rudd, & Wolfe, 2006). These findings raise a hypothesis that older adults’ outdoor walking levels vary according to socioeconomic deprivation. The issue of socioeconomic deprivation has been addressed in previous studies on physical activity levels (Gidlow, Johnston, Crone, Ellis, & James, 2006). However, knowledge on associations between socioeconomic deprivation and older adults’ outdoor walking levels (especially objectively measured outdoor walking levels) is limited. Thus, this study addresses this hypothesis by focusing on associations between area (socioeconomic) deprivation and older adults’ objectively measured outdoor walking levels.
Area Deprivation
Evidence indicates that two levels of socioeconomic deprivation may associate with physical activity levels (Gidlow et al., 2006; McNeill, Kreuter, & Subramanian, 2006): (a) individual deprivation, that refers to an individual’s disadvantage in terms of material welfare and the ability to participate in social life (Communities and Local Government, 2010)—common proxies of individual deprivation are educational attainment, income, and occupational status (McNeill et al., 2006); and (b) area deprivation, that refers to relative disadvantage of urban areas in which people live. Area deprivation is usually measured as “a composite of factors relating to the economic, health, education, safety, housing, environmental, and social capital aspects of life for residents of particular areas” (Communities and Local Government, 2010, p. 12). Although area deprivation largely includes individual residents’ characteristics, such as individual deprivation, it can also involve measurements related to environmental conditions (Communities and Local Government, 2010), such as quality of housing (McLennan et al., 2011).
Most previous studies on physical activity have focused on associations between individual deprivation and levels of physical activity (Beenackers et al., 2012; Ford et al., 1991; Gidlow et al., 2006). They have found the most stable associations between physical activity levels and educational attainment (Gidlow et al., 2006). Although previous research has reported inconsistent results on total physical activity levels (Beenackers et al., 2012), they have shown lower prevalence of leisure-time physical activity among people with high individual deprivation than among those with low individual deprivation (Beenackers et al., 2012; Gidlow et al., 2006). These findings indicate that physical activity promotion interventions targeting highly deprived individuals are needed.
Recently, multilevel research on physical activity have involved both, individual and area, levels of deprivation (Hillsdon et al., 2008; Shishehbor, Gordon-Larsen, Kiefe, & Litaker, 2008; Turrell et al., 2010). These studies have shown that independent of individual deprivation, area deprivation associates with physical activity levels. Findings of previous research indicate that residents of high-deprivation areas are more likely to have lower physical activity levels than residents of low-deprivation areas (Gidlow et al., 2006; Kavanagh et al., 2005; Turrell et al., 2010; Wen, Browning, & Cagney, 2007). It is crucial to address the associations between area deprivation and physical activity levels, because an area may contain a large number of people. It is known that interventions targeting individuals are costly and difficult to implement and, thus, area-level interventions that encourage a larger number of people to do physical activity could be targeted (Gidlow et al., 2006). Most of past multilevel research, however, has addressed adults’ population (Kavanagh et al., 2005; Wen et al., 2007) or older adults’ total physical activity (Hillsdon et al., 2008). Multilevel studies examining associations between area deprivation and older adults’ outdoor walking levels are scarce.
Objectively Measured Outdoor Walking Levels
Some previous studies on older adults’ walking levels have addressed area deprivation (Fisher, Li, Michael, & Cleveland, 2004; Fox et al., 2011). However, these studies have typically relied on self-reported measurement of older adults’ outdoor walking levels (Fisher et al., 2004; Zandieh, Martinez, Flacke, & van Maarseveen, 2015), which is virtually not an accurate measurement of physical activity levels and is subject to recall bias (Gidlow et al., 2006; Harris et al., 2009; Sims, Smith, Duffy, & Hilton, 1999). Fox et al. (2011) have used accelerometers to measure walking levels objectively. However, they have not focused on objectively measured outdoor walking levels, probably because accelerometers cannot capture the locations in which walking takes place—indoor or outdoor spaces (Cho, Rodriguez, & Evenson, 2011). For measuring outdoor walking levels objectively, using geographic positioning system (GPS) technology has been suggested (Duncan & Mummery, 2007; Gernigon et al., 2015; Le Faucheur et al., 2007; Le Faucheur et al., 2008; Taylor, Fitzsimons, & Mutrie, 2010). The GPS technology provides accurate data on the location, time, and speed of walking (Gong, Chen, Bialostozky, & Lawson, 2012), and reduces the problems associated with the self-report survey methods (Forrest & Pearson, 2005; Murakami, Taylor, Wolf, Slavin, & Winick, 2004). Although this technology has been used in previous studies on active transport (Dessing, de Vries, Graham, & Pierik, 2014) and environmental health (Harrison, Burgoine, Corder, van Sluijs, & Jones, 2014), it has been rarely used in research on older adults’ walking. Therefore, this study uses the GPS technology, applies a multilevel approach, and aims to investigate the associations between area deprivation and older adults’ objectively measured outdoor walking levels. Similar to previous research on physical activity (Fox et al., 2011; Kavanagh et al., 2005), in addition to area and individual deprivations, this study includes older adults’ sociodemographic status (e.g., age, marital status, and ethnicity) and health status because these personal characteristics may influence people’s physical activity levels (Chad et al., 2005; Fishman, Böcker, & Helbich, 2015; Slater, Full, Fitzgibbon, & Uskali, 2015). To operationalize the notion of outdoor walking levels, this study uses two indicators that have been used in previous research on walking (Cerin, Leslie, & Owen, 2009; Davis et al., 2011; Kavanagh et al., 2005; Turrell et al., 2010) and have been addressed in physical activity guidelines (WHO, 2010): (a) duration, which refers to the length of time in which outdoor walking is performed; and (b) frequency, which refers to the number of times that outdoor walking is performed (WHO, 2010). Accordingly, this study answers two research questions:
Method
We conducted this empirical research in Birmingham, United Kingdom, from July 7, 2012, until October 31, 2012. Birmingham is a large, ethnically diverse city in the West Midlands of England (Birmingham City Council, 2013, 2014). With a population of more than 1,000,000 residents, Birmingham has been known as the most populous British city outside London (City Mayors, 2010).
The ethical approval for this study was received from University of Birmingham’s Humanities and Social Sciences (HASS) Ethical Review Committee.
Distinguishing Low- and High-Deprivation Areas
Similar to other studies (Hillsdon et al., 2008), we identified low- and high-deprivation areas (wards). To do so, we used the index of multiple deprivation (IMD; Zandieh, Martinez, Flacke, Jones, & van Maarseveen, 2016). The IMD is an indicator that provides an accepted measure of area deprivation in the United Kingdom (Communities and Local Government, 2010). It involves seven domains of deprivation, such as education, income, and crime (McLennan et al., 2011), and determines a score of relative deprivation of each lower super output area (LSOA)—defined as a relatively homogeneous geographic area with a population of about 1,500 residents (Communities and Local Government, 2010; Office for National Statistics, 2014).
We identified the 20% least and 20% most deprived LSOAs of Birmingham by using IMD quintiles. Then, we identified a ward as a relatively low-deprivation area, if more than 50% of its area was covered by the 20% least deprived LSOAs. Similarly, a ward was identified as a relatively high-deprivation area, if more than 50% of its area was covered by the 20% most deprived LSOAs. As a result, low-deprivation areas (four wards) were identified in northern part of Birmingham and high-deprivation areas (four wards) were identified in inner part of Birmingham (Figure 1). We used these selected wards for participant recruitment (Zandieh et al., 2016).

Low-deprivation areas in northern part of Birmingham and high-deprivation areas in inner part of Birmingham (Ordnance Survey (OS) open data boundary line Crown© copyright/database right 2012 and OS MasterMap data Crown© copyright/database right 2012).
Participant Recruitment
We applied a convenience sampling strategy for participant recruitment in both low- and high-deprivation areas. Applying this sampling strategy is often the norm in studies on health behavior (Gochman, 1997, cited in Newsom, Kaplan, Huguet, & McFarland, 2004), particularly in research on older adults (Newsom et al., 2004). We recruited participants from social centers (e.g., community centers, worship centers) located in low- and high-deprivation areas (all eight selected wards). By posting advertisements, we informed participants about the research, and by arranging information sessions, we provided information on the process of participation in research. To explain the research to non–English-speaking older adults, we used a translator (Zandieh et al., 2016).
Eligible participants were those older adults (65 years or above) who were (a) residing in a (low- or) high-deprivation area, (b) capable to walk, (c) autonomous in their daily activities, and (d) mentally healthy (Zandieh et al., 2016). English speaking was not an inclusion criterion. We screened participants for their ethnicity. To reach maximum similarity to ethnical heterogeneity in the total population of the selected wards, we applied quota sampling and mirrored proportions of diverse ethnicities found in census 2001—the latest available census (Zandieh et al., 2016). Two hundred sixteen participants received GPS tracking units. We excluded 43 participants who forgot to use the GPS tracking unit when they went out of their homes or refused to use the tracking unit after receiving it. However, we included participants who accepted (and remembered) to use the tracking units (after receiving it), but they did not walk outside their homes. Therefore, the final sample included 93 participants from low-deprivation areas and 80 participants from high-deprivation areas (173 participants in total). All participants signed a consent form before participation in this study.
Measuring Outdoor Walking Durations and Frequencies
We used a GPS tracking unit—the i-gotU GT-600 GPS data logger from Mobile Action Technologies—to measure participants’ outdoor walking durations and frequencies. This tracking unit had been used in other studies (Belkin et al., 2014; Ben-Pazi, Barzilay, & Shoval, 2013; Naito, Uesaka, Yamada, & Ishii, 2014; Seto et al., 2012; Vazquez-Prokopec et al., 2013). It is small, portable, and light; has a motion detector; needs least involvement by participants, and, therefore, is suitable to use with older adults (Vazquez-Prokopec et al., 2009; Zandieh et al., 2016). Furthermore, this tracking unit has good reliability and spatial accuracy in urban areas (Vazquez-Prokopec et al., 2009). We also tested the spatial accuracy of this device in different parts of Birmingham and it was fit for our purpose.
We set the tracking units on motion detector mode and on 2-s recording interval and, then, we gave them to participants from low- and high-deprivation areas. In terms of time, the tracking units were distributed in parallel (simultaneously) in low- and high-deprivation areas during data collection period; therefore, atmospheric conditions were similar for participants from low- and high-deprivation areas. We trained participants how to use the tracking units and we provided written and oral instructions for them. Participants agreed to wear a tracking unit on their wrists when they went out of their homes. Depending on participants’ willingness and availability, participants used the tracking units for a period of 3 to 8 days (average = 4.95 days, SD = 1.61 days; Zandieh et al., 2016).
We collected the tracking units 1 day after the lending period and asked participants some questions about using the tracking unit during the lending period. For example, we asked participants whether they refused to use the tracking unit after receiving it and how many days they forgot to take the tracking unit. Thus, we could exclude participants who changed their minds and refused to use (or forgot to use) the tracking unit after receiving it. By using GPS technology, data on the location (x, y), date, speed, and time of participants’ trips were provided.
We imported GPS data in a Geographic Information System (GIS)—Arc GIS 10.3.1 (Environmental Systems Research Institute [ESRI])—and overlaid the recorded tracks with streets and buildings. We took all trips taken place inside Birmingham into account for further analysis. By using data on date, we identified daily trips for each participant. Then, we applied criteria on identifying walking trips using GPS data (Cho et al., 2011) and identified daily outdoor walking trips (Zandieh et al., 2016). For measurement, we considered all outdoor walking trips, including (a) walking started from home and ended in a destination (or in home in a round trip), for example, walking from home to a shop (or walking around a block); and (b) walking followed a trip by car/public transport and ended in a destination (or in an origin in a round trip), for example, getting of a bus and walking from bus stop to a shop (or getting of a car and walking around a block/park and getting on a car). We calculated average outdoor walking duration (minutes per day) for each participant by using this formula: (Total duration of all daily outdoor walking trips) / (The period: number of days that participant was loaned the tracking unit; Zandieh et al., 2016). To measure outdoor walking frequency, we counted number of all outdoor walking trips for each participant.
Individual-Level Data: Personal Characteristics
To collect data on individual level, we used a self-administered paper questionnaire. For non–English-speaking participants or participants who needed assistance in completing the questionnaire (n = 58), we used a translator/assistant. In this way, we collected data on participants’ educational attainment (sub–General Certificates of Secondary Education [GCSE] or its equivalents) vs. GCSE and higher) as a proxy of individual deprivation. We also collected data on participants’ age (65-74 years old vs. 75 years old and above), gender (man or woman), marital status (single vs. in relationship), and ethnicity (Black and minority ethnic [BME] groups—including Asian, Black, or mixed ethnic heritage—or White British; Roe, Aspinall, & Ward Thompson, 2016). Data on perceived health status over the last 12 months (poor or good) were also collected (Zandieh et al., 2016).
Participants’ income was not involved in this study, because in Britain, people are sensitive to income-related information and these data are rarely collected (Gidlow et al., 2006). Moreover, because the sample includes retired people, occupational status was not used as a proxy of individual deprivation. Missing data were less than 5% on each participant’s characteristic (except 11% missing data on educational attainment).
Data Analysis
To analyze sample characteristics, we used descriptive statistics. We examined spatial distributions of data on outdoor walking durations and frequencies. For this purpose, we applied ArcGIS 10.3.1 and we used the Jenks Natural Breaks classification method to classify data on outdoor walking durations and frequencies into three classes (e.g., high, medium and low). “The Jenks Natural Breaks classification method is a data classification method designed to determine the best arrangement of values into different classes” (Stefanidis & Stathis, 2013, p. 574). It is done by reducing the variance within classes and maximizing the variance between classes (Stefanidis & Stathis, 2013).
We studied associations between area deprivation and outdoor walking durations and frequencies by generating bivariate and multiple models. Outdoor walking durations and frequencies were examined separately. For outdoor walking durations, we generated linear regression models. To improve normality, we used logarithmic-transformed variables (x + 1). For outdoor walking frequencies, because we had count data, we generated negative binomial models, and used the number of walking trips as dependent variable and the logarithmic-transformed number of days (GPS lending period) as an offset variable. We applied multiple models after testing bivariate correlations between all independent variables (area deprivation and personal characteristics): The maximum Pearson correlation, rmax(153) between area deprivation and educational attainment = −.63, p = .000, was acceptable for generating multiple models.
We, first, examined associations between personal characteristics and outdoor walking durations/frequencies for low- and high-deprivation areas, separately. We tested bivariate associations between personal characteristics and outdoor walking durations/frequencies in low- and high-deprivation areas. Then, we generated multiple models: We entered all personal characteristics at once and we dropped the least significant (in terms of t value/Wald chi-square value) predictors to get the model of best fit. Afterward, we did analyses for total sample (low- and high-deprivation areas). We tested bivariate associations between independent variables (area deprivation and personal characteristics) and outdoor walking durations/frequencies. Afterward, we used hierarchical analyses. We generated two multiple models: In Model 1, we entered only two independent variables related to deprivation (i.e., area deprivation and educational attainment); and in Model 2, we entered all independent variables (i.e., area deprivation, educational attainment, age, gender, marital status, ethnicity, and health status) at once, and then we dropped the least significant (in terms of t value/Wald chi-square value) predictors (except area deprivation) to get the final model (the model of best fit). We controlled the final models for interactions between area deprivation and personal characteristics that were associated with outdoor walking levels in low- or in high-deprivation areas.
In all models, we excluded missing data listwise. We conducted all analyses by using IBM SPSS Statistics 22 and we considered a p < .05 significant. The average GPS lending period (number of days) was not significantly different between low- and high-deprivation areas (p = .94).
Results
Sample Characteristics
A summary of the sample characteristics is presented in Table 1. As this table shows, higher percent of participants from BME groups and higher percent of participants with low educational attainment (sub-GCSE) reside in high-deprivation areas. It also shows that more than 90% of participants perceived good health status. This trend was similar in low- and high-deprivation areas.
Participants’ Personal Characteristics.
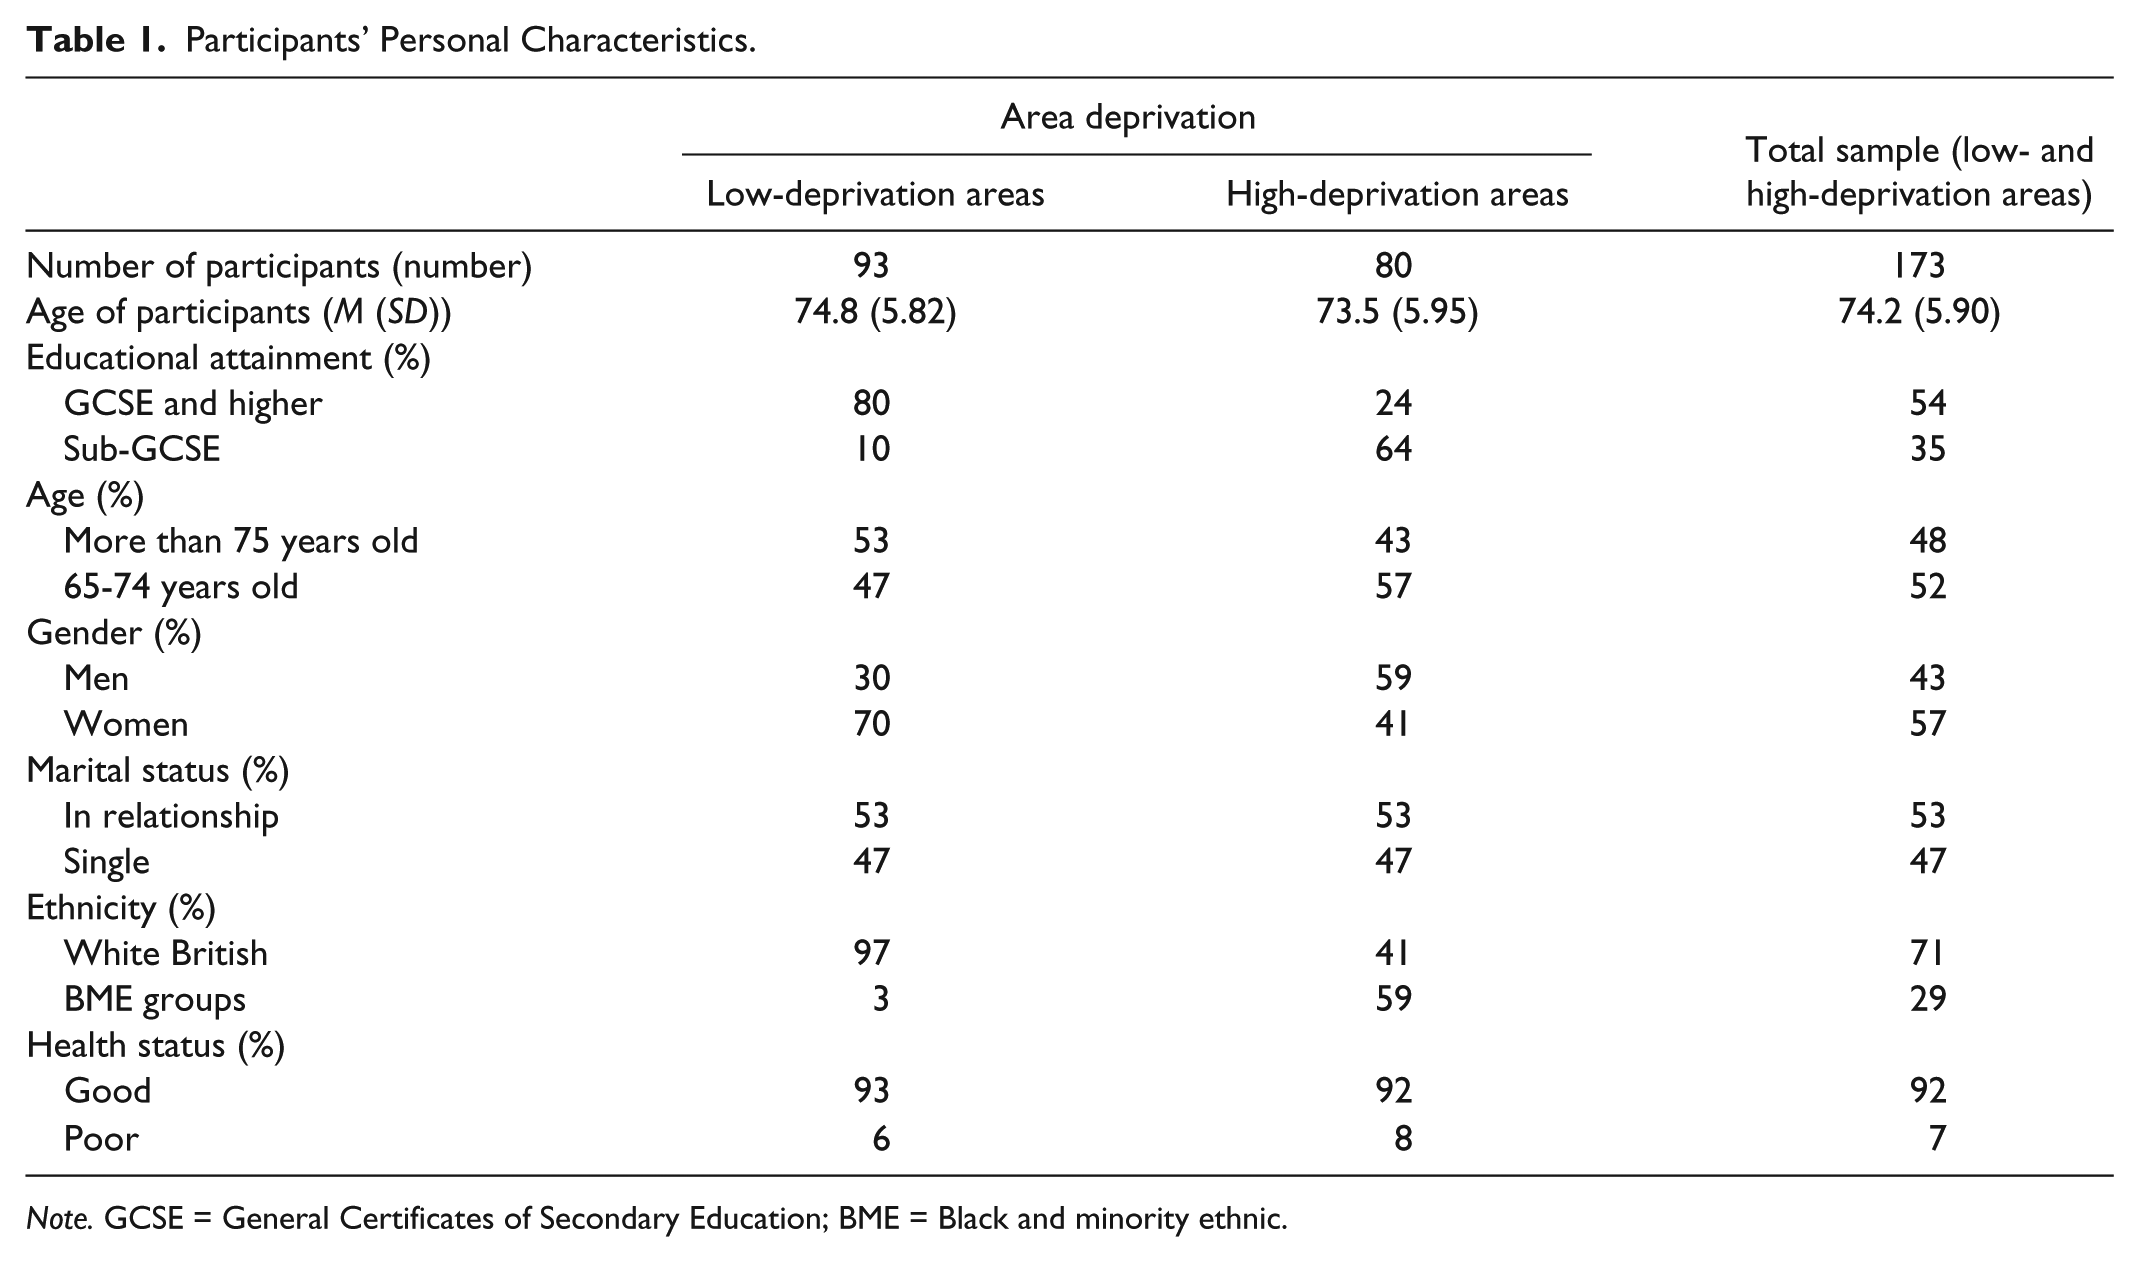
Note. GCSE = General Certificates of Secondary Education; BME = Black and minority ethnic.
Spatial Distribution Pattern of Outdoor Walking
Distribution patterns of participants’ outdoor walking durations and frequencies in low- and high-deprivation areas are presented in Figure 2. As Figure 2A shows, minimum and maximum participants’ outdoor walking durations are 0.00 and 69.40 min per day. Moreover, minimum and maximum participants’ outdoor walking frequencies are 0.00 and 38.00 trips (Figure 2B). On average, participants living in high-deprivation areas spend less time for outdoor walking than their peers living in low-deprivation areas. Moreover, whereas low outdoor walking frequency is more prevalent among participants from high-deprivation areas, medium walking frequency is more prevalent among participants from low-deprivation areas. The percentage of participants with high outdoor walking frequencies, however, is higher in high-deprivation areas than in low-deprivation areas. Detailed results on associations between area deprivation and outdoor walking durations/frequencies are presented later in this article.
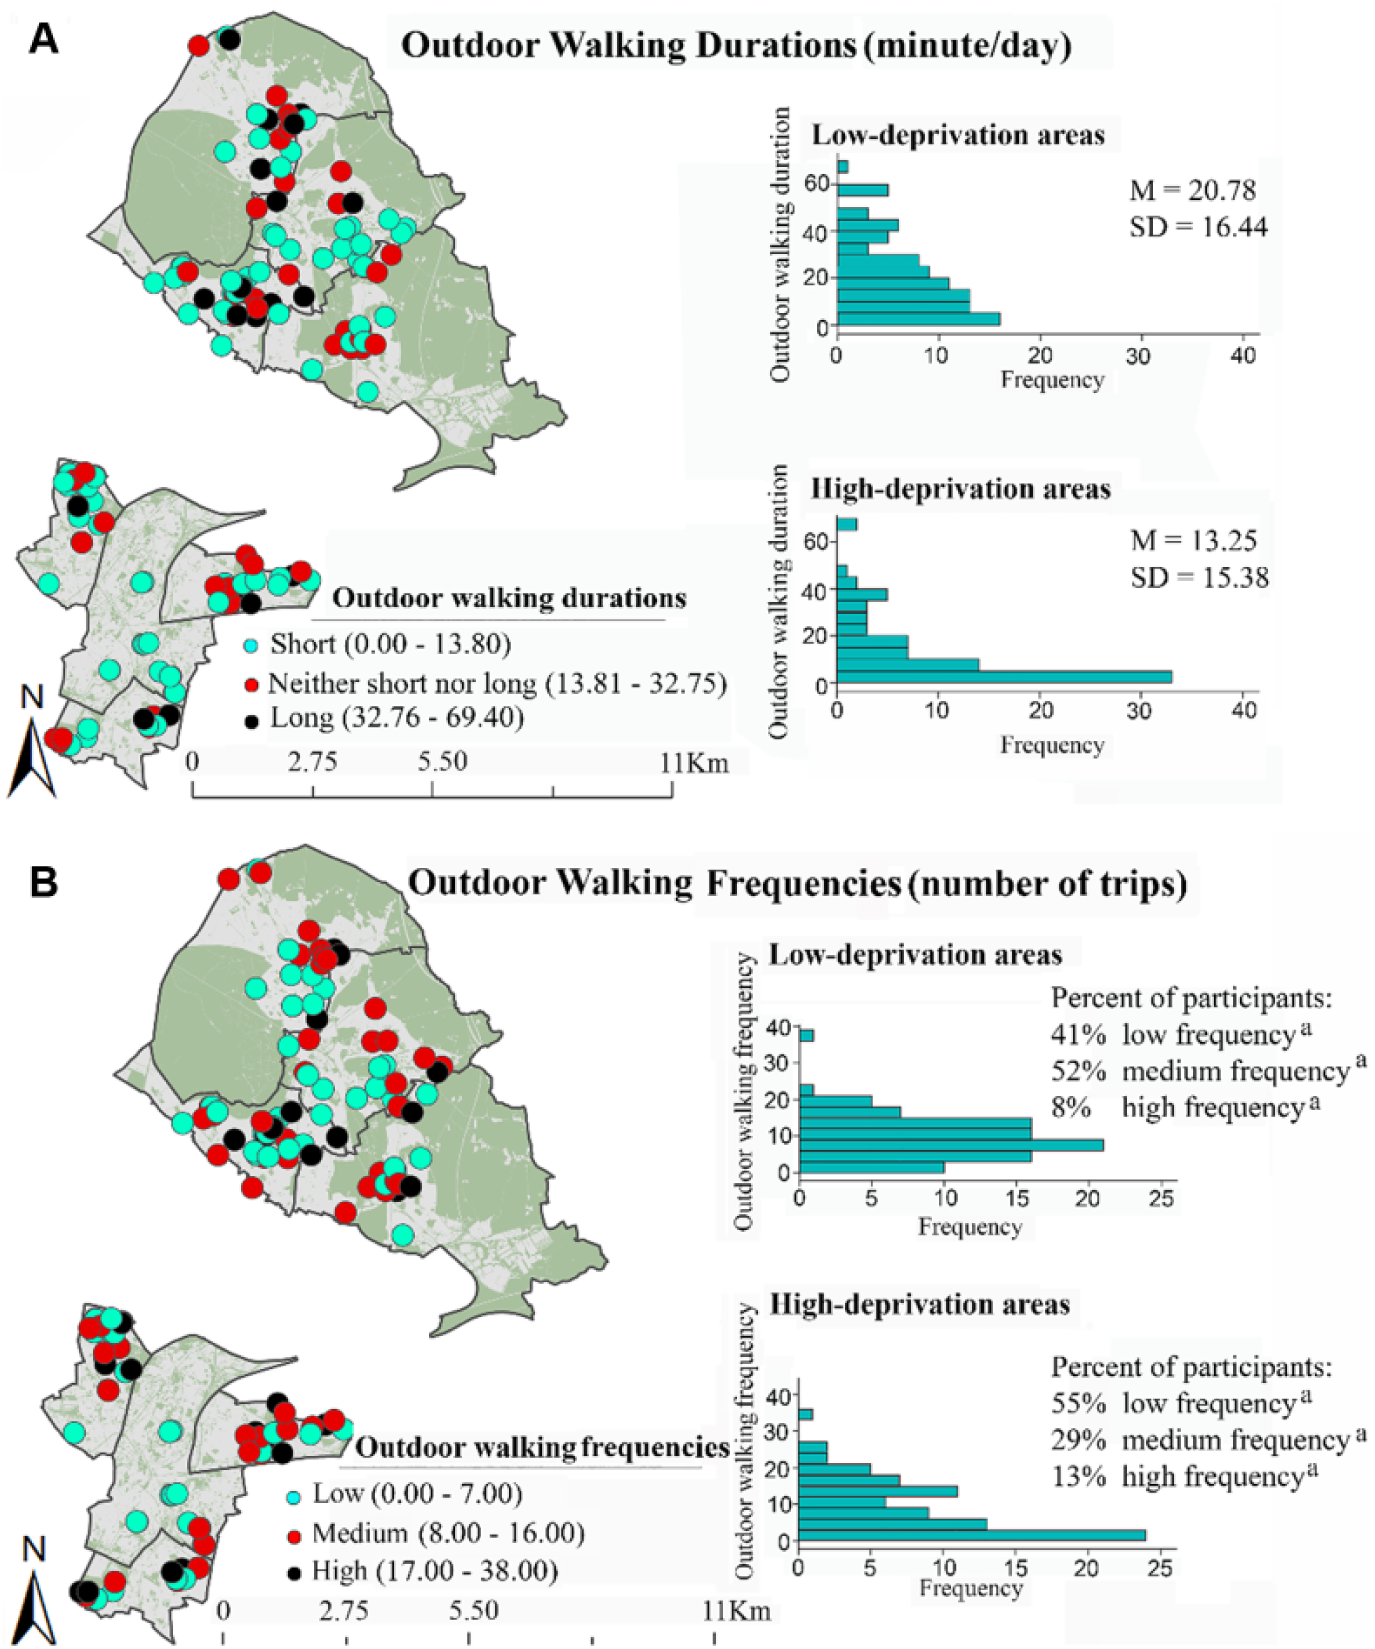
Distribution patterns of outdoor walking durations and frequencies in low- and high-deprivation areas (OS open data boundary line Crown© copyright/database right 2012 and OS MasterMap data Crown© copyright/database right 2012).
Associations Between Personal Characteristics and Outdoor Walking Durations and Frequencies in Low- and High-Deprivation Areas
Table 2 represents bivariate associations between personal characteristics and outdoor walking durations and frequencies in low- and high-deprivation areas. As this table shows, only marital status is independently associated with outdoor walking durations in low-deprivation areas.
The Bivariate Associations Between Personal Characteristics and Outdoor Walking Durations and Frequencies in Low- and High-Deprivation Areas.
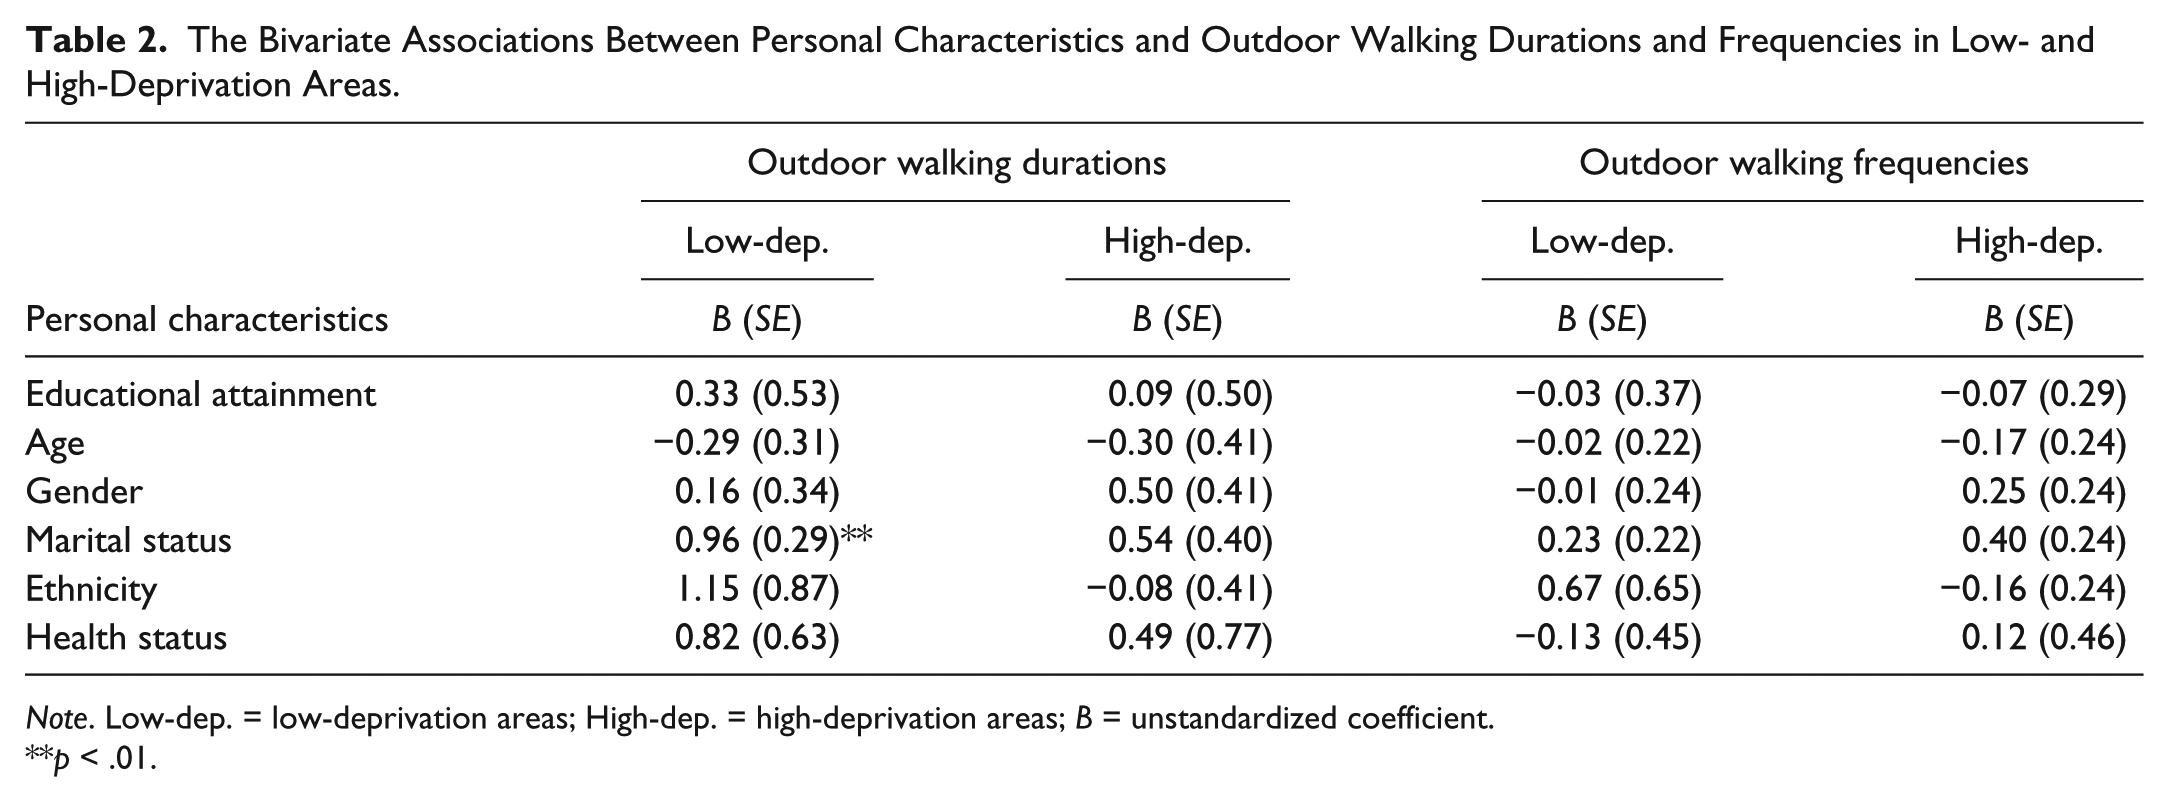
Note. Low-dep. = low-deprivation areas; High-dep. = high-deprivation areas; B = unstandardized coefficient.
p < .01.
Table 3 shows the results of multiple models. It represents associations between personal characteristics and outdoor walking durations and frequencies in low- and high-deprivation areas after dropping the least significant predictors. In low-deprivation areas, only one personal characteristic (i.e., marital status) is associated with outdoor walking durations. None of personal characteristics was associated with outdoor walking frequencies in low-deprivation areas. Personal characteristics were not associated with outdoor walking durations and outdoor walking frequencies in high-deprivation areas. These results (Table 3) were used later for controlling interactions between personal characteristics and area deprivation in total sample.
The Results of Multiple Models: The Associations Between Personal Characteristics and Outdoor Walking Durations and Frequencies in Low- and High-Deprivation Areas.

Note. This table shows the results after dropping least significant predictors (i.e., educational attainment, age, gender, ethnicity, and health status). B = unstandardized coefficient.
p < .01.
Associations Between Area Deprivation and Outdoor Walking Durations and Frequencies in Total Sample
Bivariate associations of area deprivation and personal characteristics with outdoor walking durations and frequencies are presented in Table 4. This table shows that area deprivation is independently associated only with outdoor walking durations. These results indicate that participants residing in high-deprivation areas take shorter outdoor walks than those residing in low-deprivation areas. Three personal characteristics (i.e., educational attainment, marital status, and ethnicity) are independently related to outdoor walking durations. Bivariate associations between area deprivation, as well as personal characteristics, and outdoor walking frequencies were nonsignificant.
The Bivariate Associations of Area Deprivation and Personal Characteristics With Outdoor Walking Durations and Frequencies.

Note. B = unstandardized coefficient.
p < .05. **p < .01. ***p < .001.
Table 5 represents the results of hierarchical analyses. As this table shows, area deprivation is associated with outdoor walking durations after adjustment for educational attainment (Model 1). Area deprivation is also associated with outdoor walking durations, after including all personal characteristics and dropping the least significant predictors (Model 2). In addition to area deprivation, marital status is associated with outdoor walking durations (Model 2). Therefore, participants who live in high-deprivation areas—as well as participants who are single—are more likely to take shorter outdoor walks.
Results of Hierarchical Analyses: The Associations Between Area Deprivation Combined With Personal Characteristics and Outdoor Walking Durations and Frequencies.

Note. Model 1 = only two predictors (i.e., area deprivation and educational attainment) were entered into the model; Model 2 = all predictors (i.e., area deprivation, educational attainment, age, gender, marital status ethnicity, and health status) were entered into the model at once. This table shows the results of Model 2 after dropping the least significant predictors. B = unstandardized coefficient.
p < .05. **p < .01. ***p < .001.
Because marital status was associated with outdoor walking durations in low-deprivation areas (Table 3), we controlled Model 2 for interactions between area deprivation and this personal characteristic (i.e., marital status). The interaction between area deprivation and marital status was not related to outdoor walking durations (Table 5). Moreover, associations of area deprivation and marital status with outdoor walking durations remained significant after adjustment for this interaction (i.e., Area deprivation × Marital status).
As Table 5 shows, area deprivation combined with personal characteristics is not related to outdoor walking frequencies (Model 1 and Model 2). Therefore, participants’ outdoor walking frequencies do not significantly differ between low- and high-deprivation areas. None of the personal characteristics was associated with outdoor walking frequencies (Table 5, Model 1 and Model 2).
Discussion
This study used GPS technology and examined associations between area deprivation and older adults’ objectively measured outdoor walking levels (i.e., durations and frequencies) in Birmingham, United Kingdom. In this study, we showed that independent of personal characteristics, area deprivation associates with participants’ outdoor walking durations. Discussion on the findings of this study is provided in the following subsections.
Outdoor Walking Durations
We found that participants residing in high-deprivation areas spend less time for outdoor walking than their peers residing in low-deprivation areas. This finding is consistent with findings of a previous study examining self-reported outdoor walking durations among adults (Turrell et al., 2010). It is also in line with results of a previous U.K. study on associations between area deprivation and older adults’ walking using accelerometer (Fox et al., 2011). Moreover, it supports findings of past research on physical activity indicating higher prevalence of inactivity in high-deprivation areas than in low-deprivation areas (Hillsdon et al., 2008; Kavanagh et al., 2005; Turrell et al., 2010).
We also found that one personal characteristic (i.e., marital status) is related to outdoor walking durations (Table 5). Single participants take shorter outdoor walks than those who are in relationship. It is likely that participants who are in relationship enjoy benefits of their spouses’/partners’ supports and encouragements and take longer outdoor walks (Booth, Owen, Bauman, Clavisi, & Leslie, 2000; McNeill et al., 2006). The interaction between area deprivation and marital status was not related to outdoor walking durations. It means that associations between area deprivation and outdoor walking durations (Table 5, Model 2) are not moderated by personal characteristics (i.e., marital status). Therefore, area deprivation associates with outdoor walking durations, independent of personal characteristics.
In this study, educational attainment was only independently associated with outdoor walking durations (Table 4). The strength of this predictor decreased when it was combined with area deprivation and other individual characteristics (Table 5, Model 1 and Model 2).
Outdoor Walking Frequencies
We did not find significant associations between area deprivation and outdoor walking frequencies. These findings are inconsistent with findings of this study on outdoor walking durations. These inconsistencies may be explained by type of outdoor walking trips. For example, a round trip in a park or around a block is counted as one trip frequency, but it results in a long outdoor walking duration. A single trip from home to a close shop is also counted as one trip frequency, but it results in a short walking duration. Therefore, the number of times that outdoor walking is performed does not differ between low- and high-deprivation areas, but the length of time spent for outdoor walking varies between these areas.
Findings of this study on outdoor walking frequencies are also inconsistent with a previous study showing association between area deprivation and frequency of walking for transport among adults (Cerin et al., 2009). This inconsistency may be explained by differences in outdoor walking measures. In this study, we used a composite measure of total outdoor walking levels (walking for transport, recreation, and exercise). We did not classify outdoor walking durations/frequencies by walking purposes because of lack of data on outdoor walking purposes. It is possible that area deprivation has a differential impact on durations/frequencies of outdoor walking for different purposes. Studies on adults’ population that differentiate between walking purposes have shown that compared with residents of low-deprivation areas, residents of high-deprivation areas more tend to walk for transport (Turrell et al., 2010) and less tend to walk for exercise/recreation (van Lenthe, Brug, & Mackenbach, 2005). Future studies on older adults may involve outdoor walking purposes and may investigate associations between area deprivation and objectively measured durations and frequencies of outdoor walking for different purposes.
Application of the Findings
Findings of this study indicate that area-level interventions—as well as individual-level interventions—that encourage participants to take longer outdoor walks could be targeted. However, the content of such area-level interventions are not clear and require further research. Although this study identified disparities in participants’ (objectively measured) outdoor walking durations between low- and high-deprivation areas, it did not examine the reasons behind these disparities, because this issue is out of the scope of this study. Future studies may investigate how different attributes of low- and high-deprivation areas may drive disparities in older adults’ outdoor walking durations.
Past research has shown that environmental attributes (e.g., land use mix and safety) may influence people’s physical activity (Haselwandter et al., 2015; Khreis, van Nunen, Mueller, Zandieh, & Nieuwenhuijsen, 2017; Saelens, Sallis, Black, & Chen, 2003), such as walking (Haselwandter et al., 2015; Saelens & Handy, 2008). Associations between area deprivation and outdoor walking levels may be a sign of different influences of environmental attributes on participants’ outdoor walking durations in low- and high-deprivation areas. Findings of this study pave the way for future research to develop a hypothesis on impacts of environmental attributes of low- and high-deprivation areas on disparities in older adults’ outdoor walking durations. This research may investigate what environmental attributes influence older adults’ outdoor walking durations in low- and high-deprivation areas and how.
Limitations
We acknowledge that this study has some limitations. Because it is a cross-sectional study, it cannot provide cause-and-effect statements on associations. Moreover, it involves one proxy of individual deprivation (i.e., educational attainment). Lack of data on participants’ income, as well as other income-related proxies (e.g., household income) prevented this study from involving income as a proxy of individual deprivation. Although previous studies have found “educational attainment” as a stable predictor of physical activity (Gidlow et al., 2006), involving “income” may add more information about associations between area deprivation and physical activity levels. Future studies may improve knowledge on associations between areas deprivation and older adults’ objectively measured outdoor walking levels by involving educational attainment and other proxies of individual deprivation (e.g., income). Moreover, this study addresses participants’ health status, but it does not specifically involve perceived walking difficulties (e.g., knee pain) or use of walking aids due to lack of data.
This study was conducted in one British city and used a convenience sampling strategy for participants’ recruitment. Older adults who participated in this study may not represent all older residents of low- and high-deprivation areas, particularly older residents with perceived poor health status. Moreover, this study could involve two categories of areas (low- and high-deprivation areas). Future research may use a larger and more heterogeneous (in terms of health status) sample and may identify variations in older adults’ outdoor walking levels between more categories of areas (e.g., low-, medium-, and high-deprivation areas).
Despite these limitations, the findings of this study on lower levels of outdoor walking among participants residing in high-deprivation areas versus participants residing in low-deprivation areas is consistent with the findings of previous multilevel studies on physical activity (Fox et al., 2011; Gidlow et al., 2006; Kavanagh et al., 2005). This provides some evidence that the results of this study may not be unique to this sample in Birmingham, United Kingdom.
Conclusion
This study extends the knowledge on associations between area deprivation and physical activity and adds to the literature on older adults’ objectively measured walking levels. This study is one of the first evidence on older adults’ outdoor walking using a multilevel approach and GPS technology. It shows that objectively measured participants’ outdoor walking levels (i.e., durations) vary by area deprivation: Participants residing in high-deprivation areas spend less time for outdoor walking than those residing in low-deprivation areas. This research confirms past research showing negative associations between area deprivation and physical activity levels. Area-level interventions may help to reduce negative impacts of multiple deprivation on older adults’ outdoor walking durations. However, the content of these interventions are not clear and require further research. This study sets the ground for future research to investigate how attributes (e.g., environmental attributes) of low- and high-deprivation areas may give rise to disparities in participants’ outdoor walking durations.
Footnotes
Acknowledgements
We would like to thank all older adults who participated for donating their time and enthusiasm. We would also like to thank Dr. Phil Jones at the University of Birmingham for facilitating the access to the field and the process of data collection and also to thank Dr. Marco Helbich at Utrecht University for his comments on statistical analysis.
Declaration of Conflicting Interests
The author(s) declared no potential conflicts of interest with respect to the research, authorship, and/or publication of this article.
Funding
The author(s) disclosed receipt of the following financial support for the research, authorship, and/or publication of this article: This research was financially supported by Erasmus Mundus scholarship supplied by the European Union.