
Abstract
Using a participatory approach, this multi-method case study compared bicyclists’ perceptions and physical indicators of bikeability on a college campus. Student focus groups discussed campus bikeability and mapped and graded common bicycle routes. Trained students conducted environmental audits with bicycle counts. In discussions, students expressed concerns about safe bicycle riding on campus, especially during peak times. Congestion with pedestrians, other bicyclists, and skateboarders created the potential for crashes. Five major routes were identified with map scores ranging from 21.4% to 70%. Audit scores ranged from 82.5% to 86.7%. Bicycle counts varied by time of day and ranged from 11 to 91 bicycles. Student perceptions of bikeability were poorer than objective assessments of routes. The audit tool did not differentiate enough between routes and did not capture conflict potential accurately. Specification is needed on audit tools to capture the potential for conflict between bicycling and other forms of active transport—especially in unique settings like college campuses. Campuses that have well-marked paths for pedestrians, bicyclists, and motor vehicles and that communicate the importance and ease of bicycling may see the most overall success when promoting active transport options.
Introduction
Active transport is the act of traveling between destinations using some form of physical activity, such as walking or biking. Active transport can also include the physical activity generated getting to and from public transportation (Villanueva et al., 2008). University campuses are unique settings for promoting active transport because users travel frequently between destinations rather than staying in just one building like at most worksites and in lower education. This is especially the case with students who may need to travel between dormitories or apartments, classroom buildings, dining halls, recreation centers, and within the larger community itself. A study of 23 large universities found that 59% of students live less than 1 mile from campus (Daggett & Gutkowski, 2003). Faculty and staff may need to travel around a campus to get to various meetings or to teach in multiple buildings. Distances around and within a university campus can vary substantially, depending on the size of the student population, the campus setting, and limitations on the use of motor vehicles.
Bicycle riding is one form of active transport that helps users get around a campus efficiently—especially when travel distances exceed a kilometer or 0.6 miles (European Commission, 1999). Regular bicycling for transport has the potential to increase physical activity levels among students, faculty, and staff (McCracken et al., 2007). Bicycling can also reduce problems of pollution and traffic congestion and provide a faster method of travel than walking (de Nazelle et al., 2011). The introduction of bike-share innovation opens even more possibilities to use bicycling for active transport around campuses (Fishman, 2016).
The college campus-built environment, however, may either support or hinder bicycling. Safety is one of the most important features of bikeability (Guthrie et al., 2001; Noland, 1995; Whannell et al., 2012). College campuses, even if they are in small towns, may have a high population density, with relatively large numbers of people occupying a small space (Balsas, 2003). Many types of users (e.g., bicyclists, pedestrians, and skateboarders) on off-street paths may experience confusion, and crowding, and a lack of designated lanes on shared paths may increase the risk of collisions between bicyclists and between bicyclists and pedestrians (Moore, 1994; Vedel et al., 2017). The route environment may influence people’s choices about where, when, and whether to bicycle, walk, drive, or take a bus.
Perceptions of an environment can affect bicycling behavior on campus as well. A number of researchers have noted that the perceived and physical built environment have different effects on physical activity behaviors (Ball et al., 2008; Gebel et al., 2009, 2011; Kirtland et al., 2003; Lin & Moudon, 2010; Sallis et al., 2006). In fact, there may exist a mismatch between perceptions and the reality of the environment. A recent study of bicycling behavior in Portland, Oregon found independent associations with bicycling propensity and frequency between the perceived and objective environment (Ma & Dill, 2015). For example, individuals may perceive that a street feels unsafe for bicycling, when in fact, a number of objectives measures, like bicycle lanes and slowed traffic, indicate that the environment is safe for this activity. This mismatch may also interact with the level of experience and skill of individual bicycle riders. Both perceptions of bikeability and objective measures of bikeability can affect actual bicycling behaviors. Environmental assessments that include both types of measures, therefore, are important to understand users’ perspectives, active transport behaviors, and to inform health promotion strategies in a campus setting.
Bikeability refers to how supportive the physical environment is for bicycling. Four methods are typically used to assess bikeability: (a) surveys, (b) global information system (GIS) data, (c) audits, and (d) observations (Maghelal & Capp, 2011). These methods can be organized into two broad categories of measures: objective (GIS, other spatial data, audits, observations) and perceived (interviews, discussions, surveys) (Brownson et al., 2009; Kellstedt et al., 2021). Objective methods can provide detailed information about a number of environmental characteristics such as the width of lanes, presence of parked cars, and absence of shade. But methods assessing perceptions provide information about users’ feelings about safety and comfort with the environment and recognize individual differences. Qualitative methods like interviews and focus group discussions can provide context for student decisions about where, when, and whether to ride. Ewing and colleagues recognized the need to include perceptual qualities when characterizing the built environment for walkability or bikeability (Ewing et al., 2006), though few studies researching the factors related to the built environment include both quantitative and qualitative methods (Amaratunga et al., 2002). A case study is a helpful approach for exploring the complexity of these contextual factors of perceptions and observations of bikeability in a single setting (Baxter & Jack, 2008). The purpose of this case study was to use a participatory approach to compare bicyclist perceptions of bikeability and objectively measured physical indicators of bikeability on a large college campus, in terms of safety, quality, and comfort. We hypothesize that there will be a mismatch between users’ perceptions and objective measures of bikeability on a college campus.
Method
Setting
This case study took place at a large land-grant university that spans 5,200 acres on the main campus, with over 68,000 students (53,672 undergraduate and 14,931 graduate) and 3,000 faculty and 7,000 staff.
Study Design
Using a multi-method and participatory approach, we explored bicyclist perceptions of campus bikeability during focus group discussions and mapping activities, and we compared those perceptions to measures of campus bikeability based on physical indicators recorded through direct observation audits and bike counts. All study protocols were approved by the University Institutional Review Board (IRB).
Focus Groups
Focus group recruitment and data collection
Upon IRB approval, in the fall semester of 2018, all students enrolled on campus were contacted via email to ask whether they wished to participate in focus groups to discuss bicycling and bikeability issues on and around campus. Eligibility requirements included being a current student of 18 years of age or older, having bicycled with the bike-share bicycles on campus at least five times in the past year, and being available to participate in the group discussions on a given date in November 2018. The criteria that students had used bike-share at least five times in the past year would ensure that participants had both some familiarity with bicycling on campus and include people with different levels of bicycling ability. The email included an information sheet stating the purpose of the focus groups to discuss perceptions of bikeability on and around the university campus. Focus group sessions were scheduled before the students’ fall exams were to begin.
Once the focus groups were filled, participants were sent a follow-up email with a link to a brief Qualtrics survey to be completed prior to the discussions. The survey asked for demographic information about each participant, including class rank, residency, and sex. In addition, it asked about bike-share use, personal bicycle use, and confidence and skill in bicycling. Those that were not able to complete the survey prior to the discussions were given the opportunity to do so using a paper survey at the beginning of the focus group discussions. Thirteen students responded to the email to indicate a willingness to participate and had availability on the given focus group dates. Two hour-long groups were held on November 16, 2018 with a convenience sample of 11 students. The first group had three students (two students did not show up who had originally indicated they would participate), and the second group had eight students.
Focus group participants took part in two activities. The first activity was a discussion of participant use of bike-share bicycles along with their perceptions of what makes routes on campus feel safe, of good quality, and comfortable for riding. This study will focus less on bike-share use and more on perceptions of bikeability. Table 1 includes the focus group discussion guide. The purpose of this discussion was to discover whether student perceptions of the components of bikeability matched those of an audit tool to be used to conduct direct observation assessments on campus. The second activity was a mapping activity for students to identify biking paths for assessment. A similar mapping technique was used in recent studies to assess both pedestrian and bicyclists’ route preferences (Agrawal et al., 2008; Koh & Wong, 2013). Maps that included streets, buildings, parking lots, and green spaces were downloaded from a campus map portal. Focus group participants were asked to individually use pre-printed maps of the campus to reveal their most often-used routes for bicyling. Participants highlighted and evaluated their most often used routes using green, yellow, and red markers, based on the themes of safety, quality, and comfort. Participants were instructed to use green to highlight routes they perceived to be very bikeable, yellow to highlight somewhat bikeable routes, and red to highlight the least bikeable routes. They were encouraged to write notes and circle any places on the maps that were either particularly problematic or supportive for bicycling.
Perceptions of Bikeability Focus Group Discussion Guide.

Focus group analysis
Recordings were transcribed and coded using thematic analysis (Burnard et al., 2008). Interviewers coded each transcript independently. After an iterative coding process and meetings, consensus was reached on emerging themes. Direct quotes associated with each theme were recorded using Microsoft Word. Results are presented as themes and quotes associated with each theme. Coding was done using qualitative software NVivo 12.0. Maps were analyzed by counting the frequency of red, yellow, and green ratings for the most common routes that students identified. For purposes of comparison to audit data, a numerical score was then assigned to each route. After assigning a point value for each color: red = 0; yellow = 1; and green = 2, the total points for each route were divided by the highest possible points for each route based on how many participants rated the route and multiplied by 100 to come up with a score.
Direct Observation Audit and Bike Counts
Audit and count data collection
After the focus groups were completed, and before the end of Fall semester, we conducted environmental audits of the five common routes that emerged from the focus group mapping activity (three of the five routes matched data showing heavily trafficked bike-share routes provided by the university transport services). The tool that was chosen for this assessment was a 2012 adaption by Horacek and colleagues of the CDC Health Worksite Initiative Walkability Audit (Dannenberg et al., 2005; Horacek et al., 2012). The adaption used by Horacek and colleagues in a 2012 study of walkability and bikeability on college campuses added measures of bikeability from the Systematic Pedestrian and Cycling Environmental Scan audit tool (Horacek et al., 2012; Pikora et al., 2002). The tool was used in 2012 to objectively evaluate the walkability and bikeability of 15 college campuses around the United States. The Horacek et al. tool breaks safety, comfort, and quality into 12 criteria that are graded independently. Each criterion is scored on a scale of 1 to 5 where 1 is the least favorable environment for walking and bicycling, and 5 indicates the best environment. One criterion based on night-time safety was removed from our analysis since all audits were conducted during the daytime. The three remaining criteria scores for safety were weighted by three to reflect their relative importance. The seven criteria scores for quality were weighted by a factor of two, and the final criterion of shade was only multiplied by one according to published scoring guidelines. Each segment of each route was audited to receive a numeric score for each of the 12 criteria, and the total score was converted into a letter grade. Inter-rater reliability was high when Horacek and colleagues developed the tool (93%–97%), and the tool had the benefit of being easy-to-use (Horacek et al., 2012). The lead researcher divided each route into segments based on changes in the nature of the route (e.g., the route changed from a bike lane on a road to a multi-use path) and then audited each route. In addition to the lead researcher’s audit of the routes, university students (both undergraduate and graduate) and one faculty member were recruited to audit the five routes and conduct bicycle counts. Student auditors attended a 2-hr long training session that included instruction and conducting test audits prior to data collection. Two auditors were assigned to each route. Each auditor was provided a clipboard, pen, instructions, a route map, assessment instruments (one for each segment), and a bicycle count summary sheet. The auditors were instructed to conduct audits between 9:00 am to 5:00 pm on weekdays between November 27 and December 5, 2018. This period took place during the typical university schedule and before classes were finished for the semester.
The bicycle count was taken along each route during a peak period of high traffic and during a non-peak period using the Go Counter mobile app and was used to assess congestion (“Go Counter Free Traffic Counting App for Planners, Advocates and Transportation Professionals—Rails-to-Trails Conservancy,” n.d.). Peak minutes were chosen based on the university-wide daily class schedule. Peak times were identified as those on weekdays between class sessions when foot, bicycle, and car traffic would be at its highest. Non-peak times included all other times during the 9:00 am to 5:00 pm period. For a period of 30 min on each route (15 peak min and 15 non-peak min), the student auditors counted how many bike-share bicycles and how many personal bicycles rode past the observation location.
Audit and count analysis
Each segment and route audited by the lead researcher was scored with a bikeability score based on this calculation: score = ([ * safety criteria score total] + (2 * quality criteria score total) + shade,/120) * 100. The scores for the student auditors of each route were calculated the same way and were tested for inter-rater reliability. The inter-rater reliability of the scores was tested using a weighted Kappa statistic, to take into account that a one rating difference between raters was not as extreme as a two or three difference in rating. Weighted Kappa analyses were performed in Stata/SE 15.1. Using the Altman benchmark scales for Kappa values: < .20 = poor inter-rater reliability; .21–.40 = fair inter-rater reliability; .41–.60 = moderate inter-rater reliability; .61–.80 = good inter-rater reliability; and .81–1.00 = very good inter-rater reliability (Altman, 1991).
The audited routes were assigned letter grades following published guidelines based on their numeric scores. A score greater than 85% received an A; a score of 70 to less than 85% received a B; a score of 55 to less than 70% received a C; and a score less than 55% received an F. Each route score assessed by the lead researcher was compared with the summarized focus group assessments of the routes for safety, quality, and comfort. Counts of bike-share and personal bicycles during peak and non-peak times were compared. This study will focus on the total number of bicycles counted during peak and non-peak times.
Results
Focus Group Discussions
Table 2 summarizes the demographics and bicycling behaviors of the sample of students. Out of the 11 participants, 36.4% lived on campus (n=4), and 54.6% were female (n=6). Each university level was represented with three participants that were in their first year (freshmen), three that were in their second year (sophomores), two that were in their third year (juniors), one that was in the fourth year (senior), and two that were graduate students. Most of the participants indicated they were average level bicycles riders (72.7%), and almost all participants expressed that they were very confident in their bicycle riding ability (80%). None of the focus group participants used a personal bicycle around campus; five participants said they used bike-share bicycles often, while four said they used bike-share bicycles sometimes.
Focus Group Participant Demographics (n = 11).

The first half of the focus group was spent discussing the open-ended items in Table 1 organized by the following themes: bikeability on campus in terms of safety, bikeability on campus in terms of quality, and bikeability on campus in terms of comfort, though there was considerable overlap among these themes.
Bikeability in terms of safety
Students expressed concerns that the quickest routes on campus did not have designated bicycle lanes, including those off-street paths that were shared with pedestrians. Some routes (both off-street and on-street) did have bicycle lanes but did not indicate which direction bicycles should go. Blind corners where bicyclists could not see pedestrians or other bicyclists were a concern. A second-year student that lived off-campus said the following: I would say like you said, the crowded comment, there’s a lot of [people]– I mostly bike on main campus, and there’s a lot of blind corners I guess you would say, and people don’t watch on bikes or off bikes. And so you’re turning the corner and you’re afraid you’re going to hit someone or you’re going to have a bike accident.
The on-street bicycle lanes were not necessarily connected, and even if they were present, cars or people may be in them. The lanes may also have had problems with bumps and uneven surfaces. One second-year student who lived on campus discussed the safety of the bike lanes: . . . even if there is a bike lane sometimes it’s just cars think they own it or people think they own it. It’s not too clear sometimes or people don’t care.
Focus group participants expressed that they did not know the rules of the road and who should go first at an intersection where cars, bicycles, and pedestrians were present. Sharing the sidewalks and off-street paths with pedestrians was problematic for bicyclists. During peak hours of the day, sidewalks, and paths, and even roads, were congested with pedestrians—some of whom were distracted by cell phones. Construction along routes meant pedestrians stepped off sidewalks and ended up in the road and blocking bicycle lanes. A third-year student living off campus made the following comment: So, you’ll be riding your bike and you’re riding it where the pedestrians are as well and you’re having to dodge them in the first place and there are cars that are speeding past you swerving out of the way to miss them and it happens every day to me.
Riders on personal bicycles often rode much faster than bike-share bicyclists because the frame of their bikes was lighter and they had more gears to use, which felt unsafe for bike-share users when sharing lanes or paths with them. Skateboarders could also cause some problems, because participants were uncertain whether they belonged in bicycle lanes. Some bike-share users were concerned about sharing the road in the on-street bicycle lanes so close to cars and expressed a desire for more of a buffer. A final safety concern expressed in the focus groups was how bike-share use does not lend itself to wearing helmets.
Bikeability in terms of quality
Participants explained how the irrigation system on campus often left large puddles that pedestrians and bicyclists swerved to avoid. They talked about how some of the path surfaces on main campus had problems with tree roots pushing up and causing bumps. Participants voiced that some of the brick and gravel surfaces on campus were not as good for bicycle riding, and some tree branches hung over on paths. They said that even if bicycle lanes were present, they may not have stood out as bicycle lanes. A third-year student living off-campus said: It’s always flooded on that one sidewalk so like she said everyone’s in the street and there’s a fence on the street as well, because of the construction. So you’re like riding it like this and cars are barely missing you.
Bikeability in terms of comfort
Participants talked about discomfort with uneven, jagged sidewalks. If the bicycle lane sloped as it approached the curb, it was uncomfortable for bicyclists. Finally, participants expressed their concerns with crossing roads on their bicycles at intersections, given uncertainty about right-of-way with cars and pedestrians. A fourth-year student who lived on campus expressed the following: . . . they use the bike lane and they just put it over storm drain. So you’re riding on it like a . . . degree slant for drainage. So it seems when they do plan for drainage it is bad, and when they don’t it’s also bad.
Focus Group Mapping
During the second half of the focus group, participants marked up maps using red, yellow, and green markers. Table 3 summarizes five common routes that emerged and shows a numerical score for each route based on participants’ color ratings. Route 1 was a three-segment route located between the campus memorial student center and the recreation center. The route contained one segment that included a protected road (only certain vehicles and buses were allowed) and the remaining segments became an off-street path that went through a tunnel that was completely protected from car traffic. Route 2 was a three-segment off-street path that ran from the student center to a large dining hall on campus along a large academic plaza. Route 3 was a four-segment route that headed east and contained low-traffic roads from the student center toward a central parking garage. Route 4 was a three-segment route that started near a large green space and headed under a bridge to academic buildings on the west side of campus. Half of the route was protected from car traffic along an off-street path. The other half contained a road with limited vehicle traffic. Route 5 was a four-segment route that ran east and west along a protected road from the main dining hall to the far east side of campus. All five routes were 0.4 miles in length. Routes 1–3 were identified as the most used bike routes from the university transport services bike-share data. Routes 4 and 5 emerged as additional routes used by many of the focus group participants.
Focus Group Ratings of Routes With Numerical Scores.

Route 1 was the most-used route by focus group participants, with 7 out of 11 indicating they used the route. Two participants gave the route a red rating, four gave it a yellow rating, and one gave it a green rating. Route 2 did not have any red ratings but had four yellow and one green rating. Route 3 also did not have red ratings but was given three yellow ratings and two green ratings. Route 4 had the highest number of red ratings with four participants assigning it a red and three giving it a yellow rating. Route 5 had one red rating, three yellow ratings, and two green ratings. Route 3 had the highest score at 70.0 whereas Route 4 had the lowest score at 21.4.
Environmental Audit
Five commonly used routes for biking were identified for environmental audit from bike-share data provided by the university transport services and by researchers based on data provided by the focus groups. Three of the routes had three segments each and two routes had four segments, for a total of 17 segments. The routes were numbered and named based on campus landmarks or street names, and each segment was also given a name/letter assignment. Each segment of each of the five routes (n=17) was audited based on 12 criteria.
Table 4 shows a mean score (on a scale of 1–5 where 1 is the least favorable environment for walking and bicycling, and 5 indicates the best environment) for each of the 12 criteria. The first three criteria related to safety, the next seven related to quality, and the final criterion related to comfort. The presence of pedestrian facilities and mobility impaired accessible paths received the highest scores (5.0) across all segments. The lowest average score was for the criterion named “bikeability” at 1.9 due to lack of designated bicycle lanes and insufficient bicycle lane signage on various segments. The next lowest scores were 3.5 for potential pedestrian/bicyclist/vehicle conflicts and 3.8 for crosswalk quality. All other mean scores fell between 4.0 and 4.9.
Segment Scores by Criterion (n=17).

Table 5 summarizes the environmental audit total number score and grade for each route broken down by segment and provides an overall score and grade for the five routes. Seven segments (41%) received an A grade, while 10 segments (59%) received a B grade. Route 2, a route with an off-street path cutting across campus that was completely protected from motor vehicles, received the highest score at 86.7%. The lowest score was attributed to Route 5 at 82.5%. The overall score for all routes evaluated was 84.4%. Routes 2, 3, and 5 had very good inter-rater reliability, whereas route 1 had moderate reliability, and route 4 had good inter-rater reliability. The weighted Kappa scores for inter-rater reliability were moderate for one route and very good for all the other routes (Table 5).
Environmental Audit Scores.

Bicycle Counts
The peak versus non-peak bicycle counts is summarized in Table 6. Route 5 had the highest number of bicycles counted, with 91 bicycles in a 15-min peak time and 17 bicycles in a 15-min non-peak time. Route 1 had the next highest with a count of 67 bicycles. The third highest count of bicycles took place along Route 3 with a total of 56 bicycles counted. These three routes were those identified by the university transport services as highly trafficked bicycle routes using a GPS heat map. Routes 2 and 4 had similar numbers of bicycle counts at totals of 36 and 35 bicycles, respectively. These two routes were those identified as additional commonly used routes during the focus group mapping activity.
Bicycle Counts.

Comparison of Focus Group and Audit Results
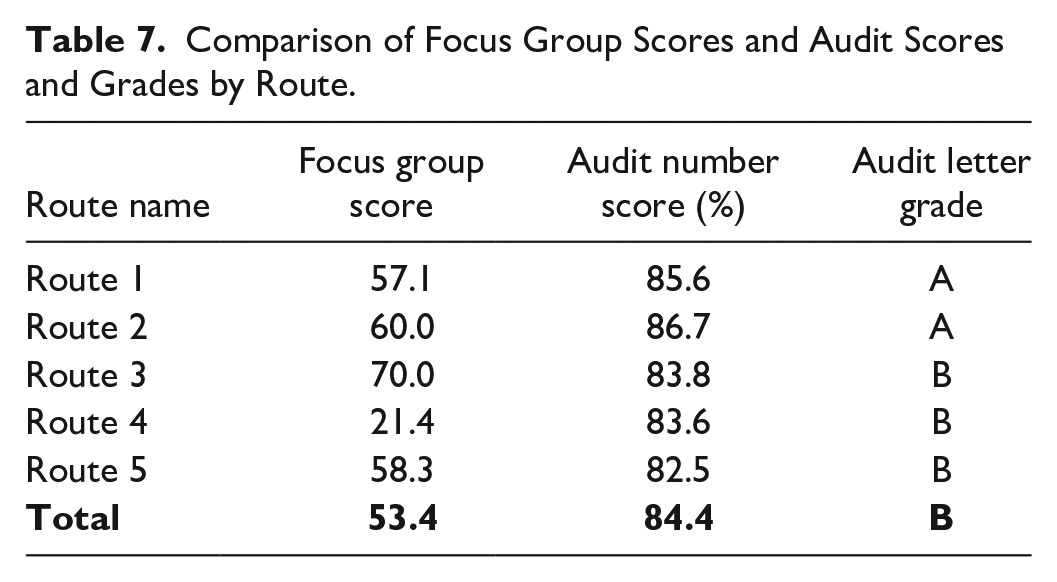
Table 7 summarizes the differences between the perceptions of the five identified routes as explored with student participants during focus groups and the direct observations of the routes as assessed during environmental audits. The focus group ratings of the routes were more varied and in, in general, lower than the audit scores of the routes. The closest match was on Route 3 with a score of 0.80 by focus group participants and an audit score of 83.8. The largest mismatch between focus group ratings and environmental audits was 0.48 and 83.6, respectively, on Route 4.
Comparison of Focus Group Scores and Audit Scores and Grades by Route.
Discussion
The purpose of this case study was to use a participatory approach to compare bicyclist perceptions of bikeability and objectively measured physical indicators of bikeability on a large college campus, in terms of safety, quality, and comfort. The results show that student perceptions of bikeability both in the focus group discussions of bicycling on campus and as mapped on five commonly used routes on campus did not match the objective assessments of those routes. Focus group participants highlighted more problems along the five routes than the audit tool captured. Three of the five routes (Routes 1, 4, and 5) were given at least one red rating. Route 4 was graded particularly low by focus group participants with four red ratings and no green ratings, even though it received a “B” grade by the environmental audit. Routes 3 and 4 were rated the safest and most dangerous routes, respectively, by the participants, but the audit tool gave the routes almost identical scores.
Our results indicate that the two key reasons for this mismatch were campus congestion during busy times and confusion about where different forms of active transport on campus paths belonged, neither of which could be captured with specificity using the audit tool. As noted, the focus group participants discussed their concerns for safety while bicycling because of the number of pedestrians, other bicyclists, and even skateboarders on campus and the confusion about places and rules for bicycling. This was particularly true on paths shared by all types of users. Bicycle counts highlighted this potential for user conflict along multi-use routes—especially during peak times. The audit tool, while fairly reliable and easy to use, did not differentiate between routes in our analysis. All route scores were within three points of each other. This lack of variability in route scores may have reflected the lack of specificity in the tool with regards to potential for conflict. One of the safety criteria on the tool addressed “potential for conflict,” but only between pedestrian/bicyclists and motor vehicles. In a campus setting, potentials for conflict may be greatest between bicyclists and pedestrians—and users like skateboarders and scooter riders as well. The mean score for this criterion was 3.5, quite high given the number of bicycles counted along some of the routes and the foot traffic during peak hours. Student auditors were instructed to consider potential conflicts between bicyclists and pedestrians, but a tool that is specific to college campuses should include other potential conflicts, like pedestrians, personal bicycles (that ride at higher speeds), bike-share bicycles, skateboards, and scooters. Time of day should be an important consideration when auditing.
The literature reports a similar mismatch between user perceptions and the actual characteristics of the built environment, but past research has highlighted that it is differences in populations that perceive the environment to be less safe. Ball and colleagues in their 2008 study found that there was a mismatch between perceptions and objective assessments of built environment features—especially among younger and older women, those with lower income, and lower physical activity (Ball et al., 2008). Gebel et al. found a fair match between perceptions and objective measurements of walkability in their 2009 study (Gebel et al., 2009). But mismatch occurred more often with individuals with lower levels of income and education and those that were less physically active. Our study indicates that the mismatch between perceptions and objective measures on a college campus is not specific to a demographic, but more a result of something happening in the environment that was not being objectively captured. The focus group participants had experience riding on campus and reported a high level of confidence in their bicycle riding ability (80%).
Understanding this potential for conflict is important for assessing the bicycling environment and bicyclists’ behavior. Vedel and colleagues in a study about cyclists and crowding found that cyclists were willing to ride out of their way to avoid potential conflicts if a route was too crowded (Vedel et al., 2017). An Amsterdam study of paths traveled by different types of users (but not vehicles) found that an increase in the number of users led to an increase in the number of conflicts (Zacharias, 1999). Even a potential for conflict can affect how a bicyclist will use a route. A recent study in Portland, Oregon found that both the actual and perceived built environment influenced biking behavior (Ma & Dill, 2015). Perhaps students are choosing not to even ride bicycles in certain areas of campus because of the congestion at peak times. Several focus group participants shared that they only rode bicycles at night on campus, because they perceived it to be too crowded during the day.
The focus group discussions also provided insight into the difference between perceptions of bicycle lanes on campus and the objective assessments of the bicycle lanes on specific routes. Participants reported that bicycle lanes were not apparent on common routes, and the low mean score of 1.9 for the “bikeability” criterion on the environmental audits (“bikeability” on the tool referred to presence or absence of bicycle lanes) reflects that perception. When bicycle lanes did exist, markings were sometimes not noticeable and were not consistent. Several routes only had small signs that indicated bicycle lanes existed at the beginning or end of the routes. If bicyclists got on the routes somewhere in between they would not be aware that bicycle lanes existed on that route. On routes that were on off-street paths that crossed campus and tunnels (Routes 1, 2, and 4) that went under major roadways, bicycle lanes were not as apparent either. On Route 1, bicycle lanes existed but the signage was positioned high and may have been out of a bicyclist’s field of vision. The directionality of the bicycle lanes was not highly visible as well. Even though the auditor who is carefully observing the environment may note a bicycle lane sign, an actual user of the route may not see it. Paths across campus lacked any signage about how bicyclists and pedestrians should share the path. Even when bicycle lanes existed on roads or on off-street paths, bicyclists were concerned about pedestrians walking in the bicycle lanes.
Overall, the CDC Health Worksite Initiative Walkability Audit as adapted by Horacek and colleagues was quite easy to use (Horacek et al., 2012). However, the tool was not helpful in capturing potentials for conflict because of campus congestion and active transport confusion, and, therefore, was not effective on its own in identifying strengths and weaknesses of the bicycling environment on campus. As recorded in Table 5, the route scores ranged between 82.5 and 86.7. This small amount of variability among route scores and the mismatch between the audits and user perceptions indicate that the tool in its current form may not be suitable for campus auditing of bikeability. The tool could be adapted to include more specific measures of bikeability. For example, the criterion “bikeability” could be broken down into subcategories to evaluate the bicycle lanes themselves and the signage for them. Even if bicycle lanes did exist, they may not have directed bicycle flow appropriately, and some types of bicycle lanes may have worked better than others. As mentioned previously, the potential for conflict safety criterion could be expanded to include potential conflicts among all path users. Motorized vehicles may not be the biggest safety concern when bicycling on a college campus. Time of day needs to be an important consideration of a campus environmental audit since there are peak times for traffic.
Strengths and Limitations
A strength of our research was the participatory approach. Focus groups were comprised of students, and students helped to audit the routes. The focus group participants and the student auditors had varying levels of bicycling expertise but were all quite familiar with the campus. Researchers would likely have missed nuances of campus bikeability, such as irrigation problems and potential for conflicts during peak times, if students had not made them aware. The multiple methods reinforced the need for assessing both perceptions and objective measures when evaluating bikeability. This methodology could be easily applied at other campuses or in comparisons of campuses, and the methods used for discussing and mapping bikeability in focus groups could be scaled up to include a larger sample using on-line mapping technology. Our research underscores the need for an assessment tool that accurately captures issues of congestion and confusion and can be adapted to the unique setting of a college campus. Our study was limited due to the low number of focus group participants, and the fact that those who agreed to participate may not fully represent the larger student body. We may have been able to get more participation in focus groups if the meetings were held earlier in the semester.
Implications
The unique findings of this study could help to better design the campus bicycling environment and promote bicycling behavior in a university context. Campuses would do well to consider perceptions of student, faculty, staff, and community members when planning for bikeability improvements. Better tools are necessary for capturing micro-scale data on commonly used routes. Campuses need to regularly evaluate traffic flow and adjust plans for moving the population around campus in a way that promotes health, safety, and active transport. Programs for promoting bicycling need to include well-communicated and enforced rules for how to bicycle safely. All modes of transport on a college campus need to be aware of each other and follow the rules of traffic, even pedestrians, skateboarders, and scooter riders. A community-wide bicycle safety campaign could improve this awareness. Built environment improvements like lane markings for different forms of transport and visible signage will lessen confusion about who should go where, especially during busy times. In particularly congested areas, bicyclists may need to be required to dismount and walk their bicycles in order to prevent collisions. Campuses that have well-marked paths for pedestrians, bicyclists, and motor vehicles and that communicate the importance and ease of bicycling may see the most overall success when promoting active transport options.
Footnotes
Acknowledgements
The authors acknowledge the contributions of Ms. Katie Bradley, Dr. Selina Stasi Johnson, Texas Transportation Institute, and the Texas A&M students who participated in focus groups and conducted environmental audits.
Declaration of Conflicting Interests
The author(s) declared no potential conflicts of interest with respect to the research, authorship, and/or publication of this article.
Funding
The author(s) received no financial support for the research and/or authorship of this article.
Ethics Statement
All study protocols were approved as exempt by the Texas A&M Institutional Review Board under IRB2018-0428M