
Abstract
Graphic organizers (GOs) are fast becoming acceptable standard instructional tools across subjects in the education arena globally. However, this visual representation of information is yet to be recognized and integrated into the teaching methods in Nigerian schools. This study, therefore, presents a research-based investigation of the usefulness of GOs in the appreciation of prose literature in Nigeria, with a view to foregrounding their use in Nigerian schools. Specifically, the study seeks to find out whether senior secondary students in prose literature-in-English in Nigeria who are taught with GOs perform better in prose and comprehension assessments. Four project secondary schools with total of 100 students were purposively selected for the study. The schools were grouped into two: graphic-based schools (GBS) and non-graphic-based schools (NGBS). Whereas the GBS was exposed to instruction via eight graphic organizers, the NGBS served as control. Subjected to descriptive statistics and one-sample t test analysis, the investigation reveals that graphic organizers make students take charge of the learning process in prose literature classes, and it concludes that these visual instructional elements guarantee student understanding and achievement. The study, thus, recommends the incorporation of graphic organizers in the teaching and learning processes across subjects in Nigerian schools.
Introduction
In its recent poll, NoiPolls (2016) 1 asserts that most Nigerians were of the opinion that the English language is declining in Nigeria. In fact 68% of the participants agreed that comprehension has declined in the last decade. It further reports that the reading culture in Nigeria is so abysmal that only 4% Nigerians read at least a book or a piece of literary material a day. They (the participants in the poll) blamed the decadence on “poor educational system” and “cultural influence.” Some of the recommendations in the report are that English language should be made a requisite recruitment criterion and reading should be encouraged. The message here is not so much the decline of an official language as the exposition on the decaying literacy level in the country.
In 2013, participants of the famous Lagos Book Club 2 note that candidates writing literature in English lacked familiarity with the texts examined; they assert that the candidates narrated “when they should be discussing, analysing . . . or explaining specific notions . . . opinions and assertions etc.”; that they generally deviated from the questions. One important recommendation from the club is the “need to raise the standard of teaching literature in Nigerian schools.” One way of doing this is to introduce new approaches to teaching literature, hence the need for the current research.
Interestingly, many years before the findings of NoiPolls and the reports from Lagos Book Club, many researchers in Nigeria had commented on the continuous fall of the English language proficiency among Nigerian secondary school students (e.g., Afolayan, 1984; Onukaogu, 2012; Uba, Oteiku, & Abiodun-Eniayekan, 2016). Similarly, some scholars such as Oguntuase (1990), Obemeata (1995), Oladoyin (2006), and Uba et al. (2016) have noticed a similar trend among postsecondary school students in the country. As in the NoiPolls’ recommendations, the counsel that runs as leitmotif in the works of these scholars is the enhancement or promotion of good reading culture. Incidentally, one sure way of enhancing the reading capacity of the English as a second language (ESL) learner speakers is through literature immersion. As noted by Uba et al. (2016), having literature-in-English in the academic curriculum in Nigeria is one thing, but teaching it successfully to students is entirely a different thing. For students to maximally benefit from literature lessons, they (the lessons) have to be organically composed and presented. One way of making literature interesting and engaging to students is by making it visually and tactilely appealing to them. An interesting approach to achieving this, however, is through the use of graphic organizers (see Alshatti, 2012; Claggett, 1992; Lovitt, 1994; Marzano, Pickering, & Pollock, 2005; Onukaogu, 2012; Sam & Rajan, 2013; Uba et al., 2016), hence the current investigation.
The significance of literature in the teaching of reading comprehension has been studied for many years by scholars around the world with findings ranging from those declaring it vital to enhancing students’ cognitive abilities in English language learning process (see Shokrolahi, 2014; Suleyman, Nurdan, Mehtap, & Arzu, 2013; Ozkan & Tongur, 2014; Ulbrich, 2013) to others decrying it as redundant or impeding students’ performance at reading and understanding comprehension of English (Ashley, 2015; Rascher, 2015). For clarification, literature is used here in its strict sense to mean any fictional or imaginative writing that can be categorized into any of the three major genres of literature—poetry, prose fiction, and drama. However, in this study, the focus is on prose fiction. Compared with other forms, literary writings are not only “distinguished in form, expression and emotional power,” but also they have “evaluative as well as descriptive functions” (Abrams & Harpham, 2005, p. 153). Literature enhances the language capacity of learners. Therefore, if the teaching of literature is enhanced in Nigerian schools, there is the tendency that students’ English language proficiency will be improved. The authors believe that this would complement the effectiveness of graphic organizers on the understanding of prose fiction.
The study is set to achieve two main objectives, which are (a) to ascertain the perception of literature-in-English teachers and students of the role of GOs in improving teaching and learning of prose, and (b) to find out whether the performance of students taught with GOs would be better than those students taught without GOs. To this end, the authors hypothesize that senior secondary school students in Nigeria who are taught with GOs in prose literature-in-English do not perform better in prose and comprehension tests than their counterparts who are not taught with GOs.
Graphic Organizers and Learning
Also known as cognitive maps or content webs or concept maps, graphic organizers are visual and kinetic display of information designed for the benefit of all classes of learners. They are drawings that use geometric shapes or tables to show the relations between various pieces of information (Zwiers, 2004). There are several types of graphic organizers explained by many scholars. Some of them are attribute chart, story map, main idea and detail chart, cause and effect diagram, Venn diagram, flow diagram, sequence chart, concept map, big question map, circle organizer, discussion map, and so forth (for further explanation, see Alshatti, 2012; Bellanca, 2007; Fisher & Schumaker, 1995; Merkley & Jeffries, 2000; Uba et al., 2016). 3 Irrespective of the type of organizer one chooses, three basic factors need to be considered when constructing one. These are summarized by Baxendell (2003) as follows:
The literature is enriched with many studies that have focused on GOs and their effects on students learning ability. For example, Miranda (2011, p. 95) examines the effects of GOs on the reading comprehension of one female with learning disability. The finding of that study indicates that GOs are “an effective reading comprehension intervention for the ELL with LD.” The studies of Kim, Vaughn, Wanzek, and Wei (2007) and Manoli and Papadopoulu (2012) maintain that the use of GOs enhances reading comprehension among learners with disability. Similarly, Gallavan and Kottler (2007) admit that the use of GOs enhances learners’ short-term memory and long-term achievement because they enable them to manipulate ideas and help them summarize concepts. Whereas, Tang (1992) admits that GOs “facilitate the acquisition of a second language” (p. 189), Jiang and Grabe (2007) remark that “a serious remaining concern is the lack of graphic organisers research with L2 students” (p. 46). This study provides data from the L2 perspective.
Method
Research Design
The current study employs a transversal study design carried out chiefly through observation and analysis of the data collected from a sample comprising 100 senior secondary school 4 students.
Participants
The research participants were 100 senior secondary students from four private secondary schools in Ife Central Local Government, Osun State, Nigeria. There were more than 100 students offering literature-in-English in the selected schools. However, for equal representation, 25 students were taken from each school on the following basis:
Five students who were adjudged to be in the “A” performance category;
Five students in the “B” category;
Five students in the “C” category;
Five students in the “D” category;
Five students in the “E/F” category.
This was done with the help of the principals and the teachers in the schools. All the participants spoke English as a second language and any of Yoruba, Igbo, Ijaw, and Hausa. Only about 12.6% of the students studying literature did so for the love of reading, the rest studied literature because it was a requisite subject in the course they wanted to read in the university. The project schools were grouped into two. Group 1 comprised two schools that used graphics in the teaching of literature-in-English (graphic-based schools [GBS]), while Group 2 consisted of two schools that did not use graphics in their teaching of literature-in-English (non-graphic-based schools [NGBS]). The project schools were not only government approved but were also West African Examinations Council (WAEC) approved. They all operated on the same literature curriculum. Although the schools did not have the same number of literature teachers, all the teachers were university graduates and had been teaching literature-in-English for more than 4 years before the research.
Instruments
Three main instruments were used during the study. The first instrument was a graphic observation checklist comprising seven graphic organizers (GOs); these were the Big Question Map, Circle Organizer, Discussion Map, Compare-Contrast Matrix, Venn Diagram, Cause and Effect, Story Map and Time Line (Alshatti, 2012). They were introduced to the literature teachers in the two GBS by the researchers. The researchers trained the teachers on how and when to use a particular GO for effective results. The second instrument constituted four unseen prose passages that were administered to the subjects to ascertain their key elements in literature-in-English prose texts. Two passages were used to design 15 objective questions for pretest, and the other two were used to design another 15 objective questions for posttest. They were used to ascertain the subjects’ understanding of the contents of the texts. All the four prose passages came from The Last Duty (Okpewho, 2010). This text was used because it was the recommended text for senior secondary school literature in Nigeria as at the time of the research. There were also four passages for reading comprehension, which were of the same readability level of the students. Two passages were used to design 15 objective questions for the pretest, and the other two passages were used for the design of another 15 objective questions for the posttest. All the passages were designed to ascertain their literal, inferential, critical, and creative reading skills. The third instrument was a structured classroom interaction observation schedule (see the appendix), which was a modified version of Onukaogu (1994) classroom interaction analysis schedule. This was used in coding the interactions in the classrooms for only prose literature-in-English.
Procedure
All the literature-in-English teachers in the GBS were trained by the researchers for a period of 3 weeks on
How to use the checklist to identify and use graphics in their literature-in-English lessons. After the training, their performances were evaluated by the researchers;
How to fill the sections of the structured classroom interaction observation schedule that were applicable to them.
The teachers in the GBS taught prose literature using GOs for two terms, a period that was equivalent to 8 months. The teachers in the NGBS taught the same aspect of literature without using any graphic organizer.
Two unseen prose passages (with 15 objective questions) and two comprehension passages (with 15 objective questions) were administered to all the students in the project schools (GBS and NGBS) before the treatment began. Administration of another set of 30 objective questions took place at the end of the second term in the form of posttest. The performance of the students in each of the tests was classified following Onukaogu’s (1994) criteria for ease of comparison:
1% to 39%. This reflects the performance of students who were considered to be below average in their test ability.
40% to 59%. This reflects the performance of the students who were considered to be just average in their test ability.
60% to 69%. This reflects the performance of students who were considered to be above average in their test ability.
70% to 100%. This reflects the performance of students who were considered excellent in their test ability.
The Pretests
Before the treatment, all the 100 participating students answered 30 objective questions from two unseen prose texts and two comprehension passages. The descriptive statistics of the results of the tests are presented in Table 1.
Participants’ Pretest Performance.
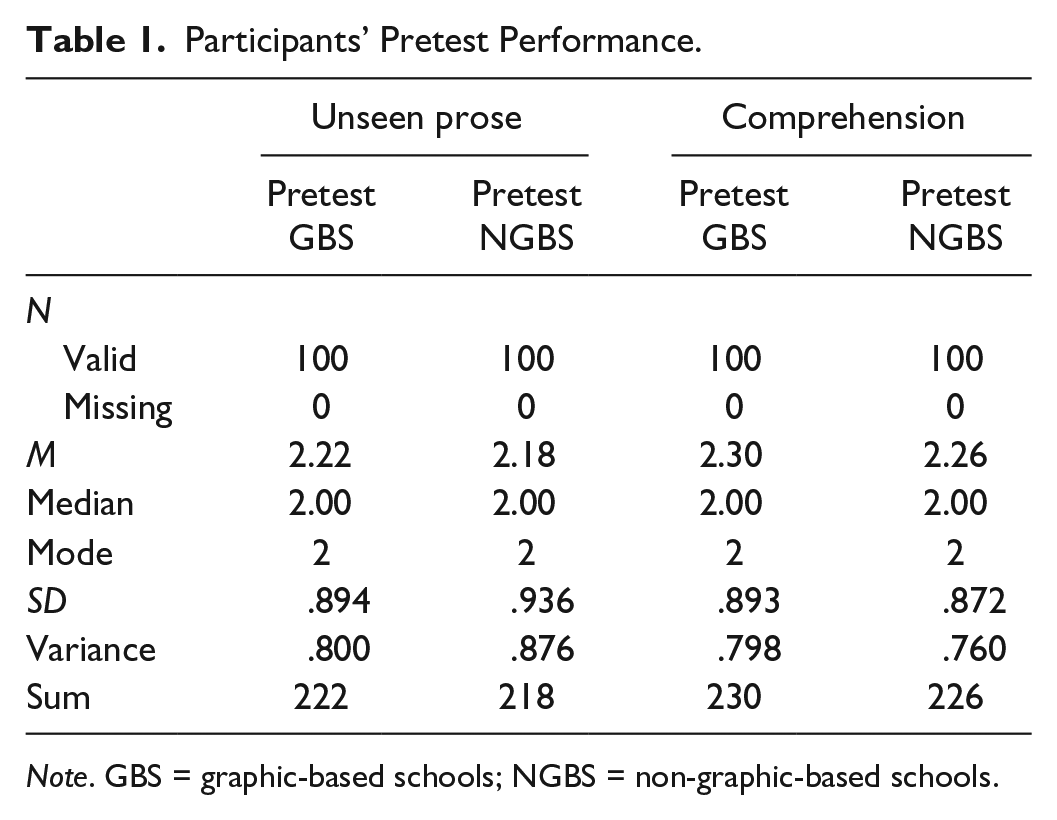
Note. GBS = graphic-based schools; NGBS = non-graphic-based schools.
These tests were administered to register participants’ degree of prose appreciation and comprehension capacity before being introduced to the GOs. The tests comprised 30 objective questions quintessential of the Senior Secondary School Certificate Examinations questions.
Treatment
All the participating schools had two literature-in-English teachers, one for senior secondary students and the other for the junior classes. The timetables from all the schools indicated that literature-in-English was taught twice a week. However, the days of the week and time of the day for the subject differed from school to school. All the subjects participated in tutorial classes on Fridays (in the evening) and Saturday (from 8:00 a.m. till 6:00 p.m.) in preparation for the Senior Secondary Certificate Examinations (roughly equivalent to General Certificate of Education [GCE]). Whereas the teachers in the NGBS taught their students in the traditional way, their counterparts in GBS employed different GOs in teaching literature-in-English. All the genres of literature were taught using GOs in GBS; the researchers recorded activities in prose classes only. They also used GOs in class discussions and in doing some of their homework assignments.
Posttests
Another set of 30 objective questions (from two unseen prose texts and two comprehension passages) were presented to all the participants in both GBS and NGBS. The results are presented and discussed in the “Results and Discussion” section below.
Data Analysis
Before subjecting the data to descriptive and inferential statistics, a frequency count of all the interactions was taken. Based on the overall interactions, single-sample t test analyses of the performance of all the students in the tests were computed. The analyses were carried out on a hypothesized means of 2.2 for the prose test, and 2.28 for the comprehension. These figures served as the test values for the comparisons of means. There was no relationship between the scores on the test variables, no outliers, and the size of the sample was moderate enough that a slight violation of normality might still yield accurate p values.
Results and Discussion
The means were compared in a single-sample t test. The test values were 2.2 and 2.28 for both the unseen prose and comprehension, respectively. The results are presented in Tables 5 and 6.
The range of performance of the subjects from the two groups of schools in the unseen prose test shows that, for the GBS, 2% of the subjects fall within the range of 1% to 39% in the test, whereas 22% represents the score from the NGBS. More students from the NGBS performed below average in the unseen prose test than those from the GBS. Again, 6% of the subjects from the GBS scored between 50% and 59% while the NGBS had 46% of their subjects in the same category. This shows that few students in the GBS performed averagely in the unseen prose test, unlike the subjects from the NGBS who had almost half of them in the same category. Furthermore, 7% from the GBS scored between 60% and 69% while in the NGBS 19% were in the same range. In this aspect, it is obvious that more subjects from the NGBS exhibited good performance in the unseen prose test as compared with those from the GBS. Finally, 85% of the GBS’ subjects fall between 70% and 100%, whereas 13% in the NGBS were within the same range. This indicates that a high number of subjects from the GBS performed excellently in the test, whereas a lesser number of students from the NGBS did so. In comparison, the non-graphic-based subjects were fairly spaced between the first three levels of performances with the least population in the very high performance category. This distinguishes the graphic-based students as very high achievers unlike the non-graphic-based students.
A similar trend played out in the performance of the two groups in the comprehension tests. The data show that for the GBS, 3% of the subjects fall within the range of 1% to 39% in the test and 19% from the nongraphic schools fall within the same range. This shows that more subjects from the NGBS performed poorly in the comprehension test than the GBS. Similarly, 13% of the subjects from the GBS scored between 50% and 59% while 47% of students in the NGBS were found in the same group. Here again, more subjects from the NGBS performed above average in the comprehension test than their colleagues from the GBS. Furthermore, 11% from the GBS scored between 60% and 69% while in the NGBS, 22% had the same score range. Here again, more subjects from the NGBS were found in this group than those from the GBS, that is, a higher percentage of the NGBS performed well in the comprehension test as compared with their counterparts from the GBS. However, 73% of the GBS’ subjects scored between 70% and 100%, whereas 12% from the NGBS scored within the same range. Just as what happened in the unseen prose tests, there was more number of students from the GBS who performed excellently in the test. From the data, it is clear that among the low grades, about the same number of participants from the two groups scored between 1% and 69%. However, the GBS had a higher number of subjects who performed excellently in the tests.
The finding, thus, shows that the GBS had less students in the low score level to average and good performance, with the majority in the very high performance category, whereas the NGBS had majority in the low to average and good performance, with very few in the very high performance category. This distinguishes students from the GBS as students with high level of comprehension ability, which can be attributed to the use of graphic organizers as a tool in their learning process.
The comparison of the mean performances of students from the GBS and the NGBS, displayed in Tables 1 and 4 above, clearly shows that subjects from the GBS had greater means in the posttests in both unseen prose and comprehension than in the pretests. Whereas, the results from the t test analysis indicate a p value of <.05 for the GBS in both unseen prose and comprehension, while that of the NGBS is >.05. With this t test result, the hypothesis that senior secondary school students in Nigeria who are taught with GOs in prose literature-in-English do not perform better in prose and comprehension tests than their counterparts who are not taught with GOs is, thus, rejected. Given that the introduction of GOs was the only new strategy exposed to the treatment group, this result would not have occurred had the GBS not been subjected to GOs. It is most probable that the subjects in NGBS performed the way they did because they failed to draw an association between their prior knowledge and the ideas in the tests they were reading. This finding is in consonance with the conclusion reached by Sam and Rajan (2013) that, when applied appropriately, GOs help to improve reading comprehension skills of ESL students. And it once again negates the conclusion by Griffin and Tulbert (1995) that studies on GOs have been inconclusive.
Comparing the Frequency of Subjects’ Performance in Unseen Prose Posttest.
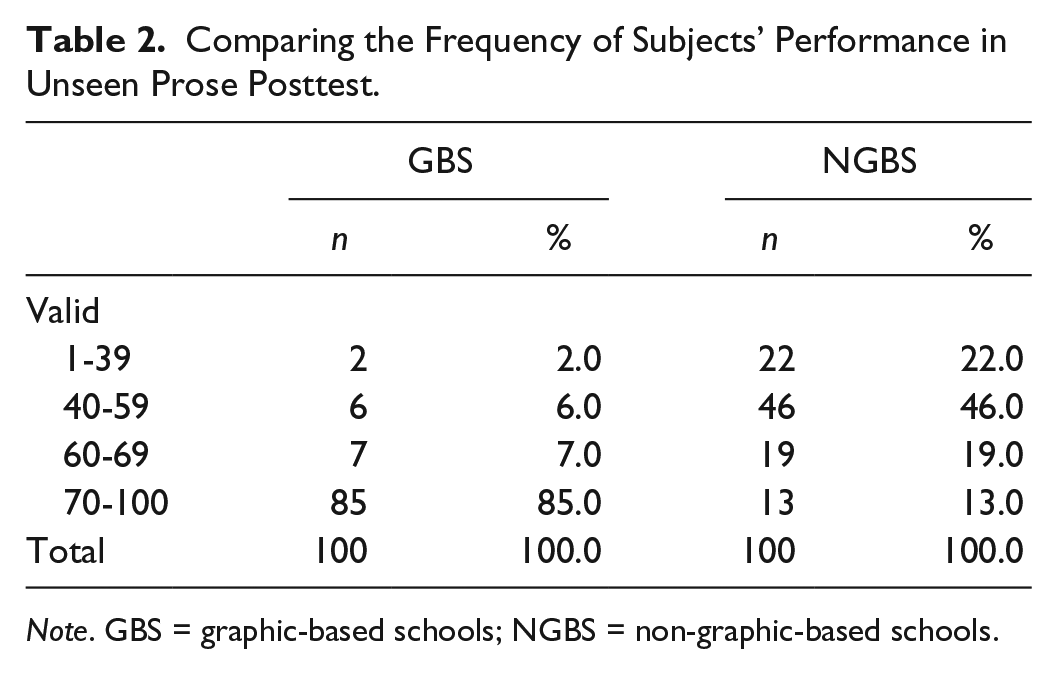
Note. GBS = graphic-based schools; NGBS = non-graphic-based schools.
Comparing the Frequency of Subjects’ Performance in Comprehension Posttest.

Note. GBS = graphic-based schools; NGBS = non-graphic-based schools.
Participants’ Posttest Performance in Both Prose and Comprehension Tests.

Note. GBS = graphic-based schools; NGBS = non-graphic-based schools.
Result of One-Sample Test for Unseen Prose.

Note. GBS = graphic-based schools; NGBS = non-graphic-based schools.
Result of One-Sample Test for Comprehension.

Note. GBS = graphic-based schools; NGBS = non-graphic-based schools.
Although it is established from the t tests that students from the GBS performed better than their counterparts from the NGBS in the unseen prose tests and comprehension tests, it is vital to understand that the use of graphics did not affect only on the subjects’ cognitive development. The use of graphics also influences other areas of learning processes, which cumulatively determine the overall success of students (Alshatti, 2012; Bellanca, 2007; Claggett, 1992; Dye, 2000). For example, from the results of the structured classroom interaction observation schedule, it was observed that graphic-based classes were more organic and interesting to learners than the non-graphic-based classes. Item 2 on the schedule (demonstrated learners’ attitude) indicated that students in the GBS were more cooperative, persistent, independent in reasoning, enthusiastic, and responsible to learning than the students in NGBS.
Similarly, Item 3 of the schedule clearly showed that the teachers in GBS were not assuming the traditional role of teacher-know-it-all; rather, they were able to shift most of the learning responsibilities to their students. They only provided guides to the learners, motivated and encouraged them, and praised them where necessary. On the contrary, it was observed that teachers in the NGBS maintained the status quo in the prose classroom: They commandeered the learning processes by doing all the talking and asking questions at the end of the class. Consequently, students in the GBS interacted with each other freely, worked in groups to provide solutions to problems, and applied literary principles to real-life issues. On the contrary, students in the NGBs maintained the monotony of silence typical of the traditional teaching method.
Again, as for the classroom atmosphere in the prose classes, it was discovered that in the GBS classrooms majority of the students demonstrated interest in the activities going on in the classroom and most of them actively participated in discussions that emanated from the texts studied. The classrooms were generally orderly and peaceful, which engendered a favorable learning climate for the students. On the contrary, the majority of the students in NGBS were frequently off tasks and apathetic to the instructor’s activities. This made the atmosphere in the classrooms too tense for any meaningful learning to take place.
However, interpersonal interactions with the participants revealed that the good performance of the students in GBS was not directly as a result of the teachers’ use of graphic organizers in the lessons, rather, the graphic organizers made the lessons more interesting and engaging for the learners, who, in turn, became more enthusiastic in the whole learning process. The fun aspects of the organizers made the students learn in a play-way approach, which invariably contributed to developing their interest in the classroom activities.
Lessons From the Pilot
Prior to the study, a 4-week preliminary session was carried out chiefly to evaluate the applicability of the research instruments. During the pilot, many things were revealed to the researchers, of which the following were the salient ones:
Two teachers only out of the 10 teachers of literature-in-English in the selected schools had heard of graphic organizers. Interestingly, these two thought that organizers were for children in stories.
All the teachers in the GBS claimed that the use of organizers made their teaching very easy and their lessons more interesting. They, however, complained that more time was spent in preparing and selecting concepts for the organizers.
Students in GBS were initially apprehensive of the first set of organizers introduced to them by the teachers. They began to relax after a thorough explanation of the organizers by their teachers.
The students’ interest was heightened at every new graphic organizer introduced to them.
Limitations/Recommendations
One important limitation of the current study is that all the subjects were drawn from the same local government area in southwest Nigeria. There is the need to expand the sample to include more subjects from other sections of the country. Second, the pretest and posttest questions were solely objective. The authors therefore recommend that further research be conducted with subjective assessment format. Again, the comprehension passages used in this study were descriptive; further studies should be conducted using expository passages, with unfamiliar complex concepts, vocabulary, and organizational structure.
Conclusion
The authors of this study are not, however, saying that GOs are the best methods in improving teaching and learning of prose literature in Nigeria; rather, their position is that incorporating GOs in schools will enhance the quality of literature instruction in Nigerian schools. What the GOs did for the students in the study was to make the teaching and learning experiences a reflective one. The students, from the classroom interaction observation analysis, became more interested in the literature classes as a result of the GOs’ interactive nature. Therefore, straightforward graphic organizers should be integrated into the curriculum. The findings of this study have left us with no better conclusion than to state that literature not only plays a significant role in language learning, but it also can be better taught and learned through the use of graphic organizers. The contributions of Moore and Readence (1984), Onukaogu (2012), Lovitt (1994), Alshatti (2012), and Sam and Rajan (2013) support this conclusion. Graphics act as a catalyst to comprehension of literary texts as they help to stimulate ESL learners’ interest in the texts. With the use of graphics in the classroom, the lesson becomes more interactive. Classroom interaction is known to helping learners to build confidence as they navigate and negotiate the learning process.
Footnotes
Appendix
Classroom Interaction Observation Schedule (Instrument)
SCHOOL——————————————————————————————
CLASS———————————————NUMBER OF STUDENTS——————
TIME OF THE DAY————————————
TEACHER——————————————-——
Instruction: Please TICK/FILL IN the ones that are appropriate to your class/lesson.
Acknowledgements
We thank Covenant University, Ota, for funding the publication of this research. We also sincerely thank the management, staff and students of Henry-Alex Duduyemi Memorial College, Saint David Grammar School, Urban Day Grammar School, and Seventh Day Adventist Secondary School, all in Ife Central, Osun State, Nigeria, for making this investigation possible.
Declaration of Conflicting Interests
The author(s) declared no potential conflicts of interest with respect to the research, authorship, and/or publication of this article.
Funding
The author(s) disclosed receipt of the following financial support for the research, authorship, and/or publication of this article: The author(s) received financial support, in the form of publication fee payment, from Covenant University, Ota, Ogun State, Nigeria for the publication of this article.