
Abstract
The Small Business Innovation Research (SBIR) program conducted by the Japanese government is intended to enable the rapid growth of small firms. Using comprehensive empirical data, this study examines the performances of firms that are directly affected by the program. First, to provide an outline, this study compares the changes in sales, employment, and the number of patents between SBIR awardees and matched firms. It cannot be shown that SBIR awardees have better performance using those indices. Second, this study conducts regression analyses to control for firm sizes, multiple awards, technological levels, the value of venture capital in a region, and population in regions. As a result, this study does not find that SBIR awardees have advantages after applying these detailed controls. This study shows that further detailed investigation is required to prove the benefit of the SBIR program.
Introduction
Japan is suffering from a serious long-term recession that began in 1991, and the Japanese government has sought, by various means, to solve the problem. One approach has been to subsidize small, high-technology firms, which are now considered to play important roles in stimulating economies throughout the world (Organisation for Economic Co-Operation and Development, 2010) because fast-growing small firms create new markets and jobs (Phillips & Kirchhoff, 1989).
Lerner (1999) said, “at least two sets of rationales for governments to offer subsidies to small high-technology firms.” (p. 286) First, the social benefits exceed the private benefits for firms’ expenditures on research and development (R&D; Griliches, 1992). This is also known as a spillover effect or a positive externality. Second, private investors tap into the information that subsidized companies are authorized for investment in the sense of promising technology. This can be understood as an information gap between firms and investors (Myers & Majluf, 1984).
The Small Business Innovation Research (SBIR) program launched in the United States in 1982 has played an important role in subsidizing businesses, providing 2 billion dollars to U.S. companies every year. The program (currently) requires 11 federal agencies to set aside 2.9% of their extramural R&D funds for the program. The program consists of three phases, and only winners can proceed to the next phase. This program is one of the largest innovation programs in the United States (Wessner, 2008). Inspired by the U.S. program, Japan launched its own SBIR program in 1999.
The cost-effectiveness of all policies should be monitored, but this is a difficult task for most policies because the effect spreads into society, making the measurement complex. The direct effects of policies have been widely studied. Lerner (1999) studied firms that won awards from the U.S. SBIR program and demonstrated that the firms grew significantly faster in comparison with other matched firms, and they attracted venture financing. Eshima (2003) analyzed the Japanese SBIR program by comparing SBIR awardees and firms matched with the awardees by using averages. However, this study conducts regression analyses that allow us to control for other effects using comprehensive data.
The objective of this article is to assess the direct effect of Japan’s SBIR program. This study utilizes comprehensive empirical data and conducts overall comparisons of statistics and regression analyses to control samples for the effects of various factors in the samples. Specifically, this study assesses the firms that received awards from the SBIR program from 2006 to 2010. Overall, this study compares awardees and matched firms selected to closely resemble the awardees. Comparisons are made in terms of sales, employment, and the number of patents. These variables are chosen to see the direct growth triggered by the SBIR program. Other variables may be affected by the SBIR program (shown in “Literature Review” section), but they show indirect effects of the program. In the regression analyses, this study controls for variables such as size, multiple awards, technological levels, the value of venture capital in regions, and population in regions.
This study makes three contributions to the literature. First, this is the first study to analyze the impact of the Japanese SBIR program using regression models with considerably a sizable dataset. Second, as the Japanese SBIR does not have an explicit system to prompt technology transfer from universities to small businesses as emphasized by the U.S. SBIR program, this study can illustrate how the Japanese program works as an SBIR program variant. Third, although mainly the growth of sales and employment of SBIR awardees have been analyzed in the past literature, this study is thought to be the first to check the growth of patent applications.
This article is organized as follows. A “Literature Review” section explains the literature review. A brief explanation of the SBIR program is given in “SBIR Programs” section. “Data” section explains how this study constructs the data used in the analyses. “Analyses” section discusses the analyses. Finally, “Conclusion” section concludes the article.
Literature Review
Regarding the benefits of the SBIR program, there have been several empirical analyses. This study mainly follows Lerner’s (1999) seminal work analyzing the growth of U.S. SBIR program awardees’ sales and employment. The study was extended to incorporate intellectual property and market creation (Link & Scott, 2012). To clearly discuss the causal relationship between SBIR awards and R&D expenditure, Wallsten (2000) used a multi-equation model. Moreover, Link and Scott (2010) investigated the probability that SBIR awardees were successful in commercialization. In addition, Qian and Haynes (2014) showed that the SBIR program is effective in the sense of promoting not only innovation but also entrepreneurship. Although the study of the present article investigates the direct growth triggered by an SBIR program and uses variables such as the change in sales and employment and the number of patents, these precedent studies give different aspects that can be affected by an SBIR program. These studies are revisited when the results of this study are discussed.
Regression analyses normally have endogeneity problems. This study also has an endogeneity problem: Firms may change their behaviors because of the SBIR program. In fact, Archibald and Finifter (2003) revealed that firms shift their projects to commercialization and reduce basic research activities. In addition, though that study is a case study with small sample, it shows that researchers around SBIR winners also shift their activity toward commercialization. Moreover, Audretsch, Weigand, and Weigand (2000) showed that past SBIR winners consider commercialization more eagerly than before but do not consider applying for SBIR awards again. These behavioral changes may be attributed to the success of the U.S. SBIR program. On the contrary, the success of the Japanese SBIR program is not comparable with that of the U.S. program. Therefore, it would be acceptable to bypass the endogeneity problem.
SBIR programs and many other innovation policies in the world aim to transfer knowledge from universities to the private sector, and the benefits of these transfers have been discussed. Siegel and Wessner (2012) showed that firms with strong relationships with universities are successful in the SBIR program using regression analyses. In addition, Meyer (2003) exemplified that innovation policies are not necessarily beneficial for academic entrepreneurship but rather for the development of behaviors through which scientists consider other options to pursue their research interests. As is explained in “SBIR Programs” section, the Japanese SBIR program does not have an explicit system to promote knowledge transfer from universities to firms. Therefore, the above studies can be useful to discuss reform of the Japanese SBIR program. A discussion is given in “Analyses” section.
SBIR Programs
U.S. SBIR Program
The U.S. Congress enacted the SBIR Development Act in 1982 and established the SBIR program, which mandated that all federal agencies that spend more than US$100 million set aside 0.2% of their funds for the program. Over the next 6 years, the share of funds set aside grew to 1.25%. This act was reauthorized in 1992 as the Small Business Research and Development Enhancement Act. At that time, the set-aside rate was doubled to 2.5% (Wessner, 2008). Congress passed numerous extensions, the most recent of which extended the act through 2017. The share of current funds to be set aside was set to 2.9%. The set-aside rate will gradually increase every year, which means that the United States considers the SBIR program successful.
Eleven federal agencies have been participating in the program, and they have individual responsibility for the program. These agencies have offered subsidies in accordance with the guidelines established by the SBIR program.
A document published by the Small Business Administration (Office of Investment and Innovation, Small Business Administration, 2012) provides directives for agencies to carry out the SBIR program. Based on the document, a simple explanation of the process for the program can be described as follows. The SBIR program has three phases.
Phase I
This phase is intended to assess the technical advantages, feasibility, commercial potential, and quality of awardee performance prior to receiving support in Phase II. Phase I awards do not typically exceed US$150,000 in total costs for 6 months.
Phase II
The main objective of this phase is to continue and enhance the R&D efforts initiated in Phase I. Only Phase I awardees are eligible for a Phase II award. Phase II awards do not typically exceed US$1,000,000 in total costs over 2 years.
Phase III
This phase, where appropriate, is intended to help small businesses pursue commercialization objectives resulting from Phase II activities. The SBIR program does not fund Phase III. Federal agencies promote the introduction of private investment or provide awardees with production contracts, such as agency procurements, for products.
Eligibility for the SBIR program is mainly assessed as follows. The firm (a) is independently owned, and at least 51% is held by U.S. citizens; (b) has no more than 500 employees, including affiliates; and (c) is organized for profit and located in the United States.
The achievements of the SBIR program are admirable. The SBIR program assessment conducted in 2008 (Wessner, 2008) found that it was effective mainly in three areas: (a) stimulating technological innovation, (b) increasing private sector commercialization of innovations, and (c) providing widely distributed support for innovation activities.
Japan’s SBIR Program
Japan has been in a serious long-term recession since 1991. The Ministry of International Trade and Industry enacted a law in 1999 to facilitate the creation of new businesses that included Japan’s SBIR program in an effort to end the recession and create more employment opportunities. Apparently, Japan considered the U.S. SBIR program to be successful. Then, the Ministry of Economy, Trade and Industry passed an act in 2005 to facilitate new business activities by small and medium-sized enterprises that retained the SBIR program in Japan.
Although the Japanese program was naturally quite similar to its U.S. counterpart, there were three notable differences.
Awards from most ministries and agencies do not have phase systems. Only approximately 5% of awards have phase systems, and these began in 2007.
Ministries and agencies only support awardees using their own budget. However, the U.S. program helps awardees access private investment and government procurement processes.
The budget is much smaller. The ratio ranges from one fifth to one half of the U.S. program, depending on the year considered.
In addition, as of October 2016, the benefits that SBIR winners can receive are shown on the Japanese SBIR program’s webpage. It says that winners can receive (a) loans with low interest rate, (b) more opportunities to submit bids for government procurement, (c) fees exemptions for steps such as patent registration, and (d) tax breaks.
There is a conceptual difference in the SBIR programs in Japan and the United States. The latter has an emphasis on technology transfer from universities to firms. On the contrary, as shown in the above explanation, technology transfer is not explicitly supported. Therefore, for the analyses of this study, the Japanese program can be considered a variant of the U.S. program.
Note that Japan has other initiatives supporting small high-technology businesses. For example, the New Energy and Industrial Technology Development Organization has a number of its own initiatives in addition to the SBIR program. This article only discusses the SBIR program and its effects and naturally does not cover all initiatives for small high-technology businesses.
Data
The primary data consist of SBIR awardees published by the Small and Medium Enterprise Agency. Table 1 provides summary statistics for the data. The data include 1,640 SBIR awardee firms from 1998 to 2010. There are 507 awardees from 2004 to 2006. Individuals can win awards in Japan, unlike the SBIR program in the United States. This study omits individuals because they are not appropriate for the analyses. Firms are matched using data from Teikoku Data Bank (TDB), which has one of the most comprehensive datasets on firms in Japan. Ultimately, this study includes 301 awardee firms from 2004 to 2006. This period is chosen to observe the growth of awardees after 2006.
Number of Observations in the Data.
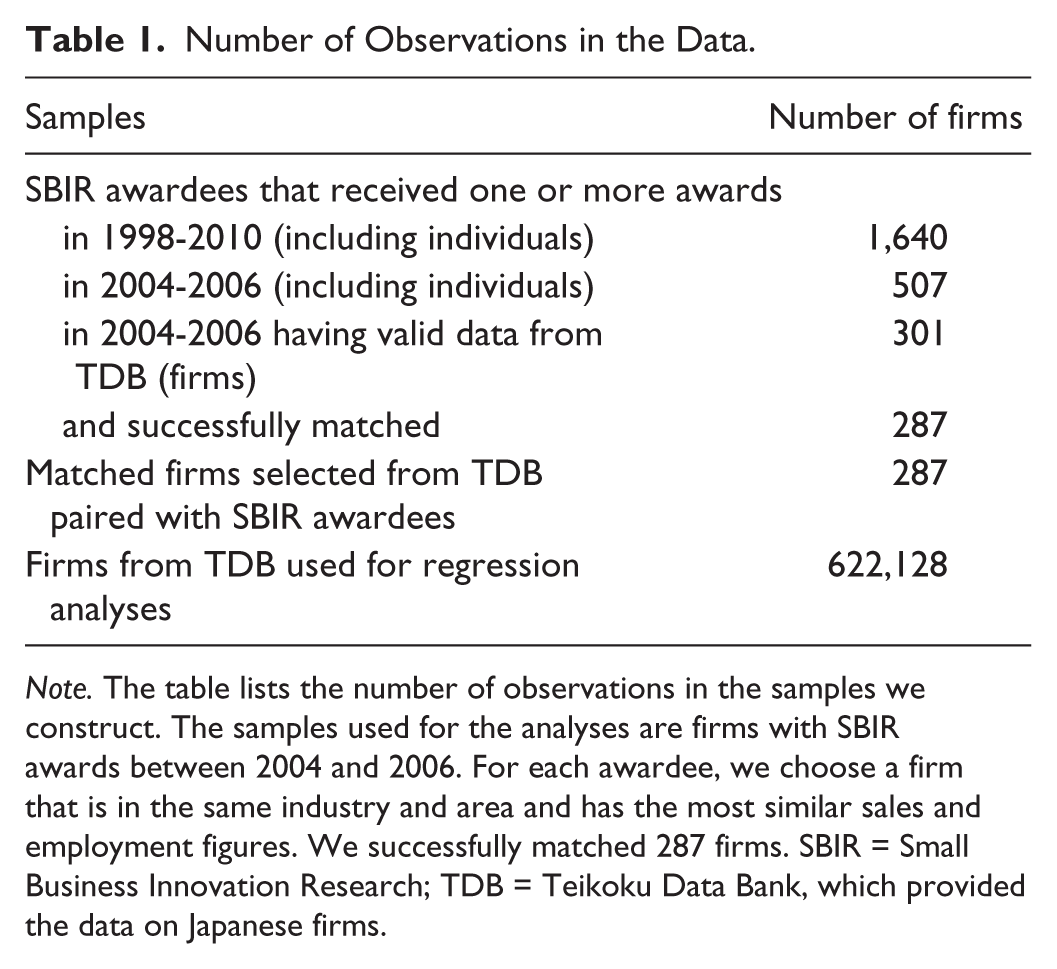
Note. The table lists the number of observations in the samples we construct. The samples used for the analyses are firms with SBIR awards between 2004 and 2006. For each awardee, we choose a firm that is in the same industry and area and has the most similar sales and employment figures. We successfully matched 287 firms. SBIR = Small Business Innovation Research; TDB = Teikoku Data Bank, which provided the data on Japanese firms.
Next, matching sets are constructed to compare averages. Matched firms closely resembled awardees in terms of their sales, employment, area, and industry. Based on zip codes, 100 areas are identified. The industries are classified according to the Japan Standard Industrial Classification (JSIC; Ministry of Internal Affairs and Communications, 2013), and this study uses the group level, which has 530 industrial classifications. There are 301 SBIR awardees that could be matched with other firms in the same area and industry. Matching involves finding the most similar firms to the awardees with respect to sales and employment. Here, there are two variables, sales and employment, which are numeric. Therefore, this study uses the following equation to calculate the distance dki between an awardee (k) and a firm (i) (in the same area and industry).

where n_sales or n_employment are standard scores, and thus,

where X is sales or employment,
The matching results are summarized in Table 2. The SBIR awardees have higher sales and employment in 2006 than do matched firms. Note that, as this study compares the growth of awardees and matched firms after 2006, this table shows data for 2006. It was expected that matching would pair firms with similar sales and employment numbers to the awardees. However, this result means that comparatively large firms in each area and industry were chosen as SBIR awardees.
Matching Results of SBIR Awardees and Matched Firms.

Note. Sales and employment in 2006 and the number of patents in the period from 2004 to 2006 are listed. Sales are in millions of yen. SBIR = Small Business Innovation Research.
Note that SBIR awardees were chosen from among small firms following the government’s definition, according to which the firm has fewer than 300 employees in manufacturing and less in other industries. However, the matched firms are not limited to small firms. Nevertheless, the awardees are still larger than the matched firms. This means that the SBIR awardees are not small firms, which does not correspond to the expectations formed based on the purpose of the SBIR program.
The data provided by the Institute of Intellectual Property (Goto & Motohashi, 2007) include registered patent information that can be used to analyze the innovation capabilities of the awardees and the matched firms. However, the number of patents is not considered in the matching process because many firms did not apply for patents, at least in the given period (from 2004 to 2006). The listing of the number of patents in Table 2 classifies such firms as having zero patents. The awardees have larger values of this measure than do the matched firms.
Note that Lerner (1999) used 541 SBIR awardees in his U.S. study not only for comparisons with respect to the average sales and employment but also for regression analyses. Generally, many observations make regression analyses significant. He seems to have used a small sample for his regression analyses because of the limited computing power available at the time. The number of firms used for regression analyses in this study is 622,128. Furthermore, this study includes other sources of data for the value of venture capital in an area (Venture Enterprise Center, 2010) and its population.
Analyses
Overall Comparison
This section first presents the overall comparison of the change experienced by the awardees and the matched firms. The results from the regression analyses will be shown later.
Table 3 lists the results of the overall comparison. Panel A shows the change in sales from 2006 to 2011. It can be seen that the matched firms have higher means and medians, although the SBIR awardees were expected to have higher means or medians than the matched firms. The t tests and Mann–Whitney tests are used to validate the results. At the 5% significance level, the t test indicates significance, whereas the Mann–Whitney test does not. The 5% significance level will also be used in the following analyses.
Changes for SBIR Awardees and Matched Firms.

Note. We report changes in sales, employment, and the number of patents. Sales are in millions of yen. There are 287 observations for both SBIR awardees and matching firms. SBIR = Small Business Innovation Research.
Panel B shows the change in employment. Here, the SBIR awardees show inferior performance to the matched firms in terms of employment, though the t test and the Mann–Whitney test do not indicate significance.
As is mentioned in “Introduction” section, Eshima (2003) conducted the same overall analyses in Japan and reported that SBIR awardees achieved positive results in sales and employment, which is different from the results of this study. His work is important because it represents the first attempt at SBIR program analysis in Japan. It is presumed that the difference comes from the matching strategy. That article considers the founding year, industry, and employment.
Panel C reports the change in the number of patents for the periods between 2004 to 2006 and 2007 to 2009. The panel shows that the awardees and matched firms have negative values. This is mainly because Japanese firms reduced R&D spending because of the recession. The matched firms are superior to the SBIR awardees, and the difference is supported by the t test and Mann–Whitney test. As the government expects the SBIR program to support innovative small firms, it could be expected that awardees have more inventions. Although intellectual property cannot be considered a direct measure of growth, it seems difficult for new-technology based small firms to grow without intellectual property to contribute to the national economy.
Although the changes in the specific years are presented in Table 3, there is no strong rationale for the years. The years are 2006 and 2011 for sales and employment, and the duration is from 2004 to 2006 and from 2007 to 2009 for patents. As a robustness check, different data are obtained by shifting each year by an additional year, and it is confirmed that the conclusion based on Table 3 is sustained. The table with these different data is available upon request.
From the perspective of the direct effect of the awards, the results of the overall comparison are not favorable. Lerner obtained different overall results for the U.S. SBIR program, which were significantly positive.
Performing a proper comparison across two different countries or societies is always difficult. In addition, there are considerable differences between Japan and the United States, as Lerner repeatedly emphasized, concerning the function of private investments, which are almost equal to venture capital. He performed a detailed analysis of the effect of private investments and found that the success of awardees was dependent on their ability to attract venture capital.
Venture capital under management in the United States was worth 267 billion dollars in 2012 (National Venture Capital Association, 2013). However, the corresponding figure for Japan was approximately 1 billion dollars (100 billion yen) in 2012 (Venture Enterprise Center, 2013). (It is assumed that 1 U.S. dollar is equal to 100 Japanese yen.) The relative size of Japanese venture capital is 0.0037, which means that Japan and the United States do not have comparable amounts of venture capital. In this context, small firms rely primarily on loans from banks or public agencies. This situation differs from that of the SBIR program in the United States, and it can be likened to a rocket without a fuel tank. Furthermore, as Panel C of Table 3 indicates, the Japanese SBIR program has had difficulty stimulating the creation of intellectual property.
It should also be noted here that commercialization assistance, which is the most important part of the program, seems to be lacking in Japan. The SBIR program in the United States methodically supports the commercialization of seed projects created by the program (Wessner, 2008). Such support includes a committee made up of researchers at universities and national institutes and individuals who were finance professionals. It would be acceptable to say that similar support is less available from the Japanese government than from the U.S. government. Although commercialization is the most difficult part of R&D, it seems that the Japanese government requires a solution to commercialization.
The above explanation may be the reason why the Japanese SBIR program is not as successful as its U.S. counterpart, but it does not directly answer the question of why the Japanese SBIR awardees are not superior to the Japanese matched firms. This issue requires further consideration. One hypothesis is that firms are chosen not because they contribute to innovations but because they have many employees. This means that the firms can survive longer by using the grants. This inference is corroborated by the matching results presented in Table 2. SBIR awardees are relatively large firms, not small firms.
Regression Analysis
The matching process considered sales, employment, area, and industry. However, introducing additional firm attributes enables us to control for these attributes in detail and to identify the conditions under which SBIR awardees succeed. Regression analysis meets this requirement.
Table 4 lists the variables used in the regression analyses. Most of them were also used in the previous analyses. The dependent variable is the change in sales, employment, or patents. The independent variables are any SBIR award or multiple SBIR awards. The other variables are controls.
Variables Used in Regression Analyses.

Note. SBIR = Small Business Innovation Research; JSIC = Japan Standard Industrial Classification; NA = Not Applicable.
Table 5 examines change in sales, employment, and patents. The independent variable is any SBIR award. The control variables are 2006 sales, 2006 employment, and prior patents. This examination is performed via ordinary least squares; namely,

Ordinary Least Squares Regressions With Changes in Sales, Employment, and Patents as Dependent Variables.
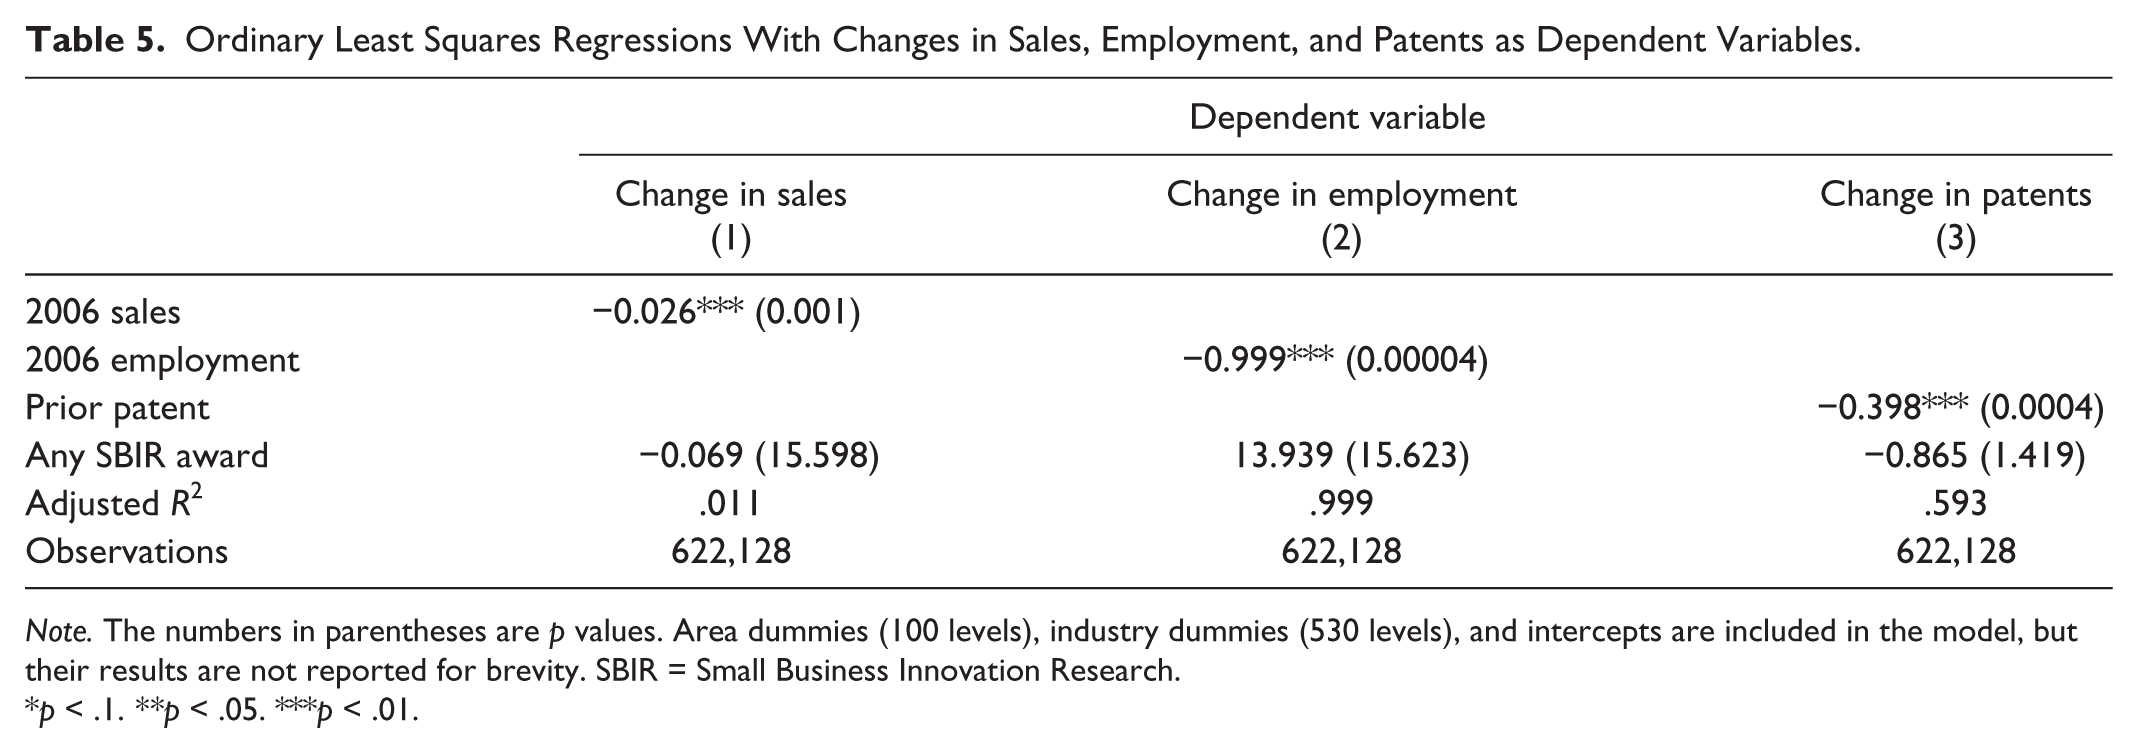
Note. The numbers in parentheses are p values. Area dummies (100 levels), industry dummies (530 levels), and intercepts are included in the model, but their results are not reported for brevity. SBIR = Small Business Innovation Research.
p < .1. **p < .05. ***p < .01.
The results indicate that the any SBIR award term is not significant. This means that it seems difficult to identify the advantage of obtaining SBIR awards after controlling for sales, employment, number of patents, and other control variables (area, industry, and intercept).
It is possible that the failure to observe advantages enjoyed by SBIR awardees is due to the absence of a number of SBIR awards or other control variables. Therefore, this study includes a variable for multiple SBIR awards and another variable to control for the effects of high-technology industries. If the amount of money awarded affects the propensity of the awardees to grow, then the multiple SBIR awards term should exhibit significance. Controlling for high-technology industry membership is also important because such industries generally have more potential for substantial growth than do low-technology industries. The high-technology dummy is set to 1 when the industry is categorized as high technology and 0 otherwise. This study employs the division of industries proposed by Okamuro (2006). The difference can be controlled for by adding the variables. Table 6 examines the change in sales with the above-described independent and control variables. The results indicate that the multiple SBIR awards variable is not significant. This means that the monetary volume is not associated with the success of the SBIR awardees. Furthermore, the results are not affected by the inclusion of the high-technology term or the interaction term between any SBIR award and high technology. Technological levels do not contribute to the success of the SBIR awardees. Therefore, the analyses do not indicate that the SBIR awardees have advantages.
Ordinary Least Squares Regressions With Multiple SBIR Awards and High-Technology Status as Control Variables.

Note. The numbers in parentheses are p values. Area dummies (100 levels), industry dummies (428 levels), and intercepts are included in the model, but their results are not reported for brevity. SBIR = Small Business Innovation Research.
p < .1. **p < .05. ***p < .01.
The final analyses consider the change in sales with the value of venture capital and population as controls. Table 7 reports the results. The dependent variable is change in sales. The independent variable is any SBIR award. The control variables are value of venture capital and population. Interaction terms of these variables are also included. As noted above, attracting venture capital is important for awardees. Population, moreover, is important to include to determine the effect of being in a city or the effect of aggregation. Firms in cities have advantages in accessing technological information and suppliers. The results for the SBIR dummy variable and the interaction terms are not significant. Therefore, the awardees do not have better or worse performance than do other companies after controlling for the value of venture capital and population in an area.
Ordinary Least Squares Regressions With the Value of Venture Capital and Population.

Note. The numbers in parentheses are p values. Area dummies (100 levels), industry dummies (428 levels), and intercepts are included in the model, but their results are not reported for brevity. In addition, the area dummies are not included in the population analyses to avoid multicollinearity. SBIR = Small Business Innovation Research.
p < .1. **p < .05. ***p < .01.
It should be noted that no positive significance for the SBIR award term was noted in analyses using simultaneous equation models, especially for employment growth (Wallsten, 2000). Specifically, firms with large employment win SBIR awards, but SBIR awards do not increase the employment of SBIR awardees. Therefore, the conclusion is different from that of the past study (Lerner, 1999). On the contrary, it is also noted that, on average, employment growth is not observed; however, if SBIR awardees have intellectual property or government support to create a market, then employment growth is observed (Link & Scott, 2012). As there are many other viewpoints to be considered, further investigation is needed into the growth of Japanese SBIR awardees.
The regression analyses in this study aim to clarify which variables are significantly associated with growth. Therefore, the predictability of the models has not been discussed so far. Tables 5 to 7 show the adjusted R2 values. Overall, those values are small, as they are approximately .01. Similar values are observed in the past study (Lerner, 1999). However, the model for change in employment in Table 5 shows a large value (.999). As the p values for employment and industrial dummies are quite small, it seems that change in employment is mostly explained by these variables. Furthermore, change in patents in Table 5 is also relatively large. As prior patents and industrial dummies show quite small p values, the change in patents is mostly explained by these variables.
It could be said that the obtained results are not favorable because the SBIR awardees received grants but did not outperform other companies in regressions with various controls. As noted above, the U.S. SBIR program exhibited completely different and positive results (Lerner, 1999; Link & Scott, 2012). Therefore, the Japanese program obviously requires assessment.
Comparing policies across countries is always difficult. The difficulty comes not only from collecting comparable data but also from building a model or a hypothesis that covers the differences in cultures and societies. Regarding the SBIR program and other innovation policies, there is an initiative to test hypotheses and verify national differences (Kropp & Zolin, 2005). Another initiative exists to qualitatively compare the extent of evaluation activities between the United States and the United Kingdom (Siegel, Wessner, Binks, & Lockett, 2003). However, it seems that the Japanese SBIR program does not have explicit mechanisms to transfer knowledge from universities to firms or to evaluate the efficacy of the program. Therefore, because of these differences, it is not easy to compare the Japanese program with programs conducted in other countries.
Moreover, there is another cultural difference. As the success of new-technology-based firms is uncertain and truly small firms are avoided by venture capitalists (Lerner & Kegler, 2000), the SBIR program in the United States exists to support these small firms. However, Japanese culture and society do not have tolerance for failures when spending funds. Therefore, the constraints in choosing firms in the Japanese SBIR program seem different from those faced by the United States. Furthermore, there is another difference in terms of advancement of universities. The United States has many prestigious universities, and the utilization of technological knowledge underlies the SBIR program. On the contrary, it is difficult to say that universities in Japan are comparable with those in the United States. Therefore, these differences should be considered in discussions of the SBIR programs and similar innovation programs.
To investigate the inner workings of the program, the authors discussed these results with government officials. They recognized that the program has problems and has not been effective and would need to be revised to preserve its reputations. Officials are confronted with a problem that is difficult to solve. Administrative segmentation is a key to understanding this problem. Ministries and agencies cannot request that other bodies revise administrative decisions. The U.S. program has a well-organized system for selecting awardees that includes scientific advisors who are familiar with scientific and publicly important problems and can properly assign candidates’ applications to scientific experts, such as college professors, for review. By contrast, the Japanese ministries and agencies in science, economy, transportation, agriculture, health and welfare, and defense have their own realms, and scientific advisors cannot freely choose agendas without considering official bodies’ administrative realms. Furthermore, the Ministry of Economy, Trade and Industry cannot ask other agencies to set aside portions of their budgets for the program because of administrative segmentation. Currently, the ministry is funding the program with its own budget.
Additional points to be reviewed might include incorporation of a system to transfer technological knowledge to firms. As mentioned in “SBIR Programs” section, programs in the United States are founded on this concept. Another issue might be monitoring and oversight because a firm with a grant has an incentive to squander the grant (Lerner & Kegler, 2000) or to replace firm funds for R&D expenditures with grant funds (Wallsten, 2000).
Conclusion
This study examined the direct effects of the SBIR program in Japan using firms’ attributes. First, this study compared changes in sales, employment, and number of patents between SBIR awardees and matched firms. The SBIR awardees did not perform better in sales, employment, or patents. Therefore, it appears that the SBIR program has not had positive effects. Next, this study examined the SBIR program using regression models. After controlling for the effects of the award amounts, technological advancement, venture capital investment in an area, and area population, this study did not observe that the awardees were at an advantage.
While the Japanese economy formerly grew on the basis of manufactured goods, such as cars or electronics, it has experienced a long recession in recent years. The cause of the recession appears to be largely attributable to the country’s industrial structure. Japan must transition from labor-intensive industries to knowledge-intensive industries. Therefore, Japan has a particular need to encourage the growth of small, innovative firms, and the SBIR program could be a good measure for this task.
Footnotes
Declaration of Conflicting Interests
The author(s) declared no potential conflicts of interest with respect to the research, authorship, and/or publication of this article.
Funding
The author(s) disclosed receipt of the following financial support for the research and/or authorship of this article: This work was supported by a MEXT-supported Program for the Strategic Research Foundation at Private Universities, 2009-2013. The authors received further support from JSPS KAKENHI Grant Number 15K03656.