
Abstract
Thailand’s One Tambon One Product (OTOP) branded handicraft and food export program is expected in 2016 to reach nearly US$3 billion, with products coming from approximately 6,000, five-star-ranked community-based and small–medium enterprises countrywide. This study therefore examined influences of perceived quality, perceived price, trust, and satisfaction on enterprise export performance using the OTOP product brand. Structural equation modeling used LISREL Version 9.1 to conduct a confirmatory factor analysis and test the hypothesized interrelationships on the variables’ effect on export performance. The vast majority of the entrepreneurs selected by simple random sampling either owned or worked in groups that had 50 or fewer employees, which represented 472 of the survey’s 500 respondents, or 94.4%. Additional results indicated a high and positive correlation between perceived quality, perceived price, trust and satisfaction, and export performance, with the most significant factor affecting export performance being customer satisfaction. In addition, perceived quality also has a positive and direct effect on trust as well as on the exporter’s customer satisfaction. Perceived price plays a role as well and has a direct and positive impact on both customer satisfaction and a customer’s trust of the exporter. Perceived quality also affects export performance in a direct and positive way with trust having a direct and positive impact on satisfaction.
A key strategy of the Thai government has been to help “grass roots” level, community-based enterprises (CBEs) promote their home-grown agricultural and handicraft products into larger, export-focused, small–medium enterprises (SMEs; Foreign Office, Office of the Prime Minister, 2016). These present-day Thai policies and programs are, however, rooted to a much earlier, 1979 Japanese program called “One Village One Product” (OVOP), which was started in Japan’s poorest prefecture (Oita) by Governor Morihiko Hiramatsu which stressed the importance for locals to lessen their dependence on government subsidies as well as help with retaining youth and improving the quality of life (Prayukvong, 2007; Thu, 2013). Governor Hiramatsu’s motto was “Think globally, act locally” (Prayukvong, 2007; Ramon Magsaysay Award Foundation, 2016). Even the United Nations Industrial Development Organization (UNIDO) in 2008 released a report committing itself to rural development and poverty reduction in Africa using a OVOP-type project style (Haraguchi, 2008), whereas other developing nations around the world have adopted Governor Hiramatsu’s vision.
The emergence of the Asian financial crisis in mid-1997 redirected many Asian governments to strengthen their SMEs (Moha-Asri, 2002), with Thailand adopting Japan’s OVOP concept and implementing it in 2001 with a “twist,” which in this case reversed the Japanese focus from bottom-up initiatives to a Thai government–managed, top-down driven scheme (Thu, 2013). Being relabeled in Thailand as “One Tambon One Product” or OTOP (Kurokawa, 2009), the Thai word “Tambon” is translated into English as “subdistrict,” which is the third smallest administrative unit below district and province in Thailand. Numbering 7,256 tambons throughout Thailand (Hörstemeier, 2013), the program exploded after its inception, growing from a little more than US$7 million in 2001 to US$2.24 billion in 2008 (Figure 1), with officials projecting nearly US$3 billion in 2016 (Changsorn, 2015).

Thailand’s OTOP program “early years” from 2001 to 2008.
With the OTOP program’s explosive growth after its inception (Figure 1), global confirmation of its importance came as early as 2003 when in the 20-nation Asia-Pacific Economic Cooperation (APEC) Ministerial SME Meeting held in Chiang Mai, Thailand, a ministerial statement was issued proclaiming that Thailand’s OTOP promotion “is a good model that could have application in developing an entrepreneurial society, especially in local areas.”
During this period, it was the Thai Department of Rural Community Development that was the coordinating office to select the champion product at all administrative levels with the selection criteria focused on (a) export potential, (b) maintaining quality production, (c) high production standards which contributed to product quality and customer satisfaction, and (d) the product’s history (Prayukvong, 2007). In addition, a rating system of one to five stars was implemented with five stars necessary for export potential.
The government plays a supporting role as well, assisting in supply chain issues, consultation with enterprise entrepreneurs, networking, and opening up new markets for the OTOP products, which in 2016 has included 10 selected OTOP products being sold on the national flag airline Thai Airways with 128 OTOP products available through their in-flight catalog (“Government cooperates with Thai,” 2016). In addition, OTOP shops are being established in each of two national gas stations (PTT) in each province with OTOP fairs and booths common throughout Thailand.
The basic idea of the OTOP scheme is to have each Tambon (subdistrict) concentrate on one certain type of product which is best suited for production in each subdistrict. Presently, approximately 40% of the Thai OTOP enterprises are engaging in food processing and handicraft production, with a heavy concentration of the enterprises in Thailand’s Northern provinces. Three product categories have recently been identified as export rising stars, which includes processed foods and beverages, utensils, decorative items and souvenirs, and cloth, apparel, and accessories (Changsorn, 2015).
In research reported in 2015 from the Thailand Productivity Institute, it was indicated that there were approximately 70,000 OTOP enterprises registered countrywide (Changsorn, 2015), and according to the Thai Interior Ministry’s Community Development Department, 10,000 of these have been granted a “five-star” rating. It is the “five-star” rating that qualifies the enterprise to export, and in 2015, 5,687 exporters were generating more than 100 billion THB (US$2.88 billion) yearly in foreign revenue for Thailand (Changsorn, 2015).
Although the terms CBE, SME, and OTOP might at first appear to be interchangeable, they are not. To make the nomenclature even more confusing, in Thailand’s bordering neighbor of Malaysia, SMEs are often referred to as “microenterprises” by scholars (Tock & Baharun, 2013).
Many CBEs and entrepreneurs have aspirations to become SMEs, and one mechanism to achieve this is to market their products under the Thai government product branding of “OTOP.” The brand personifies the perceived value (Tock & Baharun, 2013), and by becoming an OTOP branded product, many doors to foreign markets can open, which is currently growing at nearly 2% per year (“Know global-build local fair,” 2015; Mass Communication Organization of Thailand [MCOT], 2013). This is also supplemented by a large domestic market which has also been growing at a constant annual rate of 13% over the past several years (Changsorn, 2015).
Thailand for many years has focused on the development and the sustainability of the rural regions and citizens, which became official government policy with the release of the Eighth National Economic and Social Development Plan (1997-2001) which included the King of Thailand’s “Theory of Economic Self-Sufficiency” (Prayukvong, 2007). In addition, community-based development can revitalize community solidarity (Suindramedhi, 2016).
Recently, a new program called “From Hundred to Million” has also been conceived which is designed to help stimulate young entrepreneurs’ creativity and innovation (“OTOP fairs generate 2 billion,” 2015), which is actually mirroring one of the main objectives of Governor Hiramatsu OVOP concept in 1979. Further program incentives can be found in Thai Commerce Ministry statistics which state that Thai OTOP products now represent more than 10% of Thailand’s exports (MCOT, 2013). Further incentives for entrepreneurs to join in OTOP branding of their products include initiatives such as the OTOP Product Champion (OPC) certification that aims to improve the quality of CBE products (Natsuda et al., 2011).
Problem Statement
Innovators are, first and foremost, entrepreneurs (The World Bank, 2010) with Thailand’s CBE/OTOP entrepreneurial enterprises critical to national economic health, with various factors contributing to their export performance success (Hirohata, 2013). In the past, Thai entrepreneurial agricultural and handicraft exporters have experienced various challenges in overseas markets, including customer confidence, trust, and lack of product branding and identification (Kurokawa, 2010; Piriyakul & Wingwon, 2011). Production capacity for export purposes is a great challenge for developing nations, which in turn influences the quality, service standard, and production scale (The World Bank, 2010). Customer satisfaction with goods and service are critical to export performance (Julian, 2003; The World Bank, 2010).
Literature Review
Multiple experts and studies were analyzed in the lead-up to development for the variables for the study’s hypotheses concerning Thai entrepreneurial CBE/OTOP export performance.
Among these and most frequently mentioned were the CZ (Cavusgil & Zou, 1994) and the export performance (EXPERF) (Zou, Taylor, & Osland, 1998) models. The authors, however, found the history of European SMEs as discussed by the Dutch scholar Voerman (2003) particularly interesting as well as the detailed analysis on export performance from the Brazilian authors Carneiro, da Rocha, and da Silva (2007).
Finding agreement, however, on what components actually contribute to a firm’s export performance is complex with confirmation of this difficulty coming from early research from Aaby and Slater (1989) which conducted a review of 55 studies on the management influences on export performance from 1978 to 1988 and synthesized the findings down to the independent variables environment, competencies, firm characteristics (i.e., firm characteristics, firm capabilities, and management characteristics), and strategy (Voerman, 2003) which affected export performance. Madsen (1987) also synthesized 17 export performance studies from 1964 to 1985 into 23 latent variables grouped into three categories, which were referred to as organizational performance (O-performance), the structure and performance of its environment (E-structure), and strategies (strategy).
Sousa (2004) later reviewed 43 empirical studies published between 1998 and 2004 and noted 50 different operational aspects of export performance, whereas Leonidou (2004), on the contrary, compiled data from 32 empirical studies and identified 39 barriers to export performance of small businesses.
Cavusgil and Zou (1994) in their model focused on larger, U.S. organizations and how organizational performance was based on the organization’s profile; environmental aspects including cultural and political/legal factors; management factors including experience, education, and commitment; and finally the product and where it is destined for. Although a good model with many useful elements, the present study is focused on very small, rural entrepreneurs and artisans and therefore was not a “perfect” guideline to follow.
Zou et al. (1998) are also recognized for their EXPERF model whose key dimensions for measuring export performance include financial, strategic, and satisfaction. This scale has been empirically validated in a cross-national study of U.S. and Japanese exporters, as well as in a study of U.K. and Australian exporters (Styles & Ambler, 1994), and a study of British exporters, strengthening its value as a valid generalized export performance measure (Beleska-Spasova, 2014).
The literature does also suggest that export performance is closely associated with the characteristics of the enterprise, including such things as the size, the age, and who the entrepreneurs are, as in this study’s case (Sinkula, 1994; Zou et al., 1998). The research, however, did identify other studies concerning export performance which were focused on smaller SME organizations. This included Styles and Ambler (1998); Bartlett and Bukvić (2001); Leonidou (2004); Leonidou, Katsikeas, and Samieec (2002); and Ogunmokun and Ng (2004).
Styles and Ambler (1994) revised an earlier export performance framework from Aaby and Slater (1989) and concluded that it was the partnership and relationship factors which had the greatest influence on export performance improvement. Later, Styles (1998) refined Cavusgil and Zou’s (1994) model for use in the analysis of SMEs in Australia and U.K. firms and determined that economic performance, improvement of competitive position, future expansion, and passive exporting were the keys to SME export performance.
Research from Bartlett and Bukvić (2001) also focused on SMEs and investigated what hindered their growth the greatest, and strongly suggested that unless flexibly and deregulation are embraced, there will be significant barriers to small business growth. Ogunmokun and Ng (2004) explored Australian SME export performance (companies with fewer than 200 employees) but did so by comparing why some SMEs had better success than others in export performance. From these and other studies concerning theories about export performance, a synthesis of the research led to the following observed variables being determined.
Perceived Quality (PQ)
According to an export marketing performance survey conducted on Thai SMEs, one of the four factors determined to have a significant contribution was product characteristics (Julian, 2003). The three others included competition, commitment, and the export market characteristics. Concerning product characteristics, it was stated that concentration should be focused on product flexibility, which meets the need of the market, specifically cultural specificity and the degree of uniqueness of the product.
Aaker (1991) discussed brand equity and indicated that perceived quality as having five elements including reason-to-buy, differentiate/position, price premium, channel member, interest, and brand extensions.
Fornell, Johnson, Anderson, Cha, and Bryant (1996) also felt that quality awareness was crucial, whereas Bei and Chiao (2001) concluded that the most significant factor was the quality of goods. The World Bank (2010) has also indicated the importance of solid infrastructure for norms, standards, and quality control, which therefore assures the proper commercialization of products for either domestic or foreign markets.
Similarly, Brown (2003) stipulated the necessity of product and service excellence in perceived quality which corresponds to research from Tsiotsou (2005) concluding competitive comparisons as a key success factor. In addition, Türkyılmaz and Özkan (2007) cited overall quality, product quality, and appropriateness to usage purposes, including customer service, and service quality as significant factors.
This is consistent with Moliner (2009), which discussed corporate strategies and indicated that perceived value was more important than quality. Other factors such as fulfilling expectations, meeting customer’s goals, and having positive customer relationships are also significant (Tohidinia & Haghighi, 2011). Product performance, conformance to specifications, reliability, and durability are also applicable (Agus & Hajinoor, 2012).
In addition, Wang and Tsai (2014) stated that outstanding quality, reliability, and consistency are crucial elements of perceived quality as well with Laosirihongthong, Teh, and Adebanjo (2013), stating that a product’s performance, its conformance to specifications, reliability, and durability are equally important. Chang, Kuo, Hsu, and Cheng (2014) cited broader factors of information, service, and system quality.
Perceived Price (PP)
Dodds, Monroe, and Grewal (1991) indicated that perceived price (PP) let to perceived quality which thus led to perceived value. Bei and Chiao (2001) also indicated the importance of a reasonable price, whereas Moliner (2009) stressed the importance of customer loyalty and perceived value. This is consistent with Dai (2010), which also indicated that reasonable pricing is important which was in agreement with Wang and Tsai (2014).
In Thailand, Julian (2003) studied SME export performance and indicated that price competitiveness in the export market and product commitment as important factors in export marketing success with Leonidou et al. (2002) in agreement indicated that price flexibility and the ability to offer lower prices (i.e., penetration pricing) were positive for export performance.
Valvi and West (2013) in their discussion about E-loyalty indicated that perceived value was a significant predictor of satisfaction while price notably influenced e-trust development. Perceived price is also defined as pricing that is competitive or equal to competitors “pricing scales as well as corresponding to market trends” (Rijkers, 2014).
Trust (TR)
In Thailand, Piriyakul and Wingwon (2011) felt consumer trust toward a product brand played a critical role in supporting sustainable corporate growth. Lo (2003) elaborated further by indicating that trust consisted of integrity, benevolence, ability, perception, and communication. Jin, Park, and Kim (2007) highlighted trust in Korea as coming from a firm’s reputation. Brenčič, Ekar, and Virant (2008) indicated that a long-term orientation is a consequence of trust and relationship commitment with Lin (2013) indicating that significant and positive relationships were found between trust and satisfaction, and between satisfaction and loyalty.
Furthermore, according to Moliner (2009), trust is defined as being trustworthy, honest, and having a good reputation. Stuart, Verville, and Taskin (2011), however, saw trust as being built principally through supplier centric traditional performance metrics such as delivery reliability and product quality conformance.
Trust is also earned when performance meets expectations and comes from reliable products (Valvi & West, 2013). To achieve trust, enterprises need to respond to a customer’s need, have honesty and sincerity, keep commitments, and possess competency and effectiveness in their service delivery (Alsajjan, 2014). This is consistent with Chang et al. (2014) which determined that for businesses to promote trust, they must provide excellent service which is reliable and delivered with good intentions and Rijkers (2014) which found that trust is earned from firms being reasonable, fair, and having appropriate services and price consistency.
Satisfaction (ST)
Zou and Stan (1998) found 50 papers published between 1987 and 1997, and from the seven categories measuring export performance, satisfaction was a key element. Hill, Jones, and Schilling (2015) stated that identification of the customer’s needs along with superior fulfillment of customer satisfaction over rivals contributed to a competitive advantage.
Anderson and Fornell (2000) divided customer satisfaction into three determinants: perceived service quality, perceived value, and customer expectations. Satisfaction can also be defined broadly as a customer being satisfied with a product or service (Bei & Chiao, 2001). In addition, Tohidinia and Haghighi (2011) indicated that relationship quality had a significant impact with customer satisfaction and that customer satisfaction had a positive impact on repurchase intentions, positive word-of-mouth, and customer’s positive feedback.
This is consistent with Türkyilmaz and Özkan (2007) which conducted research in Turkey on Istanbul mobile phone subscribers and determined that that these providers with limited resources should focus on improving customer satisfaction and customer loyalty.
Calvo-Porral and Lévy-Mangin (2015) indicated that both service value and corporate image exerted the strongest influence on customer satisfaction and loyalty. Dai (2010) indicated that satisfaction can also be derived from a successful purchase decision which leads to happiness and overall satisfaction (Tsiotsou, 2005; Vesel & Zabkar, 2010).
Export Performance (EP)
Bilkey (1978) determined that management quality is the greatest single determinant of a firm’s export success. This is consistent with Ayan and Percin (2005) which determined that export market success can also be determined by multiple indicators including environmental factors such as foreign environments, managerial characteristics, and the firm’s marketing strategies.
Brown (2003) focused on market share, rapid growth, and profit as components of export performance, yet Brenčič et al. (2008) defined export performance as profitability, which is reflected in sale volume, rapid growth, global competitiveness, strategic position, global market share, performance satisfaction, and success with the export venture which fully meets expectations. Export performance factors are also determined by profit, return of investment (ROI), revenue, total sales, market shares, sales growth rate, export growth rates, or number of new customers (Abu-Jarad, Yusof, & Nikbin, 2010).
This is consistent with Ural (2009) which demonstrated that there is a positive impact of information sharing, strategic positioning, and performance on financial export performance and satisfaction with the export venture. Stuart et al. (2011) examined trust between supplier and buyer firms as well as the impact that trust has on export performance outcomes which included customer satisfaction, market share, and profitability. This was similar to Agus and Hajinoor (2012) and Laosirihongthong et al. (2013) that emphasized the importance of market share, profitability, sales growth, and market growth on export performance (Table 1).
Summary of Latent and Observed Variables Along With Their Associated References.

Note. PQ = Perceived Quality; PP = Perceived Price; TR = Trust; ST = Satisfaction; EP = Export Performance.
Method
Data Collection
From the 2015 Thai Exporter Directory Database from the Ministry of Commerce’s Department of International Trade (DIP), 1,353 Thai OTOP handicraft exporters which were listed were extracted. Starting in November 2014, phone calls were placed to 720 enterprise entrepreneurs involved in export of Thai handicraft- and food-related products. Upon contact with these owners, the best method for sending the export performance questionnaire was determined (post, email, courier, etc.). Subsequent follow-up calls and emails were made to those owners who had not returned the survey in December 2014 and January 2015, with the completion of the follow-up process ending in February 2015. From this process, the targeted collection number was not achieved.
Therefore, 10 teams were selected and deployed to physically travel to the enterprises’ location in May 2015 and gather a completed survey. From this added level of collection, the researchers were able to obtain 545 questionnaires. This represented a collection rate of 75.69% (545 of the original 720 enterprises identified). Subsequent quality control and auditing of the responses eliminated 45 sets, leaving a final survey response rate of 69.44% or 500 of the originally identified 720 enterprises.
Based on statistical sampling requirements for research conducted for the U.S. National Education Association (NEA), Krejcie and Morgan (1970) indicated that sample sizes larger than 380 are unnecessary. Yamane (1967) and Israel (1992) also have indicated that sample sizes beyond 400 are almost irrelevant as well.
Furthermore, during the period between March and May 2015, qualitative research was further conducted by use of in-depth, semistructured, guided interviews with seven owners and executives covering the following five topics:
Measurement of perceived quality.
Measurement of perceived price.
Measurement of trust.
Measurement of customer satisfaction.
Measurement of export performance.
For the study, Cronbach’s alpha (Cronbach, 1951) was used to evaluate the initial 30 samples which used a 6-point, unipolar scale survey rating matrix with 5 indicating excellent and 0 indicating no opinion. The value of alpha that is considered acceptable ranges in value from 0 to 1 and may be used to describe the reliability of factors extracted from multipoint formatted questionnaires or scales, with a reliability score of .70 or higher being considered a reliable score by many researchers (Hair, Hult, Ringle, & Sarstedt, 2013; Nunnally & Berstein, 1994). The correlation coefficient indicated high reliability with a score of .953.
Quantitative Data Analysis
To determine whether the sample size of 500 exporters selected by use of simple random sampling for the study was adequate, the researchers further confirmed this to be the case from previous researchers (Hair et al., 2013; Schumacker & Lomax, 2004). The questionnaire used a 6-point unipolar scale with 5 indicating excellent and 0 indicating no quality (Krosnick & Presser, 2009). This was similar to the export performance rating scale used by Pope (2002) to measure small firms. Analysis of Thai owner and entrepreneur export performance was conducted using descriptive statistics including frequency, percentage, mean, and standard deviation (Keengwe, Onchwari, & Wachira, 2008).
From literature reviews, the following latent and observed variables were analyzed for this study.
The study defined the hypothesized framework as shown below and in Figure 2.

Hypothesized framework.
Results
Respondents’ Characteristics
Of the 500 respondents for the study, 301 were female (60.2%) and 199 were male (39.8%). These respondents were divided into five age groups: 41 to 50 years (156 respondents or 31.2%), 31 to 40 years (154 respondents or 30.8%), 51 to 62 years (85 respondents or 17.0%), below 30 years old (76 respondents or 15.2%), with the remaining group above 60 years old of age with 29 respondents (5.8%).
Regarding education, 220 of the 500 surveyed respondents had bachelor’s degrees (44.0%); the second largest group with 141 respondents had vocational education (28.2%), with the remaining respondents represented by other types of education including 15 with master’s degrees (3.0%) and with the remaining 124 respondents representing other or lower educational levels (24.8%).
Among the total 500 respondents, 440 respondents were business owners, representing 88% of the total, with the remainder 60 (12.0%) indicating “business executives” as their title/position. Work experience was broken down into those with 10 or more years’ experience (231 or 46.2%), those with 6 to 10 years of work experience (124 or 24.8%), those with 1 to 5 years of experience (120 or 24.0%), and, finally, the smallest group was those with less than 1 year of experience (25 respondents or 5.0%).
The vast majority of the entrepreneurs surveyed either owned or worked in groups that had 50 or fewer employees representing 472 of the respondents (94.4%). This was followed by 22 respondents (4.4%) working in groups with 51 to 100 employees, with only two of the total of 500 surveyed working in organizations larger than 101 employees (0.4%).
In addition, the respondents are divided into 10 groups according to their assets. The largest group was represented by those with maximum assets not exceeding 5 million THB (US$144, 400 on September 27, 2016) which had 216 members (43.2%). This was followed by those who worked with 76 businesses (15.2%) with assets between 26 and 50 million THB. Another group with 56 respondents (11.2%) had assets between 51 and 75 million THB followed by 53 respondents between 6 and 25 million THB (10.6%). Respondents with assets between 76 and 100 million THB included 42 respondents (8.4%); between 101 and 125 million THB, 21 respondents (4.2%); between 126 and 150 million THB, 20 respondents (4.0%); between 151 and 175 million THB, nine respondents (1.8%); between 176 and 200 million THB, six respondents (1.2%); and, finally, the last group with assets more than 200 million THB was just one respondent (0.2%).
The respondents were engaged in various forms of business including manufacturing (151 respondents or 30.2%), wholesalers (134 respondents or 26.8%), retail (125 respondents or 25.0%), wholesale and retail (45 respondents or 9.0%), manufacturing and wholesale (35 respondents or 7.0%), and combined manufacturer, wholesaler, and retailer (10 respondents or 2.0%).
Confirmatory Factor Analysis (CFA)
According to Magistris and Gracia (2008), to access the measurement models, a CFA is used followed by structural equation modeling (SEM) to examine the general fit of the proposed model with data and also to identify the overall relationships among these constructs. Wong (2013) indicated also that for marketing research, a significance level of 5%, a statistical power of 80%, and R2 values of at least .25 are considered typical.
Standard modeling accepts the proposed model if the p value is higher than .05 and if the χ2/df ratio is smaller than 2 (Byrne, Shavelson, & Muthén, 1989) which is consistent with Kline (1998) and Ullman (2001) which also indicated that the relative χ2 should be less than 2. It is also common to display confirmatory factor models as path diagrams in which squares show the observed variables and circles show the latent concepts (Albright & Park, 2009).
In addition, another commonly reported statistic and a potential mechanism for accommodating large sample sizes may be to use the root mean square error of approximation (RMSEA) as a measure of goodness-of-fit in SEMs (Chen, Curran, Bollen, Kirby, & Paxton, 2008; and to measure the discrepancy per degree of freedom (Hu & Bentler, 1999).
The Amos 22 user’s guide suggests that “a value of the RMSEA of about 0.05 or less would indicate a close fit of the model in relation to the degrees of freedom” (Arbuckle, 2013). RMSEA values range from 0 to 1, with a smaller RMSEA value indicating better model fit. Acceptable model fit is indicated by an RMSEA value if recommendations for RMSEA cutoff points have been reduced considerably over the past couple of decades (Hu & Bentler, 1999).
Perceived Quality (PQ)
Using SEM, the researchers specified the CFA model (Hox & Bechger, 1998) where the Perceived Quality (PQ; Figure 3) is influenced by (PQ1) Best Quality, (PQ2) Excellent Standards, (PQ4) Meeting Customer’s Goals, (PQ5) Durable Products, and (PQ7) Service Quality as shown in Figure 3. From the modeling, the χ2 was indicated to be 0.54, with a p value of .764 and RMSEA of 0.000 which indicates an acceptable fit with the model. This ensures that the observed variables are sensitive to Perceived Quality (PQ) and are suitable for further analysis.

CFA for PQ (value from completely standardized solution).
Perceived Price (PP)
CFA of Perceived Price (PP) in Figure 4 shows the factors (PP1) Reasonable Price, (PP2) Fair Price, (PP3) Acceptable Price, (PP4) Competitive Market Price, and (PP5) Market Trends. From the modeling, the χ2 was indicated to be 0.06, with a p value of .970 and RMSEA of 0.000 which indicates an acceptable fit with the model. This ensures that the observed variables are sensitive to Perceived Pricing (PP) and are suitable for further analysis.

CFA for PP (value from completely standardized solution).
Trust (TR)
CFA of Trust (TR) in Figure 5 shows the factors (TR1) Trustworthy, (TR2) Ability, (TR3) Judgment, (TR4) Product Trust, (TR5) Integrity, (TR6) Honesty, and (TR7) Trust in Promise. From the modeling, the χ2 was indicated to be 11.03, with a p value of .273 and RMSEA of 0.021 which indicates an acceptable fit with the model. This ensures that the observed variables are sensitive to Trust (TR) and are suitable for further analysis.
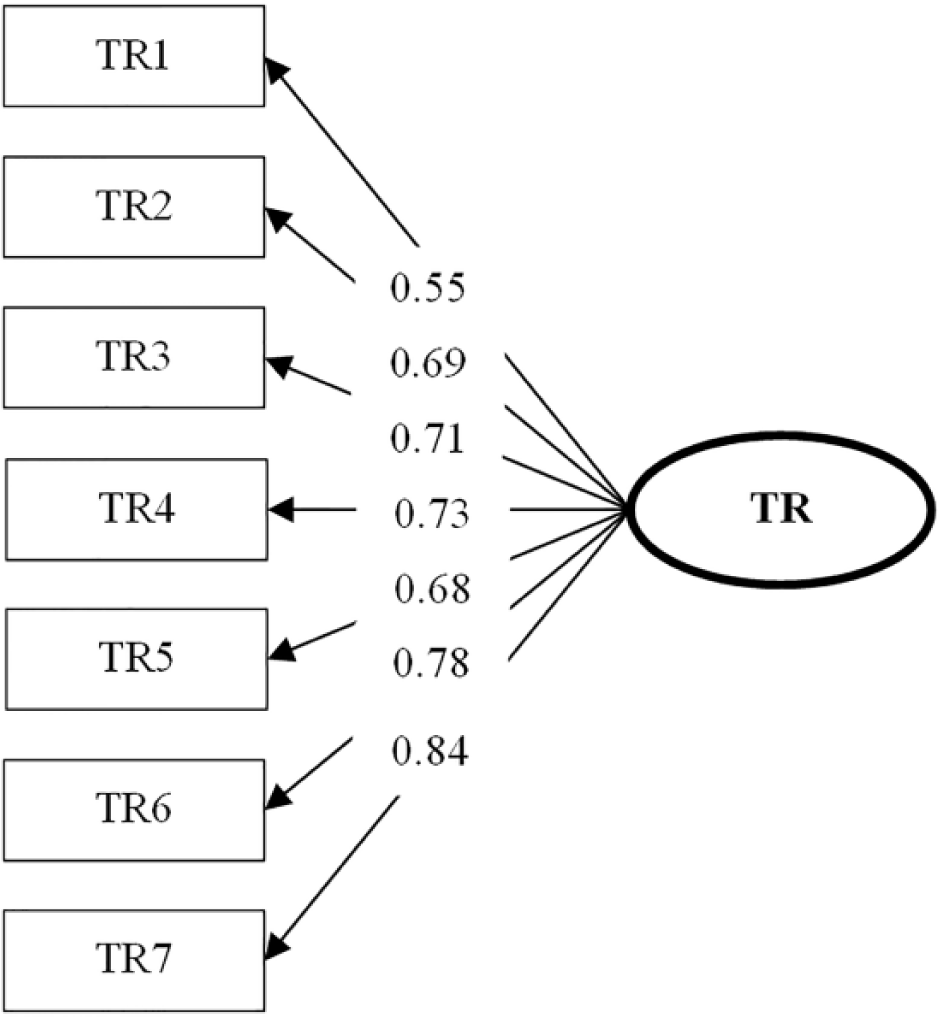
CFA for TR (value from completely standardized solution).
Satisfaction (ST)
CFA of Satisfaction (ST) in Figure 6 shows the factors (ST1) Overall Satisfaction, (ST2) Satisfaction With Goods, (ST3) Exceeds Expectations, (ST4) Satisfied Service, (ST5) Purchase Decision Satisfaction, and (ST6) Needs Satisfied. From the modeling, the χ2 was indicated to be 11.03, with a p value of .273 and RMSEA of 0.021 which indicates an acceptable fit with the model. This ensures that the observed variables are sensitive to Satisfaction (ST) and are suitable for further analysis.

CFA for ST (value from completely standardized solution).
From the modeling, the χ2 was indicated to be 0.03, with a p value of .986 and RMSEA of 0.000 which indicates a good fit with the model. This ensures that the observed variables are sensitive to Satisfaction (ST) and are suitable for further analysis.
Export Performance (EP)
CFA of Export Performance (EP) in Figure 7 shows the factors (EP1) Market Share, (EP2) Profitability, (EP3) Rapid Growth, (EP4) Sales Volume, (EP5) Strategic Position Growth, (EP6) Satisfied Performance, and (EP7) Global Competitiveness. From the modeling, the χ2 was indicated to be 11.03, with a p value of .273 and RMSEA of 0.021 which indicates an acceptable fit with the model (Table 2). This ensures that the observed variables are sensitive to Export Performance (EP) and are suitable for further analysis.
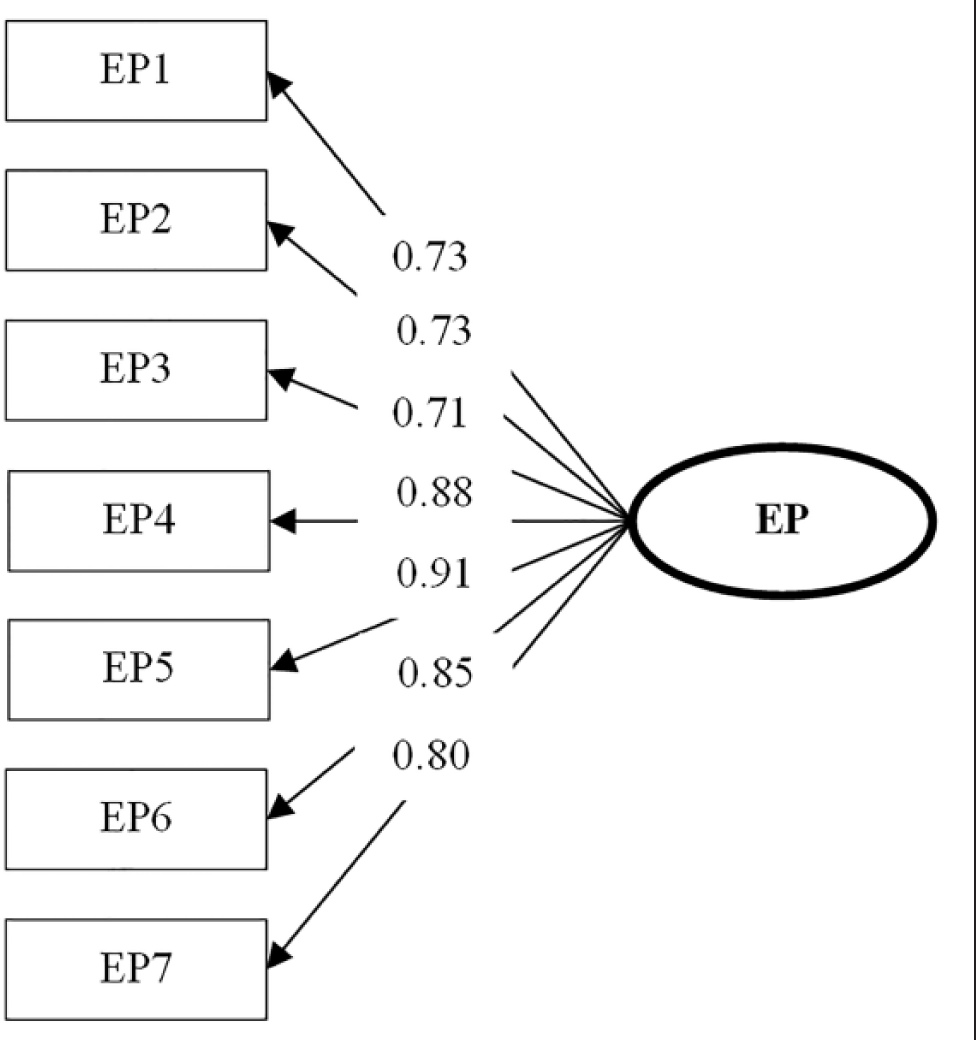
CFA for EP (value from completely standardized solution).
Goodness-of-Fit Summary Results for the Structural Model.

Source. Adapted from Arbuckle (2013) and Hair et al. (2013).
Note. GFI = goodness-of-fit index; AGFI = adjusted goodness-of-fit index; RMSEA = root mean square error of approximation; CMIN = minimum chi-square.
From the modeling, the χ2 was indicated to be 6.43, with a p value of .490 and RMSEA of 0.000 which indicates a good fit with the model. This ensures that the observed variables are sensitive to Export Performance (EP) and are suitable for further analysis.
Rasch (1980) evaluated χ2 statistics as a way of evaluating fit of data to the model and indicated that a sample size of 500 has a 5% range of 0.91 to 1.09. The χ2 value of 302.04 for the 109 degrees of freedom is insignificant. Thus, it could say the null hypothesis that the model presented in the article is a good fit with the data. The error statistics of RMSEA of 0.015 confirm that the errors of fit in the covariance matrix are very low.
The p value of .101 in Figure 8 is higher than .05, which shows that the criteria is a good fit with the empirical data and with each factors weight higher than 0.50 represents a latent recognition of the quality Perceived Quality to Perceived Price, Trust, Satisfaction which results in Export Performance in the construct validity of the variables and empirical variables that could explain the variance of latency as well. In addition, empirical variables enable to explain variances of observed variables ensuring suitability for SEM.

Convergent model (value from completely standardized solution).
SEM Results
The SEM results (Figure 9) showed that all models meet the required criteria at 276.94 χ2 value, with χ2/df (276.94/251) at 1.10, p value at .13, goodness-of-fit index (GFI) at 0.96, adjusted goodness-of-fit index (AGFI) at 0.93, root mean residual (RMR) at 0.031, RMSEA at 0.014, and CN at 542.74.
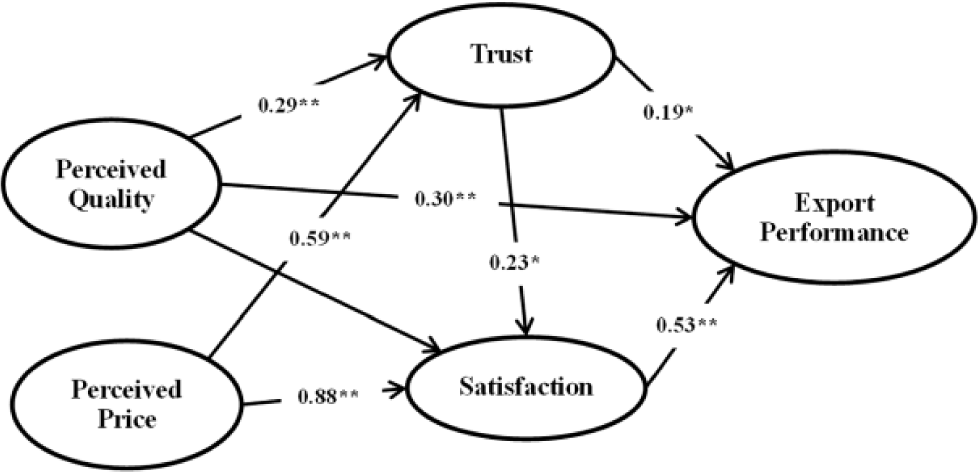
Final model with values from estimates.
According to Hooper, Coughlan, and Mullen (2008), items with low multiple R2 (less than .20) have been removed from the analysis as this is an indication of very high levels of error. This is confirmed by Hair et al. (2013) which indicated that R2 values should be higher than .25. From Table 3, GFI is indicated to be 0.96 which is the GFI. Traditionally, an omnibus cutoff point of 0.90 has been recommended for the GFI (Hooper et al., 2008). Values for the AGFI also ranged between 0 and 1, and it is generally accepted that values of 0.90 or greater (Figure 8) indicate well-fitting models (Hooper et al., 2008). The AGFI for the study in Table 3 is 0.96.
Structural Equation Modeling Results.

Note. χ2 = 276.94, χ2/df (276.94/251) = 1.10, p value = .13, GFI = 0.96, AGFI = 0.93, RMR = 0.031, RMSEA = 0.014, and CN = 542.74. Values in parentheses are standard errors. DE = direct effect; IE = indirect effect; TE = total effect, values are estimated; GFI = goodness-of-fit index; AGFI = adjusted goodness-of-fit index; RMSEA = root mean square error of approximation.
p < .05. **p < .01.
Hypothesis Testing
The results of the hypotheses testing are indicated in Table 4.
Hypothesis Testing Results.

Discussion and Conclusion
Results from the study indicate perceived quality (PQ) has a positive and direct effect on trust (TR) which corresponds to research by Moliner (2009), Vesel and Zabkar (2010), Wang and Tsai (2014), and Chang et al. (2014). Indications also suggest that the higher perceived quality awareness is, the more trust a customer has. This requires Thai CBEs/OTOP handicraft and product exporters to focus on products with excellent quality while also meeting production standards that are suitable for customer needs, including durability and good customer service. These factors highly influence a customer’s trust.
In addition, the results show that perceived quality (PQ) has a direct and positive impact on satisfaction (ST), which corresponds to research from e-study of Fornell et al. (1996), Anderson and Fornell (2000), Bei and Chiao (2001), Tsiotsou (2005), Türkyilmaz and Özkan (2007), Vesel and Zabkar (2010), and Tohidinia and Haghighi (2011). This higher consumer awareness translates into higher satisfaction which means that exporters should focus on products with excellent quality that meet production standards, and are suitable to customer needs. Furthermore, products should be durable and maintained through an excellent product service system. These factors all have a significant influence over a customer’s purchasing decision.
Furthermore, the study showed that perceived price (PP) has a direct and positive impact on satisfaction (ST) corresponding to studies conducted by Bei and Chiao (2001), Moliner (2009), Dai (2010), and Rijkers (2014). This explains that the greater export customer price awareness is, the higher satisfaction they have. Hence, the Thai exporters’ customers expect reasonable and fair prices which are competitive. There is also an indirect, positive factor from the results which show that satisfaction (ST) delivered through higher price awareness affects satisfaction (ST) through trust (TR).
Perceived price (PP) was also shown to have both a direct and positive impact on trust (TR) which was validated in previous studies from Moliner (2009), Wang and Tsai (2014), and Valvi and West (2013). This proves that the higher export customer pricing awareness is, the more likely they are to trust the exporter. Hence, Thai exporters should ensure that their products have reasonable and fair pricing which is acceptable and competitive and corresponds to market trends to promote trust among their customers.
Perceived quality (PQ) was also shown to have a direct and positive impact on export performance (EP) corresponding to studies conducted by Brown (2003), Agus and Hajinoor (2012), Laosirihongthong et al. (2013), and Laosirihongthong et al. (2013). This shows that quality awareness is an important element for export growth. The analysis emphasizes that Thai exporters need to promote high-quality products which are suitable to their customer’s needs. The products must also be durable and serviced with excellent customer services. These factors are all important to Thai export performance (EP).
Trust (TR) was also shown to have a direct and positive impact on satisfaction (ST) which corresponded to previous studies from Jin et al. (2007); Sanayei, Shaemi, and Jamshidi (2011); Chang (2012); Chen et al. (2008); Lin (2013); Alsajjan (2014); and Rijkers (2014). Trust (TR) therefore promotes customer satisfaction (ST), and focus needs to be given on products that have good marketing potential, have excellent quality, and are suitable to customer’s needs. Thai OTOP exporter’s goals should be focused on promoting customer satisfaction (ST) with both production and service, which leads to better export performance (EP). In addition, Thai exporters should promote satisfaction with purchasing decisions, provide products suitable to consumer’s needs, and ensure overall customer satisfaction (ST) to enhance their export performance (EP).
In addition, trust (TR) influences directly and positively export performance (EP) which is similar to results of studies conducted by Lo (2003), and Brenčič et al. (2008) which shows that trust (TR) influences export performance (EP) with the greater a customer trusting the exporter, the higher the export performance (EP) value becomes. As such, Thai exporters should focus on high-quality, marketable products. Trust (TR) leads to purchasing contracts, which leads to better export performance (EP).
In addition, Satisfaction (ST) has a direct and positive impact on export performance (EP) as indicated in studies conducted by Ural (2009). As satisfaction (ST) levels increase, the greater the positive impact on export performance (EP). Thus, Thai exporters should aim to promote product and service satisfaction. In addition, exporters should help with their customers’ purchasing decision by providing products suitable to their customers’ needs while ensuring overall customer satisfaction.
Implications
Export sector success depends on properly designing production to meet the needs and growth of customers which assures the exporters’ strategic strength.
To achieve this goal, marketable products with clear and proper positioning must be realized.
The most significant factor affecting export performance is customer satisfaction which includes maintaining proper production levels while maintaining high perceived quality which is also a significant factor.
Perceived quality involves product durability, product quality, and meeting product standards.
Trust must be maintained between the customer and the exporter, with the customer–trusting in the quality of the deliverables, the contracts, the scheduling, and the production quotas.
Perceived Price is significant in that it must be competitive, follows market trends, and is reasonable and acceptable. As such, the exporters should monitor their customer’s satisfaction periodically.
Footnotes
Declaration of Conflicting Interests
The author(s) declared no potential conflicts of interest with respect to the research, authorship, and/or publication of this article.
Funding
The author(s) received no financial support for the research and/or authorship of this article.