
Abstract
This study analyzes the sector-wise dividend payment behavior of Karachi Stock Exchange (KSE) for the period 2009 through 2013. First, the trend of dividend payment of 5 years with respect to all 32 sectors is assessed through descriptive analysis. Second, the unit root test for panel data and pooled ordinary lest square (POLS) test were used on 15 non-financial sectors. Results show that the earning per share has a positive impact on dividend payment in eight sectors including beverages, travel and leisure, fixed-line telecommunication, food processors, household goods, personal goods, automobiles, and electricity; however, forestry (paper and board) is negatively associated with the dividend payout ratio. In addition, free cash flow has a positive impact on dividend payment in fixed-line telecommunication, and a negative impact on chemical, forestry, construction and material, engineering, beverages, tobacco, travel and leisure, food processor, household goods, pharmaceutical and biotech, and automobiles.
Introduction
In principle, the profits of a business organization may be either distributed in the form of paying dividend to its shareholders or retained in the business. In the discipline of finance, the decision of dividend payment is considered as one of the financial management decisions (Brealey, Mayers, & Allen, 2012), which mainly reflects corporate dividend policy. Theoretically, the behavior of paying dividend actually signals the profitability of the business, and it is distributed among U.S. shareholders after it is taxed first at the corporate level and then at the personal level (Hines, 1996). Regular payouts of dividends are generally valuable to individual shareholders who possess intermittent irrational behavior (Shefrin & Statman, 1984). In other words, the dividend process represents the remaining disposition of organizational reserves after the lucrative investment opportunities are capitalized; therefore, dividend tax rate (if it remains constant over a period of time) should not affect the dividend payment behavior (Auerbach, 1979; Bradford, 1981; King, 1977).
Indeed, firms adjust their dividend policies in accordance with the amount of earnings they hold (Al-Ajmi & Hussain, 2011). Dividend payment behavior has been analyzed by different authors, for example, while studying dividend payment behavior of 25 common and civil law countries firms, Ferris, Sen, and Unlu (2009) revealed a diminishing trend from 72% to 55% within 11 years due to the presence of non-dividend paying firms. The academic and professional literatures have concluded that the dividend payment patterns have been decreasing significantly for more than two decades. This is mainly because of the structural composition of different firms in the United States as well as their inability to generate enough profits to be distributed among shareholders. In fact, these business organizations tend to retain the total earnings to capitalize on various profitable growth opportunities. Moreover, according to Doyle (1994), the companies tend to strengthen their marketing plans (called right-handed organizations) to put major emphasis on customer orientation besides incorporating measures to substantially improve their financial plans (called left-handed organizations). It is, therefore, important to note that although firms tend to distribute dividends among shareholders but often in the form of inconsistent or irregular pattern. This dividend payment policy is usually exerted by the companies that observe significant variations in their level of earnings (Fama & French, 2001; Pandey, 2003).
Furthermore, the relationship of dividends has been studied with other variables too. For instance, Basse and Reddemann (2011) noted a positive relationship between the dividends and inflation and hence argued that companies tend to increase their dividend payments mainly during the inflationary period. Notably, in the context of Pakistan, it has been observed that both ownership structure and cash flows are the main determinants of corporate dividend policy (Afza & Mirza, 2010), which, in turn, may be used to determine stock price volatility (PV; Nazir, Nawaz, Anwar, & Ahmed, 2010).
Previously, authors have also emphasized financial managers to look into the significant pattern of dividend payments (Cheng, Cullinan, & Zhang, 2014). The traditional notion that the dividend policy may be used to determine the market value of the company has been criticized by Miller and Modigliani (1961). In contrast, it is also believed that earning is the main factor, which sets the mode of dividend payment behavior (Baker, Sasdi, Dutta, & Gahndi, 2007; Basse & Reddemann, 2011; John & Muthusamy, 2010; Ramachandran & Packkirisamy, 2010).
Statement of the Problem
Equity market is considered as the backbone in mounting funds to build a national economy, whereas a capital market plays an integral role in mobilizing domestic and foreign resources so that it could assist stakeholders in making better financial decisions. It not only serves as the most productive medium for long-term usage of funds but also eases the process of the efficient allocation of resources.
In the context of emerging markets, such as Vietnamese stock market, the findings of Tran and Nguyen (2014) revealed the utilizations of the stable dividend policy using fixed-effect model in the country. Similarly, a few scholars (e.g., Afza & Mirza, 2010; Ahmed & Javid, 2009) have studied dividend payment behavior in Karachi Stock Exchange (KSE), which is the largest capital market of Pakistan. The equity market of the country was considered as one of the emerging markets by International Finance Corporation (IFC) in 1991 whose pace was initially very slow; however, it was reemerged following the new millennium. Notably, the performance of the equity market was spectacular till 2004.
In addition, the history of dividend payments could be the influencing factor for the investors, who intend to initiate their savings for the mobilization of economic growth. The determinants that influence dividend payments have been discussed by different authors (e.g., Afza & Mirza, 2010; Ahmed & Javid, 2009; Baker et al., 2007; Basse & Reddemann, 2011; John & Muthusamy, 2010; Ramachandran & Packkirisamy, 2010). In fact, the nature, characteristics, and efficiency of dividend policies of emerging markets differ from developed markets (Manneh & Naser, 2015; Sharma & Pandey, 2014; Tran & Nguyen, 2014). Although researchers have the similar views about the nature, characteristics, and efficiency of dividend policies in the developing markets, very little is known regarding these three facets in the context of emerging markets. Therefore, it forms the basis of this study to analyze the determinants of dividend policy behavior in Pakistan.
The contributions of this article are twofold. First, this study provides a sector-wise analysis of the payment behavior for all 32 sectors operating in KSE for the period 2009 through 2013. Second, it also identifies the relationship among different dividend payment variables of 15 non-financial sectors during the aforementioned time period. The results of this study will help investors visualize the ongoing trends amid these sectors. Besides, it would also contribute to the ongoing discussion of factors that influence dividend payments behavior particularly in the context of an emerging market. More specifically, the study will help those investors who mainly plan to rotate their portfolio of investment opportunities with review to achieve optimum profits.
Review of Empirical Studies
It is observed that dividends are disappearing mostly in the U.S. market because there is a decreasing trend in the number of firms paying dividends. Two very common reasons for this phenomenon include characteristics and tendency of firms to pay dividends (Fama & French, 2001). According to catering theory, managers accommodate investors for payment of dividends when premium on stock price is available and do not pay when an investor does not have a desire of dividends (Baker & Wurgler, 2004). Consequently, propensity to pay high dividend depends on dividend premium; hence, it will be low when negative dividend premium exists.
On the same lines, Abdulkadir, Abdullah, and Wong (2016) investigated the dividend payment behavior in Nigeria by taking the data of 126 non-financial firms covering the period from 2003 to 2012. Dividend payment behavior has been investigated by incorporating clientele, catering, and life cycle theories using the variables such as dividend payment (as outcome variable) and foreign, premium, retained earnings, firm size, return on assets (ROA), investments (INV), cash flows (CF), leverage (LEV), precious year dividend, financial crises, stock market performance, and interest rates (as explanatory variables). Results of panel logistic regression revealed a decreasing trend of dividend payment due to an increase in the foreign investments. They noted that foreign investors have less preferences on receiving dividends due to the involvement of tax.
Similarly, Duscha et al. (2016) pointed out renewable energy sources (RES) development, which can show an important part in European economy up to 2030. The objective was to increase security, job, and growth opportunities by reducing the low carbon in the economy. The idea of triple dividend was used by development of RES in Europe up to 2030. They used detailed techno-economic model and two macroeconomic models. Results support the expected triple dividend up to 2030 despite a decrease in role of European economy as a technology provider to the rest of the world.
In addition, Bremberger, Cambini, Gugler, and Rondi (2016) explained the impact on dividend policy by focusing on different regulatory and government-controlled environment. The panel data were used to check the relationship of dividend payout with cost-based versus incentive-based and state-owned versus privately owned regulated firms in the European listed companies. The findings were consistent with the cost-based regulated firms, which smoothly maintain their dividend policy as compared with the incentive-based firms. It is also found that although the government-regulated firms are weak in efficiency, the shareholders are given an increased amount of importance while devising the dividend policy.
Besides, Manneh and Naser (2015) studied dividend of non-financial companies of Abu Dhabi Securities Exchange (ADX), which is one of the emerging market in Asia. The study mainly concentrated on manufacturing, services, food, energy, telecommunications, and property and real estates. They found a significant and positive relationship between dividend policy and earnings in ADX. The findings of this study have been found consistent with agency theory, which holds that dividend is negatively associated with the leverage.
Furthermore, Sikes and Verrecchia (2015) pointed out the relationship between dividend tax capitalization and liquidity. Theoretical analysis showed a positive impact of liquidity moderates dividend taxes on expected rates of return, whereas empirical analysis was adjusted on Jobs and Growth Tax Relief and Reconciliation Act of 2003, which minimizes the gap between maximum statutory dividend and capital gain taxes. Results also provide evidence to institutional ownerships, which mitigates the repercussion of taxes on dividend capitalization.
In addition, Javakhadze, Ferris, and Sen (2014) examined the dividend smoothing globally based on agency model and the theories that explain the irregular dividend information. A cross-sectional sample of more than 2,000 firms of 24 countries was drawn, which have less market-to-book ratio and less cash involvement in larger dividend smoothing. The analysis of initial outcome emphasized that the firms with less amount of cash reserves tend to maintain dividend smoothing. The findings also suggested that ownership concentration has a negative impact on dividend smoothing. Moreover, the governance has shown a negative effect on dividend payment behavior.
Besides, Sharma and Pandey (2014) constructed a non-parametric model, which shows dividend payment behavior of Indian Stock Market. There are no signaling effects of either increased or decreased dividend found in their study. However, it is also revealed that due to inefficiencies in the stock market, adjustments in prices are made once any relevant information is provided to the market.
Similarly, Cheng et al. (2014) provided the evidence of dividend payment behavior of cross-listed companies operating in the Chinese stock market for the period covering 2003 to 2011. Free cash flow plays a vital role in the case of cross-listed companies for distribution of dividend. Results concluded that cross-listed companies’ dividend are normally lower than other listed companies. It is also found that more responsive dividend policies of cross-listed companies and the relationship of dividend behavior are considered more volatile with the free cash flow and development breaks.
In addition, Musiega, Alala, Douglas, Christopher, and Robert (2013) analyzed the determinants of dividend policy on Nairobi Stock Exchange for the period 2007 to 2011. Dividend payout was the dependent variable, whereas profitability, growth, earning, and liquidity were taken as independent variables. Moreover, size and risk were used as moderators. Results showed that return on equity, size, and growth have a positive impact on dividend payout.
Likewise, Nnadi, Wogboroma, and Kabel (2013) investigated determinants of dividend policy of 29 listed firms in the African Stock Exchange. By using unit root test and Tobit regression, the study revealed that government, age, market capitalization, and earning per share have positive influence on dividend policy in African listed firms.
Similarly, Al-Ajmi and Hussain (2011) reviewed the corporate dividend decisions in Saudi Arabia by using a sample of 54 Saudi listed firms during 1990 and 2006. The results revealed that most of the Saudi firms pay small amount of dividends out of their earnings. It is further reported that fixed dividend policy are not used by these firms and they tend to change or adjust their dividend policies according to the amount of earnings they observe. The authors determined that four factors actually influenced the dividend policy decision in the Kingdom of Saudi Arabia: (a) more profitability, (b) large firms, (c) firms that paid dividends in previous period, and (d) the firms occupying relatively fewer investment opportunities.
Moreover, Basse and Reddemann (2011) explained the inflation and the dividend policy of U.S. firms by using the quarterly data from 1980 to 2008. Co-integration technique of long-run relationship was applied on variables including dividends, corporate earnings, real growth, and inflation. The results showed that there is a stable long-run relationship between all these variables and there is also a positive relationship between the dividends and inflation. The study also revealed that companies mostly increase their dividend payments during inflationary environment.
Besides, Abor and Bokpin (2010) evaluated the effect of corporate finance and investments on dividend policy in 34 countries covering the period from 1990 to 2006. The fixed-effect panel model was used in the analysis using the variables such as profitability, leverage, debt, external financing, and stock market capitalization representing corporate finance. The results showed that stock market capitalization and profitability were more significant determinants of dividend policy; however, non-significant impact of leverage, debt, external financing was recorded on dividend policy. Besides, the results also revealed that there is a significant association between investment opportunities and dividend policy. They concluded that firms that belong to developed markets are more focused toward paying least possible dividends to their shareholders.
In addition, Nazir et al. (2010) evaluated the role of corporate dividend policy in determining the stock PV in Pakistan by using a sample of 73 firms from KSE from 2003 to 2008. The techniques used were fixed-effect and random-effect regression, with the test involving PV as dependent variable and dividend yield as independent variable. It is suggested that the dividend policy have effect of stock PV in Pakistan.
Likewise, John and Muthusamy (2010) investigated the relationship between leverage, growth, and profitability on payout ratio in Indian paper industry by using the data of top 10 paper firms listed on Bombay Stock Exchange based on sales. Ordinary least square (OLS) regression was used and secondary data were collected from Center of Monitoring Indian Economy. Growth in sales, earning per share, price earnings ratio, market-to-book value, cash flow, leverage, liquidity, and ROA were used as independent variables to predict dividend payout. Results showed that there is a negative relationship between leverage and dividend payout.
Similarly, Ramachandran and Packkirisamy (2010) ascertained the impact of firm size on dividend payment behavior with reference to corporate firms across industrial estates in India by using a panel data of 73 firms from 1996 to 2007. Sectors were selected including cement, chemical, and fertilizer, information technology, oil and gas, pharmaceutical, shipping, and textile. The variables used were capital structure, dividend payout, and dividend per share. It is reported that dividend per share of different sizes of firms in India is dependent on the level of debt and capital structure.
In addition, Afza and Mirza (2010) pointed out the ownership structure and cash flows as determinants of corporate dividend policy in Pakistan by using the data of 100 listed companies in KSE from 2005 to 2007. OLS regression was used to assess the impact of firm size, management, leverage, and profitability on dividend payout and its intensity. The results showed that a negative relationship between the managerial ownership, cash flow sensitivity, firm size, and leverage; however, a positive relationship exists between operating cash flow and profitability with the cash dividend.
Likewise, Al-Kuwari (2010) determined different factors that influenced the corporate dividend payout decision of firms listed on Gulf Cooperation Council (GCC) states by using the panel data of 191 non-financial firms from 1999 to 2003. Radom effects Probit model was used to analyze the impact of government ownership, free cash flow, market capitalization, growth rate, firm leverage, business risk, and firm profitability on dividend payout ratio. The results revealed that the government ownership, company profitability, and company size could be significant predictors of paying dividends. The authors also concluded that payment of dividend may help reduce agency conflicts, save the minority interests, and increase the good reputation of firms in the market.
Besides, Fargher and Weigand (2009) compared the cross-sectional differences between profits, risk of volatile market-to-book value ratio, and returns before and after the initiating regular cash dividend payments for the period commencing from 1964 to 2000. OLS regression was applied in the study. It included different variables such as return on equity, ROA, market-to-book value, market capitalization, debt to asset and profit margin. The results suggested that the payment of dividends is mainly distributed by those firms that are at their maturity stage of life cycle.
Similarly, Ferris et al. (2009) carried out an international analysis of dividend payment behavior by using the sample of 25 countries (nine common law and 16 civil law) from 1994 to 2007. The methodology used a logistic regression model. The results of both common and civil law regimes showed a decreasing trend; however, there was an increasing trend in percentage of non-dividend paying firms. It was, therefore, suggested that a decline in the payment of dividend can affect shareholders’ primacy and initial faith on governance.
In addition, Ahmed and Javid (2009) investigated the determinants of dividend policy in Pakistan by using a sample of 320 non-financial firms listed in KSE from 2001 to 2006. Two parameters Lintner model was used to assess the dividend policy. The results showed that majority of the listed non-financial firms set their dividend policy on the basis of current earnings and dividend per share because both investment opportunity and leverage have inverse relationship on firms’ dividend policy.
Finally, Al-Malkawi (2008) examined the factors influencing corporate dividend policy decision of publicly quoted companies in Jordan. A Probit model was used to investigate a sample of 15 years’ panel data from 1989 to 2003 of 1,137 firms. The results concluded that the firm size, profitability, and the age of the firm are the major factors in making dividend policy decisions. Notably, the study also revealed a negative impact of financial leverage in making dividend policy decisions.
Variable Characteristic in the Expectant of Observed Literature
Dividend payout (DP)
It is a ratio that measures the relationship between the earnings belonging to the ordinary shareholders and the dividend paid to them. It is calculated as dividend paid to shareholders divided by net profit after tax available to equity holders. Dividend payout ratio is used in most of the studies to determine the dividend payment performance for future (Afza & Mirza, 2010; Al-Kuwari, 2010; John & Muthusamy, 2010; Musiega et al., 2013; Ramachandran & Packkirisamy, 2010).
Growth in sales (GS)
It is the amount of increased sales as compared with the previous year. When firms need to increase their sales in future, more funds are needed to finance the level of inventory and cost of goods sold. Therefore, firms have to retain their earnings and cut down the dividend payment (Holder, Langrehr, & Hexter, 1998; Jensen, 1986). Sales growth has a direct relationship with the payment of dividends. As the sales increase in future, payout may also increase.
Earnings per share (EPS)
It measures the profit available to the equity shareholders on a per share basis, or the amount that they can get on every share held. It is calculated by dividing the profits available to the equity shareholders by the number of the outstanding shares. The financial literature provides evidence that there is an increase in dividend payout when earnings per share increase (Ahmed & Javid, 2009; Al-Ajmi & Hussain, 2011; Nnadi et al., 2013).
Leverage (LEV)
It is the employment of an asset or source of finance for which a firm pays fixed cost or fixed return. There are many studies available that identify a negative relationship between dividend payout and leverage (Ahmed & Javid, 2009; John & Muthusamy, 2010; Ramachandran & Packkirisamy, 2010). When firms have to pay fixed amount of cost, then it is seen that dividend payout declines as a result of interest cost payment.
Free cash flow (FCF)
It represents the cash available for payment of dividend and other future business expansion, and is calculated from operating cash flow after subtracting capital expenditure. It represents the cash that a company is able to generate after laying out the money required to maintain or expand its asset base. For payment of dividend, it is very important for the firm to hold free cash flow and it has a significant relationship with the dividend payout (Afza & Mirza, 2010; Fairchild, 2010).
Return on equity (ROE)
Return on equity is the measure of the profitability and an important explanatory variable according to many previous studies (Fama & French, 2001; Fargher & Weigand, 2009; Musiega et al., 2013). It is the ratio of net profit and shareholders’ equity. It is used as the proxy of profitability in most of the situations.
Data and Method
Ferris et al. (2009) conducted an international analysis of dividend payment behavior by using the sample of 25 countries (nine common law and 16 civil law) data from 1994 to 2007. Similarly, the purpose of this study is to analyze the sector-wise dividend payment behavior of KSE-listed companies. The sample period of this analysis is extended from 2009 to 2013. Secondary data have been taken from KSE website and State Bank library/website. For achieving the objectives, this study is divided into two parts. In the first part of the study, data have been taken from all the 32 sectors (financial and non-financial) listed in KSE during the period 2009 to 2013. More specifically, a sample of 475 and 505 listed companies have been drawn from 2009 to 2013, respectively, to analyze the dividend payment behavior among all the 32 sectors. The major reason of taking data from 2009 to 2013 is the availability of complete data set.
In the second part of analysis, data of 21 non-financial sectors were used to find correlation between dependent and independent variables. The reason of elimination of financial firms is the regulation of these firms is very different from non-financial firms, which may affect our results. Then, we exclude six sectors from the sample because some of the sectors have too few firms with the availability of data to allow the statistical technique. Finally, pooled ordinary lest square (POLS) is used for analyzing 15 non-financial sectors for the period 2009 to 2013. Model and variables used in this research were dividend payout (DP) as depended variable and growth in sale (GS), earning per share (EPS), leverage (LEV), free cash flow (FCF), and return of equity (ROE) as independent variables.

Variables Description

Data Analysis
Data analysis section is divided in two parts. In the first part, descriptive analysis provides behavior of all sectors of KSE for the analysis of sector-wise behavior after the financial crisis during the period 2009 to 2013. In the second part, a complete explanatory research is carried out by using the POLS applied on 15 sectors on 5 years’ data (from 2009 to 2013) to check the significance of the variables.
Descriptive Analysis
In first part of this study of sectoral analysis, initially all 33 sectors of KSE had been selected, but one sector data were not available; therefore, it was excluded from our list. The data ranging from 475 to 505 companies were obtained from daily quotation of KSE website from 2009 to 2013. Our selected sectors were oil and gas, chemicals, forestry and paper, industrial metal and mining, construction and materials, general industrial, electronics and electrical equipment, industrial engineering, industrial transportation, support services, automobile and parts, beverages, food producers, households goods, leisure goods, personal goods, tobacco, health care equipment and services, pharma and biotech, media, travel and leisure, fixed-line telecommunication, electricity, gas water and multiutilities, banks, non-life insurance, life insurance, real estate investment and services, financial services, equity investment instruments, software and computer services, and, finally, technology hardware and equipment. In 2009 and 2010, the number of companies were 475.
Table 1 shows sectoral analysis for all 32 sectors in terms of dividend paid or not paid. In 2009, the numbers of dividend payers were 202, which is 43% of the total 475 companies. Similarly, in 2010, numbers of dividend payers were increased to 273, which is 58% of the total 475 companies. This increase occurred mainly in personal goods sector, which in 2009 had 44 companies, whereas in 2010, it was increased to 80 companies out of total 122 companies. Personal goods sector represents textile base companies, which is one of the major sectors of Pakistan in terms of number of firms. It is the second largest manufacturing industry that contributes 8.5% of GDP. Therefore, an increasing trend has been observed in 2010. Non-life insurance sector also increased from 11 to 17 companies in 2009 to 2010, respectively. In equity investment instruments, the same tendency was seen and it was increased from 11 to 31 companies. In the third column, we analyze the percentage changes of dividend payers in 2010. Increasing trend is observed in nine sectors: 33% in industrial metals and mining, 20% in general industries, 82% in personal goods, 12% in food producers, 33% in fixed-line telecommunication, 18% in banks, 55% in non-life insurance, 75% in financial services, and 182% in equity investment instruments. Pakistan is a developing economy and an increasing trend in industrial metals and mining provides sustainable future growth. An increase in general industries is the continuous need of industrial metals for manufacturing support of the country. Increasing demand of technology and cable facility during the last decade was quite remarkable, which boasted this sector, and as a result, the investment amount increased and the payment of dividend has also increased. Expend of economic services has boasted the financial sector of Pakistan, as compared with the past several years. Increasing the number of banks in private sector is the root cause of increase in investment in this sector, which increased dividend payment. Increase in equity instrument shows the investor behavior of individuals and firms toward the maximization of their long-term wealth. The main implications of increase in nine sectors are inter-linked with one and another. This would bring it closer to the investors for making investment decisions.
Sectoral Analysis for All 32 Sectors in Percentages.

There is also a decreasing trend in five sectors, which include 20% in construction and materials, 29% in industrial engineering, 100% in support services, 10% in automobiles and parts, and 20% in household goods. In the last column, the total percentage of dividend payers is given on the basis of total number of companies in each sector, and then the changes in 2009 to 2010 have been taken.
In 2010 and 2011, the number of companies increased from 475 to 484, with major increase in the personal goods sector. Table 2 shows that in 2010, the number of dividend payers was 273, which is 58% of the total 475 companies. In 2011, the number of dividend payers remained almost the same at 272, which is 56% of the total 484 companies. There were multiple factors of this result. Oil and gas sector increased from nine to 12 companies in the period 2010 and 2011. The construction and materials increased from four to 10 companies, and personal goods decreased from 80 to 70 companies during the period 2010 to 2011. In the third column, the percentage changes of dividend payers in 2011 have been given. There is no major difference in the overall percentage change. Increasing trend is observed in eight sectors, which include 33% in oil and gas, 6% in chemicals, 150% in construction and material, 29% in Pharma and biotech, 100% in media, 17% in electricity, 23% in banks, and 12% in non-life insurance. There is also a decreasing trend in 10 sectors, including 20% in industrial engineering, 7% in food producers, 13% in personal goods, 50% in tobacco, 25% in fixed-line telecommunication, 33% in life insurance, 14% in financial services, 3% in equity investment instrument, 100% in software and computers services, and 25% in household goods. In the last column, the total percentage of dividend payers on the basis of total number of companies in each sector has been described, and then the changes in 2010 to 2011 have been taken.
Sectoral Analysis for All 32 Sectors in Terms of Dividend Paid or Not Paid.

In 2012, the number of companies was 505, which was mainly due to personal goods sector. Dividend paying companies were 211, which was fairly due to decreased in almost all sectors including oil and gas, 25%; chemical, 28%; industrial material and mining, 25%; construction and material, 20%; general industries, 17%; industrial transportation, 33%; food producer, 33%; household goods, 33%; pharma and biotech, 44%; media, 50%; fixed-line telecommunication, 67%; banks, 38%; non-life insurance, 68%; and life insurance, 50%.
In 2013, total number of companies was 494, of which 224 companies paid dividend. It was a minor increase as compared with 2012 (211 companies). Major increase was noticed in different industries, for example, general industries, fixed-line telecommunication, and life insurance accounted for 40%, 200%, and 200%, respectively.
Unit Root Test for 15 Sectors
The panel unit root test procedure used to check stationary of the data. This procedure emphasizes the development of combined information from the time-series dimension with that obtained from the cross-sectional dimension, in the hope of making inferences about the existence of unit roots.
In analysis of all sectors, results of Table 3 clearly show all the variables are stationary at first difference, which suggests there is a long-term relationship in the series of variables.
ADF Test: Stationary Test for Different Sectors.
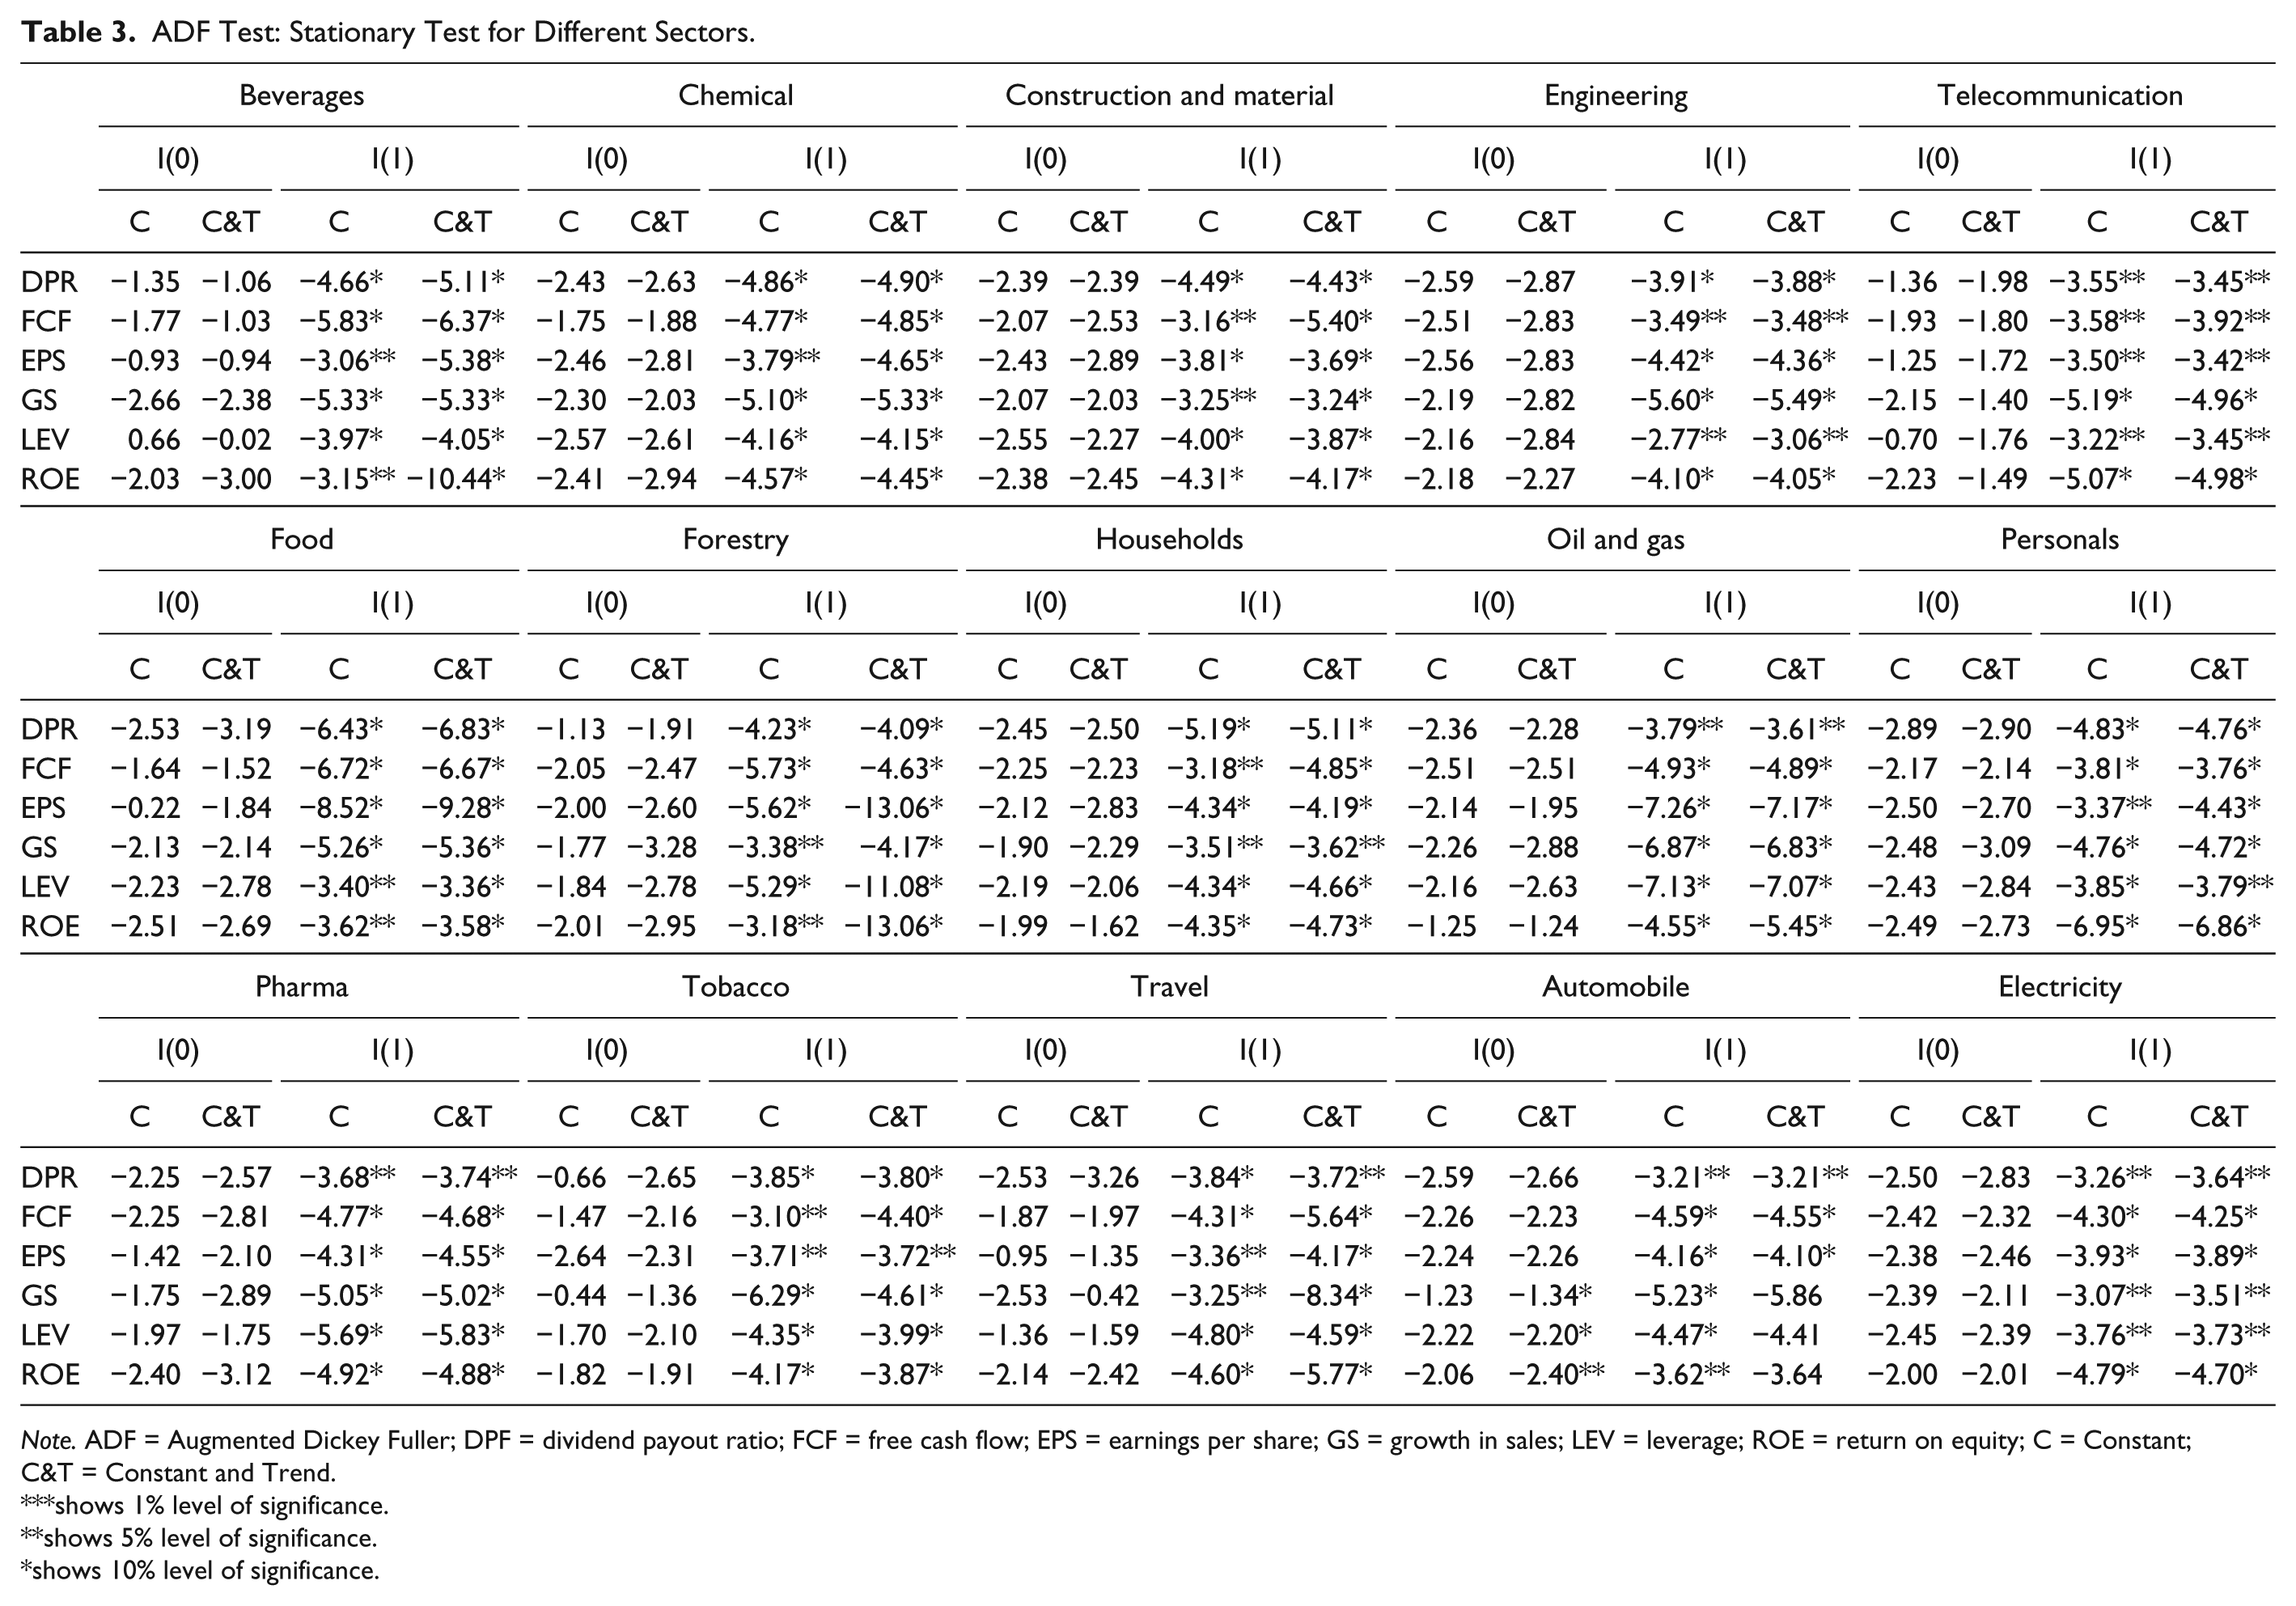
Note. ADF = Augmented Dickey Fuller; DPF = dividend payout ratio; FCF = free cash flow; EPS = earnings per share; GS = growth in sales; LEV = leverage; ROE = return on equity; C = Constant; C&T = Constant and Trend.
shows 1% level of significance.
shows 5% level of significance.
shows 10% level of significance.
After applying stationary test, now data can be analyzed by applying pooled ordinary lest square (POLS) test to check the significance of the model that is developed in the “Data and Method” section.
Estimation for POLS
Results are shown in Table 4. Variables are used to find the relationship among all the sectors with EPS, ROE, GS, LEV, and FCF as independent variables and DP as a dependent variable.
POLS Test for Sectors.
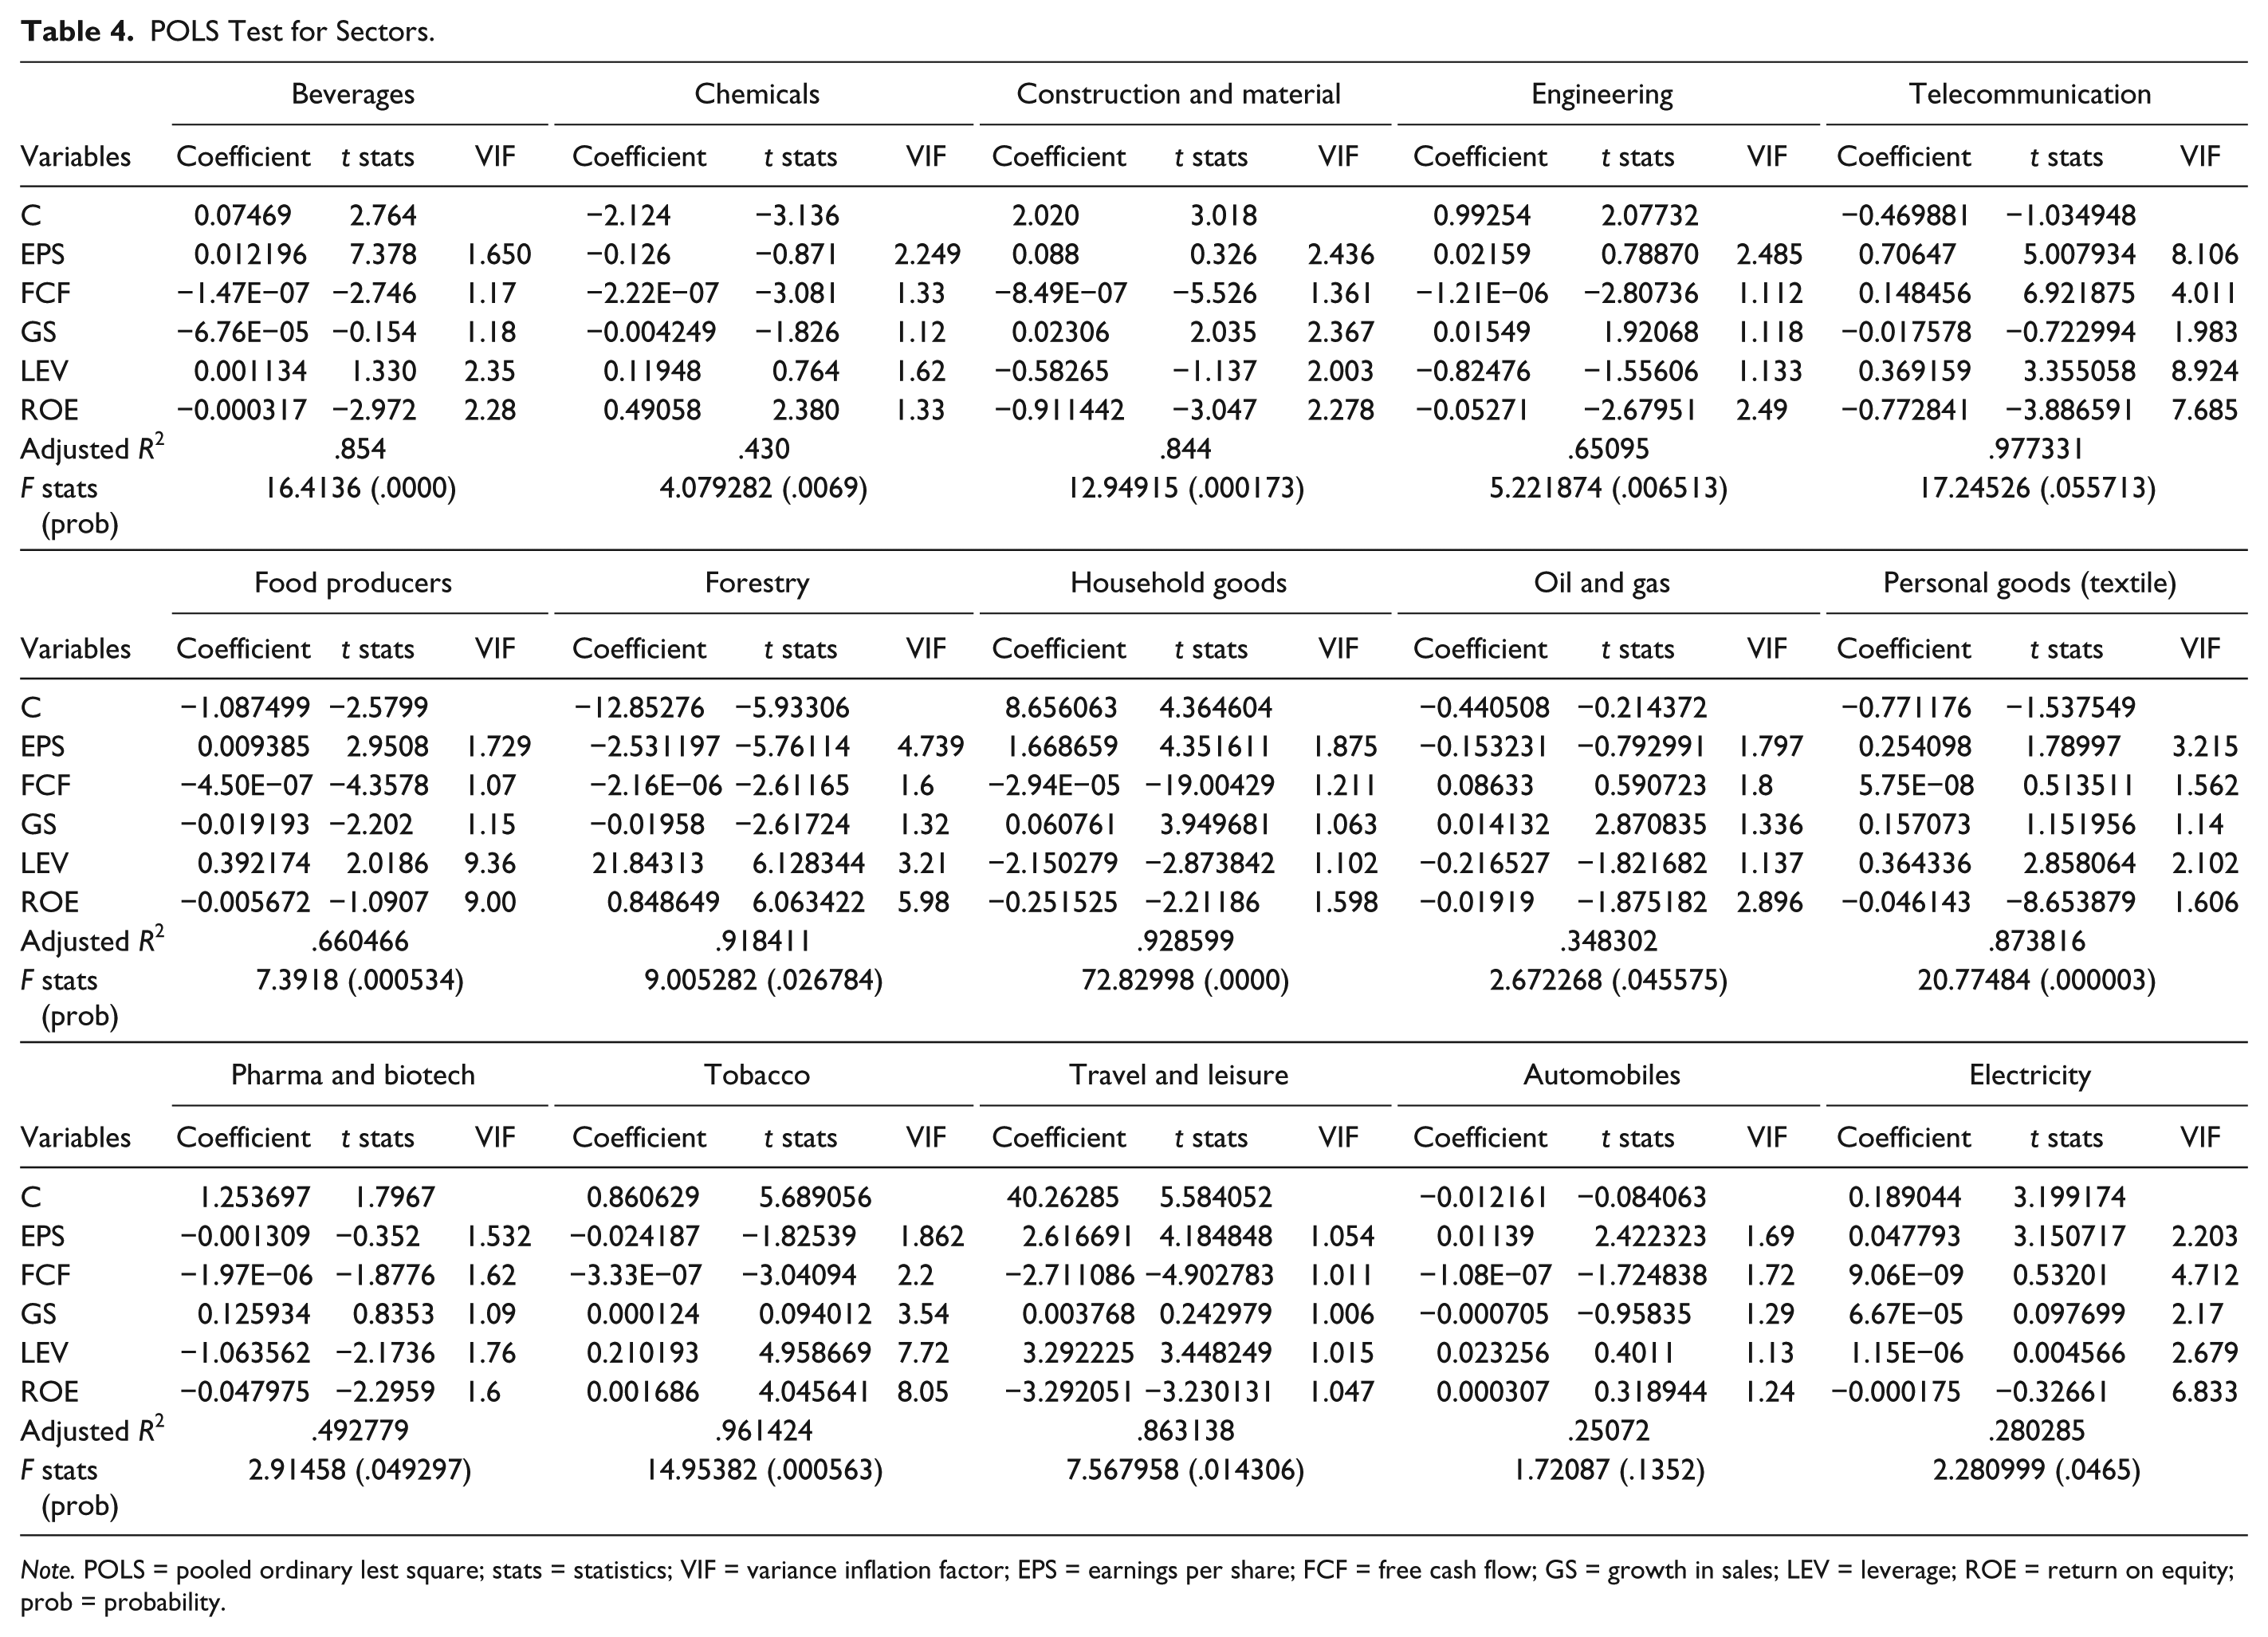
Note. POLS = pooled ordinary lest square; stats = statistics; VIF = variance inflation factor; EPS = earnings per share; FCF = free cash flow; GS = growth in sales; LEV = leverage; ROE = return on equity; prob = probability.
Earnings per share
The results of Table 4 show the EPS has a positive significant impact on DP in beverages, travel and leisure, fixed-line telecommunication, food processors, household goods, personal goods, automobiles, and electricity. This happens when the earnings are increasing and companies want to distribute these earnings to shareholders, whereas forestry (paper and based) has a negative significant relationship with the dividend payout ratio. Earnings per share are generally considered to be the single most important variable in determining a share’s price. This happens due to retention of earnings. It happens, when companies are in growing face, and the procedure of residual dividend policy is a very common phenomenon, in which first companies cover their capital expenditure and then remaining amount would be paid as dividend.
Return on equity
The results of Table 4 show that ROE has significant positive relationship with DP in chemical, forestry, and tobacco sectors (Afza & Mirza, 2010). ROE is the measure of profit; therefore, an increase in the return will cause result to increase in dividend payment. ROE has a negative significant relationship with the DP in oil and gas, construction and materials, engineering, beverages, travel and leisure, fixed-line telecommunication, household goods, personal goods, pharma and biotech, and electricity. ROE is the measure of profit and growth. Benefits of profit come from re-investment in the company, which will give high growth rate in future to investors.
Growth sales
The results of Table 4 show that GS has positive significant impact on DP in oil and gas, construction and materials, engineering, and household goods. Increase in the sales as compared with previous year causes the result to increase in profitability and, as a consequence, would ultimately increase dividend payment, but chemical, forestry, and food producer have a negative significant relationship with the dividend payout ratio. This result shows that company has not been distributing their earnings even if sales are growing. A company’s market share has a big force on its future growth in sales. Sometimes companies want to increase market share, and for this purpose, retaining of earnings is very important.
Leverage
The results of Table 4 show that leverage have a positive significant relationship with DP in forestry, tobacco, travel and leisure, fixed-line telecommunication, food processor, and personal goods. This result is also apparent when companies obtain debt to purchase fixed assets or sometimes total business to increase or diversify in the market. This leads to an increase in stock prices, and in such a situation, companies have to pay dividend, but oil and gas, household goods, and pharma and biotech have a negative significant relationship with the dividend payout ratio (Afza & Mirza, 2010; Ahmed & Javid, 2009; Al-Kuwari, 2010; John & Muthusamy, 2010). It shows as the level of debt or total debt increases in the firm’s capital structure, it may cause deceasing trend in the dividend payment. This phenomenon occurs due to an increase in the amount of interest payment; therefore, leverage may cause a decrease in DP.
Free cash flow
The results of Table 4 show free cash flow has a positive significant relationship with DP in fixed line. The presence of free cash flow is a healthy sign, which indicates that a company has cash for payment of dividends. If a company has a large amount of earnings, but does not have cash, then it will not be able to pay dividends to shareholders. Likewise, chemical, forestry, construction and material, engineering, beverages, tobacco, travel and leisure, food processor, household goods, pharma and biotech, and automobiles have a negative significant relationship with the dividend payout ratio. A negative relationship of free cash flow shows that companies put most of their cash into investment opportunities. This happens when a firm is in liquidity crunch, and needs to purchase inventory and additional working capital for expending credit to customers.
Conclusion and Recommendations
This study investigates the factors that influence dividend payment behavior in KSE by using annual panel data from the period 2009 to 2013. First, descriptive analysis used to provide the sector-wise behavior of dividend payment and non-payment. In the second part of analysis, Augmented Dickey Fuller (ADF) conventional panel unit root test and panel OLS techniques were used. DP was used as a dependent variable and EPS, FCF, GS, LEV, and ROE were used as independent variables.
Results show that EPS has a positive impact on DP in eight sectors (beverages, travel and leisure, fixed-line telecommunication, food processors, household goods, personal goods, automobiles, and electricity), whereas forestry (paper and board) has a negative significant relationship with the dividend payout ratio. Besides, FCF has positive impact on DP in only one sector (fixed-line telecommunication), whereas chemical, forestry, construction and material, engineering, beverages, tobacco, travel and leisure, food processor, household goods, pharma and biotech, and automobiles have a negative impact on DP.
Similarly, GS in sales has a positive impact on DP in four sectors (oil and gas, construction and material, engineering, household goods); however, chemical, forestry, and food processor have negative impact on DP. In addition, LEV has a positive impact on DP in six sectors (forestry, tobacco, travel and leisure, fixed-line telecommunication, food processor, and personal goods), whereas oil and gas, household goods, and pharma and biotech have a negative impact on DP. Moreover, ROE also has a positive impact on DP in three sectors (chemical, forestry, and tobacco); however, oil and gas, construction and material, engineering, beverages, travel and leisure, fixed-line telecommunication, household goods, personal goods, pharma and biotech, and electricity have a negative impact on DP.
It is observed that dividend payment behavior has important connections and transformations among the sectors. Mostly, once a company starts paying dividend, it looks forward to continue this practice. Results document a few characteristics related to the ability to pay dividends among firms based on the profitability, riskiness, and life cycle. The differences that do occur are related to size and growth opportunities.
It can be recommended that firms should focus on its internal policies as all factors that are part of the study relate to the internal financial strength of the firm and most of them are found to be more or less effective. It is also recommended to the managers of the firms to consider external factors when they decide dividend policy. Without considering external factors and characteristics of the firms, making a dividend decision will be imprudent. Investors who desire dividend but not high dividend may focus on either paying or non-paying dividend firms. In contrast, those who desire high dividend should focus on factors that affect payment of dividend. It is also suggested to the policy makers that corporate-level policies have an important impact on liberalization of the stock market. Decreasing the trend of dividend payment may attract the other type of investment opportunities, such as an increase of the foreign investors to channeling of extra funds. At the same time, local investors may be irate with non-payment of the desired level of dividend. Therefore, it is suggested to the policy makers to protect the interest of the domestic investors. A higher level of cash flow is desired, so its maintenance should also be done by taking all necessary measures. Net income is the core reason of all business activities, and it should be given importance because it increases earning per share of the firms. Effective internal management that can help in increasing sales growth should be hired, which will make firms more rewarding for the investors who mostly take their decisions after considering dividend payouts of previous years.
Even though the objective of this study more or less has been achieved, there are certain limitations that need to be addressed. First, due to unavailability of data, sample size is restricted to 5 years (2009-2013) only. Therefore, it is difficult to generalize the results completely. Second, as it is an empirical research, this study is limited to measure and use because environmental properties may affect the results. Further research can be done by considering financial sectors, which are also being considered by investors while taking their investment decisions. Dividend payouts has been used as dependent variable and it is considered as one of the most dependable factors by the investors, but there are other factors that would have been considered by the investors, which can be used for future research, such as corporate governance and internal management.
Footnotes
Declaration of Conflicting Interests
The author(s) declared no potential conflicts of interest with respect to the research, authorship, and/or publication of this article.
Funding
The author(s) received no financial support for the research and/or authorship of this article.