
Abstract
The current study explored the psychometric properties of the newly designed Turkish version of the Cognitive Test Anxiety Scale–Revised (CTAR). Results of an exploratory factor analysis revealed an unidimensional structure consistent with the conceptualized nature of cognitive test anxiety and previous examinations of the English version of the CTAR. Examination of the factor loadings revealed two items that were weakly related to the test anxiety construct and as such were prime candidates for removal. Confirmatory factor analyses were conducted to compare model fit for the 25- and 23-item version of the measure. Results indicated that the 23-item version of the measure provided a better fit to the data which support the removal of the problematic items in the Turkish version of the CTAR. Additional analyses demonstrated the internal consistency, test–retest reliability, concurrent validity, and gender equivalence for responses offered on the Turkish version of the measure. Results of the analysis revealed a 23-item Turkish version of the T-CTAR is a valid and reliable measure of cognitive test anxiety for use among Turkish students.
Test anxiety is a barrier to optimal educational performance that has been widely studied for well over 30 years. Test anxiety research is indeed steeped in international perspectives, with a long tradition of building theory and empirical evidence from diverse cultures. Although there are differences identified in the measurement and impact of test anxiety across different cultures, those differences are generally explained by the variations across contexts related to the educational settings, conditions, or opportunities (e.g., Cassady, Mohammed, & Mathieu, 2004). The prevalence of test anxiety has routinely been estimated to lie somewhere between 25% and 40% of learners reporting they experience some degree of test anxiety (Carter, Williams, & Silverman, 2008; Ergene, 2003; McDonald, 2001; Putwain, 2007). Putwain and Daly (2014) recently clarified this view by reporting that approximately 15% of learners reported they were “highly test anxious.” Perhaps even more concerning is the available evidence suggesting differential levels of test anxiety among certain societal groups. For instance, there is a clear and consistent pattern of results in test anxiety literature suggesting that females as well as members of ethnic minority groups tend to report elevated levels of anxiety (Carter et al., 2008, Ergene, 2003; Hembree, 1988; McDonald, 2001). There is also a concern that not only the percentage of test anxious learners is increasing but also the severity of the perceived anxiety in those learners is on the rise in countries where there is a high degree of academic pressure tied to high-stakes tests (e.g., Casbarro, 2005; Lowe, Grumbein, & Raad, 2011).
Although the literature has provided several orientations to explaining test anxiety and the influence of test anxiety on learners and learner outcomes, there tends to be a general agreement that it is a multidimensional construct, with a two-factor representation serving as the most enduring view. Liebert and Morris (1967) set the field forward with their representation of test anxiety as composed of emotionality and worry, which may also be conceptualized as affective and cognitive test anxieties. The emotionality aspect of test anxiety is identified through biological and physiological responses to anxiety (e.g., elevated heart rhythm [HR], headaches, cortisol production; Deffenbacher, 1980; Hembree, 1988; Mattarella-Micke, Mateo, Kozak, Foster, & Beilock, 2011). The cognitive—or worry—component attends to manifestations including (a) self-deprecating thoughts, (b) distractibility during study and test-taking, (c) comparisons with peers, (d) perceiving tests as threats to self-esteem and peer status, (e) avoidance of test preparation and evaluative situations, and (f) impaired study skills and cognitive processing (e.g., Naveh-Benjamin, 1991; Sarason, Pierce, & Sarason, 1996; Zeidner, 1998; Zeidner & Matthews, 2005). Recently, there has also been attention given to a social dimension of test anxiety that may expand the understanding of the coping strategies learners use when faced with high-anxiety situations (e.g., Friedman & Bendas-Jacob, 1997; Lowe et al., 2011).
Several examinations of the multidimensional nature of test anxiety have converged on the determination that the cognitive dimension of test anxiety is more directly linked to performance declines in learners (Cassady, 2010). This is generally explained through either a skills deficit orientation (i.e., poor cognitive skills and testing strategies lead to failures; Covington, 1985; Naveh-Benjamin, 1991) or a cognitive-interference perspective (i.e., attentional resources directed toward nontask activities; Sarason, 1988). Both perspectives have merit, and likely explain the experience of a diverse array of test anxious learners; that is, there are multiple manifestations of the commonly reported construct of test anxiety (Zeidner & Matthews, 2005). In both of these orientations, it is important to recognize that the impact of test anxiety on the learner and her or his outcomes is not restricted to the testing situation itself. Rather, across all phases of the “Learning-Testing Cycle,” test anxiety can have an impact that will decrease overall performance. As such, test anxiety affects the learners’ experience during test preparation, test performance, and test reflection (Rafferty, Smith, & Ptacek, 1997; Schwarzer & Jerusalem, 1992).
Assessment of Cognitive Test Anxiety
The Cognitive Test Anxiety Scale (CTAR; Cassady & Johnson, 2002) was developed to assess only the cognitive aspects of test anxiety, across the learning–testing cycle. The scale has been used in the United States (e.g., Bourne, Arend, Johnson, Daher, & Martin, 2006; Cassady, 2004a, 2004b; Ramirez & Beilock, 2011), Great Britain (Kapetanaki, 2010), and Greece (Tsianos, Lekkas, Germanakos, Mourlas, & Samaras, 2009); it has also been effectively translated for use in China (Chen, 2007; Zheng, 2010), Kuwait (Cassady et al., 2004), Iran (Baghaei & Cassady, 2014), and Argentina (Furlan, Cassady, & Perez, 2009). Sparked in large part by these cross-cultural validation studies, the CTAR has been revised to eliminate reverse-coded items that were determined to measure a separate construct (i.e., “test confidence”; Cassady & Finch, 2014). The current Cognitive Test Anxiety Scale–Revised (CTAR) is a 25-item measure that is composed largely of the original items from the CTAR.
Test Anxiety in Turkey
Effective research on test anxiety in new cultural settings can only be realized in the socio-cultural framework of the educational setting within which students experience academic stressors. Similar to other European countries, secondary education students in Turkey face high levels of stress related to testing due to several layers of highly competitive educational assessments used to determine access to University programs (Dereli, 2003; Kutlu, 2001). Specifically, higher education admissions in Turkey are dependent on (a) student performance in secondary education, (b) determined quality of the secondary school the student attended, and (c) a two-stage national-level central exam (Gür & Çelik, 2009). In this system, likelihood of admission in post-secondary programs has been traditionally highly dependent on the quality—or reputation—of the high school they attended (Gür & Çelik, 2009). The creation of central exams was intended in part to mitigate potential inequality in admissions deliberations (İcbay, 2005). However, there continues to be concern that mismatches between high school educational curriculum and the central assessments contributes to considerable difficulties and uneasiness for students (Gür & Çelik, 2009).
Available data suggest Turkish universities are highly selective with admissions. A recent examination conducted by the OSYM Student Selection and Placement Center (2014) revealed that more than 2 million students applied for post-secondary study in Turkish universities—including both undergraduate and graduate levels. Of these students, approximately 600,000 were accepted for admittance into graduate-level programs with an even smaller amount being accepted—approximately 400,000—for undergraduate study. This competitive climate for attaining access to quality higher education naturally sparks concerns for high school students in Turkey (İcbay, 2005; Kutlu 2001). In fact, the rates of reported test anxiety reported by students preparing to take the Turkish national exams were higher than general reported levels (Aydın & Yerin, 1994; Pınar-Başpınar, Dereboy, & Eskin, 2012). One study found that 47% of students preparing for the Turkish national exam reporting having test anxiety (Dereli, 2003), and another line of work claimed that 84.1% reported either moderate or high levels of test anxiety (Gençdoğan, 2006).
Current Investigation
The CTAR is not unique in having an international presence—several measures have been adapted for use in various cultures and languages (e.g., Friedman & Bendas-Jacob, 1997; Sarason, 1984; Spielberger, 1980)—including Turkish versions. However, the CTAR has some specific appeal for use in research as it is widely validated, specifically targeted on the cognitive domain, as well as free and easily accessed. The current study is the first known exploration of a Turkish version of the CTAR, with the additional focus on examining the relationship of the measure to the previously validated Turkish version of the Test Anxiety Inventory (TAI; Öner & Kaymak, 1987; Spielberger, 1980) and specific exploration of cognitive test anxiety in a high school population at the precipice of the high-stakes testing event that determines successful matriculation into higher education programs. We believe these multinational investigations are essential to expand the growing understanding of academic anxieties in a myriad of cultural contexts—with particular attention to unique experiences for traditional underrepresented or underserved groups.
Method
Participants
Data were collected from high school seniors (N = 1075, 55% female) attending secondary schools located in Izmir between November 2014 and March 2015. The city of Izmir is located in the west, and it is one of three metropolises in Turkey. There are numerous educational institutions in this region which include both upper and lower levels of academic success. Researchers obtained written permissions from participants and an ethics committee approval from Izmir Directorate of Education. Mean age for the sample was 17.31 years (SD = 0.55).
Measures
Text Anxiety Inventory (TAI)
The TAI (Spielberger, 1980) is a 20-item measure designed to assess the multidimensional nature of test anxiety. Participants indicated their typical reactions to evaluative situations using a 4-point Likert-type scale (1 = never, 4 = always). TAI items can be used to create two subscales assessing the Worry and Emotionality dimensions of test anxiety—as well as an indicator of overall levels of test anxiety. Previous examinations have demonstrated that the TAI possesses acceptable levels of internal consistency (Worry, α = .93; Emotionality α = .94) and is a valid indicator of test anxiety among members of the Turkish populations (Öner, 1990; Öner & Kaymak, 1987).
CTAR
The CTAR (Cassady & Finch, 2015) is a 25-item revision of the original CTAR (Cassady & Johnson, 2002) that is designed to assess the cognitive indicators of test anxiety. Participants reported how well each of the presented items describes them using a 4-point Likert-type scale (1 = not at all like me, 4 = very much like me). Previous work with the CTAR has demonstrated that the measure is a reliable and valid measure of the cognitive test anxiety construct (Cassady & Finch, 2015).
Procedure
Translation of CTAR
Three fluent English–Turkish bilinguals were recruited to translate the CTAR from English into Turkish for use in the current examination. To maximize the validity of the cultural adaptation of the measure, translators were instructed to emphasize transliteral equivalence between the English and Turkish versions of the CTAR. As result, certain phrases were modified to reflect the educational structure of Turkish society. For example, in the Turkish educational system, the phrase “final exam” is only used within the context of post-secondary education. Therefore, the wording on Item 11 of the CTAR was translated from “I tend to freeze up on things like intelligence tests and final exams” to “I tend to freeze up on important exams” to ensure the statements evoked similar meaning among high school and university students.
First, we administered the Turkish version of the CTAR to a small group of students similar to the population of interest (n = 10) to ensure that typical high school learners were able to effectively respond to the newly translated items as initially prescribed. They reported some words in scale (e.g., “final exam”) were not appropriate for common use in their high school settings. Next, we shared those students’ responses and the Turkish version of the CTAR with a panel of six independent experts who rated (a) the validity of language used with the Turkish translation and (b) the overall meaning of items included in the Turkish version. This process was undertaken to ensure that the translation focus on transliteral equivalence was reached—which ensures that the newly translated version will focus on the same construct rather than merely mimic the words in the original survey (Hocevar & El-Zahhar, 1992). Based on these two initial validation checks of the language, minor changes were made to the measure. At that point, the Turkish version of the Cognitive Test Anxiety Scale–Revised (T-CTAR) was backtranslated from Turkish back into English by a linguist who subsequently compared the semantic equivalence of the English and Turkish versions of the scale.
Primary data collection
All participants were volunteers who provided informed consent prior to taking part in the study. Participants in the current examination completed a structured questionnaire form containing a general information questionnaire (i.e., demographic questionnaire), the Turkish version of the TAI (Öner & Kaymak, 1987), and the Turkish version of the CTAR (Cassady & Finch, 2015). The participants completed each measure in classrooms located on their respective high school campuses. The experimental procedure took approximately 10 min to complete, and each participant completed the experimental materials individually.
Results
Descriptive Statistics
The mean scores and standard deviations for each measure are presented in Table 1.
Means and Standard Deviations for TAI (Total), TAI–Worry Subscale, TAI–Emotionality Subscale, and the Turkish Version of the CTAR.

Note. TAI = Text Anxiety Inventory; CTAR = Cognitive Test Anxiety Scale–Revised; T-CTAR = Turkish version of the Cognitive Test Anxiety Scale–Revised.
Structural Validity of T-CTAR
To explore the structural validity of the T-CTAR, we randomly split the full 1,075-participant sample into two random halves. An exploratory factor analysis (EFA) was conducted on Sample 1 (n = 536) using Principle Axis Factoring with the Promax rotation. The EFA was conducted using the Statistical Package for the Social Sciences (SPSS; Version 21). The scree plot, Kaiser’s greater than one criterion (Kaiser, 1970), and parallel analysis (Horn, 1965) were used to determine the number of factors to be retained. Kaiser’s greater than one criterion and parallel analysis suggested that a four-factor solution was optimal. However, examination of the scree plot revealed a single dominant factor accounting for a large amount of the total variance. We decided on a single-factor solution as it was interpretable, supported by previous research exploring the dimensionality of the CTAR (Cassady & Finch, 2015), and accounted for 38.8% of the total variance (see Table 2 for factor loadings). Two items were dropped (Items 22 and 24) from the factor solution because their factor loadings fell below the commonly used criterion value of 0.30 (Tabachnick & Fidell, 2013). This decision is further supported by prior findings with the English version of the CTAR that identified questionable fit for Item 24 (Cassady & Finch, 2015).
Factor Loadings for Exploratory Factor Analysis With Promax Rotation of CTAR Items.

Note. CTAR = Cognitive Test Anxiety Scale–Revised.
Item removed from the final model, English translation available within Cassady and Finch (2015).
Next, a confirmatory factor analysis (CFA) using the diagonally weighted least squares estimation method was conducted on Sample 2 (n = 539) to explore the validity of the single-factor solution identified in the EFA described above. CFA analyses were performed in R 3.3.1 (R Core Team, 2016) using the Lavaan package (Rosseel, 2012). Results of the CFA suggested that the single-factor, 23-item solution provided an excellent fit to the data, comparative fit index (CFI) = 0.988, Tucker–Lewis index (TLI) = 0.987, root mean square error approximation (RMSEA) = 0.041, standardized root mean square residual (SRMR) = 0.053. We next compared the fit of the 25-item soluction proposed in prior work to the 23-item solution. Results demonstrated the 23-item solution had superior fit to the data, CFI = 0.984, TLI = 0.982, RMSEA = 0.044, SRMR = 0.056. However, results of both factor solutions demonstrate the Turkish CTAR provides a durable unidimensional solution to the construct of cognitive test anxiety that is consistent with the initial conceptualization measured by the original English version (Cassady & Johnson, 2002). Although both factor solutions demonstrate sufficient model fit, review of the item statistics as well as consideration of the meaning of the items within the cultural context of Turkey led to the decision that the most appropriate version for use in research in the Turkish version is the 23-item version (see Table 2).
Reliability of T- CTAR
An additional group of high school students (n = 30, 50% female) from the Izmir region were recruited to explore the reliability of the T- CTAR. The composition of the subsample was found to be consistent with that of the sample utilized during primary data collection. Mean age for the subsample was 17.5 years (SD = 0.51).
Pearson product–moment correlation coefficient revealed a strong positive correlation between Time 1 and Time 2 scores, r = .93, p < .001, suggesting the T-CTAR provides stable estimates of cognitive test anxiety across time. The internal consistency of the 23-item T-CTAR was found to align with prior studies, illustrating an excellent level of internal consistency (Cronbach’s α = .93). These results are consistent with prior research demonstrating the stability of scores on cognitive test anxiety in a sample collected in the United States (Cassady et al., 2004). Correlational analyses were conducted using the SPSS software (Version 21).
Concurrent Validity: TAI
To explore the concurrent validity of the Turkish CTAR, we computed Pearson product–moment correlation coefficients by assessing the relationship between the Turkish CTAR and the well-established TAI (Spielberger, 1980). Correlation analyses were once again conducted using the SPSS software (Version 21). Prior studies with various measures of test anxiety have repeatedly demonstrated that the theoretically separate dimensions of test anxiety tend to share moderate to high positive correlations (Kalechstein, Hocevar, Zimmer, & Kalechstein, 1989; Sarason, 1984). As such, we anticipated the Turkish CTAR would be positively related to the two subscales as well as the total score for the TAI. However, given the conceptual alignment between cognitive test anxiety and worry, we anticipated these two scores would share the highest correlation.
Results of the analysis revealed strong positive correlations among the test anxiety measures used in this study (see Table 3). The correlations among the T-CTAR and the Worry and Emotionality subscales of the TAI were similar, with a slightly higher correlation observed between T-CTAR and Worry. This is in line with the theoretical intent of the T-CTAR, providing good indication of concurrent validity for the new T-CTAR. The positive relationship with the Emotionality scale is not surprising—that is, cognitive test anxiety is not separate from the emotionality construct. Prior studies with the original CTAR have routinely demonstrated similar correlations with Sarason’s (1984) Bodily Symptoms subscale from the Reactions to Tests measure, which is a similar measurement device for emotionality (Cassady, 2004a, 2004b). Furthermore, observation of the relationships between the two subscales of the TAI for this sample illustrate an exceedingly high correlation, limiting the potential to detect evidence of divergent validity in the relationships among CTA and the separate TAI subscales. The higher value observed for the relationship with TAI–Total can be fully explained by (a) the overlap of the subscales and the total scale score and (b) simple expectations offered by the Spearman–Brown prophesy formula for reliable measurement (Nunally & Bernstein, 1994).
Pearson Product–Moment Correlation Coefficient for T-CTAR With TAI–Emotionality Subscale, TAI–Worry Subscale, and TAI–Total Score.

Note. N = 1,075 for all analyses. TAI = Text Anxiety Inventory; T-CTAR = Turkish version of the Cognitive Test Anxiety Scale–Revised.
p < .001.
Differential Item Functioning (DIF) Analysis for Gender
Prior investigations exploring the prevalence of cognitive test anxiety have provided evidence noting that females often report experiencing higher levels of cognitive test anxiety than their male counterparts during evaluative events (Carter et al., 2008; Ergene, 2003; Hembree, 1988; McDonald, 2001; Putwain, 2007). Therefore, it was decided to examine gender equivalence for responses offered to items on the T-CTAR using DIF techniques. We believe continued attention to these effects with more specific analyses such as DIF can help illuminate if the noted differences are driven by specific features, manifestations, or aspects of test anxiety to better capture the population differences in perceived and experienced test anxieties.
DIF is considered to be present in a measure when respondents from distinctive groups differ in their probability of endorsing certain responses after controlling for the underlying trait being assessed (Choi, Gibbons, & Crane, 2011; Clauser & Mazor, 1998). In the current examination, DIF was assessed using an hybrid, iterative, ordinal logistic regression method that utilizes techniques common to item response theory to identify—and control for—levels of the latent trait under examination (Choi et al., 2011). The use of an iterative, hybrid ordinal logistic regression method provides several advantages in the current examination as it allowed for an examination of uniform, nonuniform, and total DIF effects for each of the T-CTAR Items. DIF analyses were performed in R 3.3.1 (R Core Team, 2016) using the lordif package (Choi et al., 2011).
Results of the DIF analysis revealed 10 items that were functioning differentially between males and females after controlling for overall levels of cognitive text anxiety. Because DIF screening using ordinal logistic regression techniques is based on the likelihood ratio statistic, some have expressed concern that given a large enough sample size the test will produce statistically significant, albeit meaningless, differences in item functioning (Choi et al., 2011). Therefore, the magnitude of the DIF effects in the current analysis were examined using the criteria set forth Zumbo (1999) where pseudo R2 values exceeding .13 signaled meaningful differences in item functioning. Examination of the pseudo R2 values for each items exhibiting DIF revealed no pseudo R2 values exceeded .01 for tests exploring uniform, nonuniform, and total DIF effects. These findings suggest that although statistical differences in item functioning were detected between the genders, items on the T-CTAR were functioning equivalently for males and females in the current sample. Items identified as possessing DIF and pseudo R2 values for the tests of uniform, nonuniform, and total DIF are presented in Table 4.
Summary of DIF Analysis Comparing Response Patterns of Males and Females on the T-CTAR.
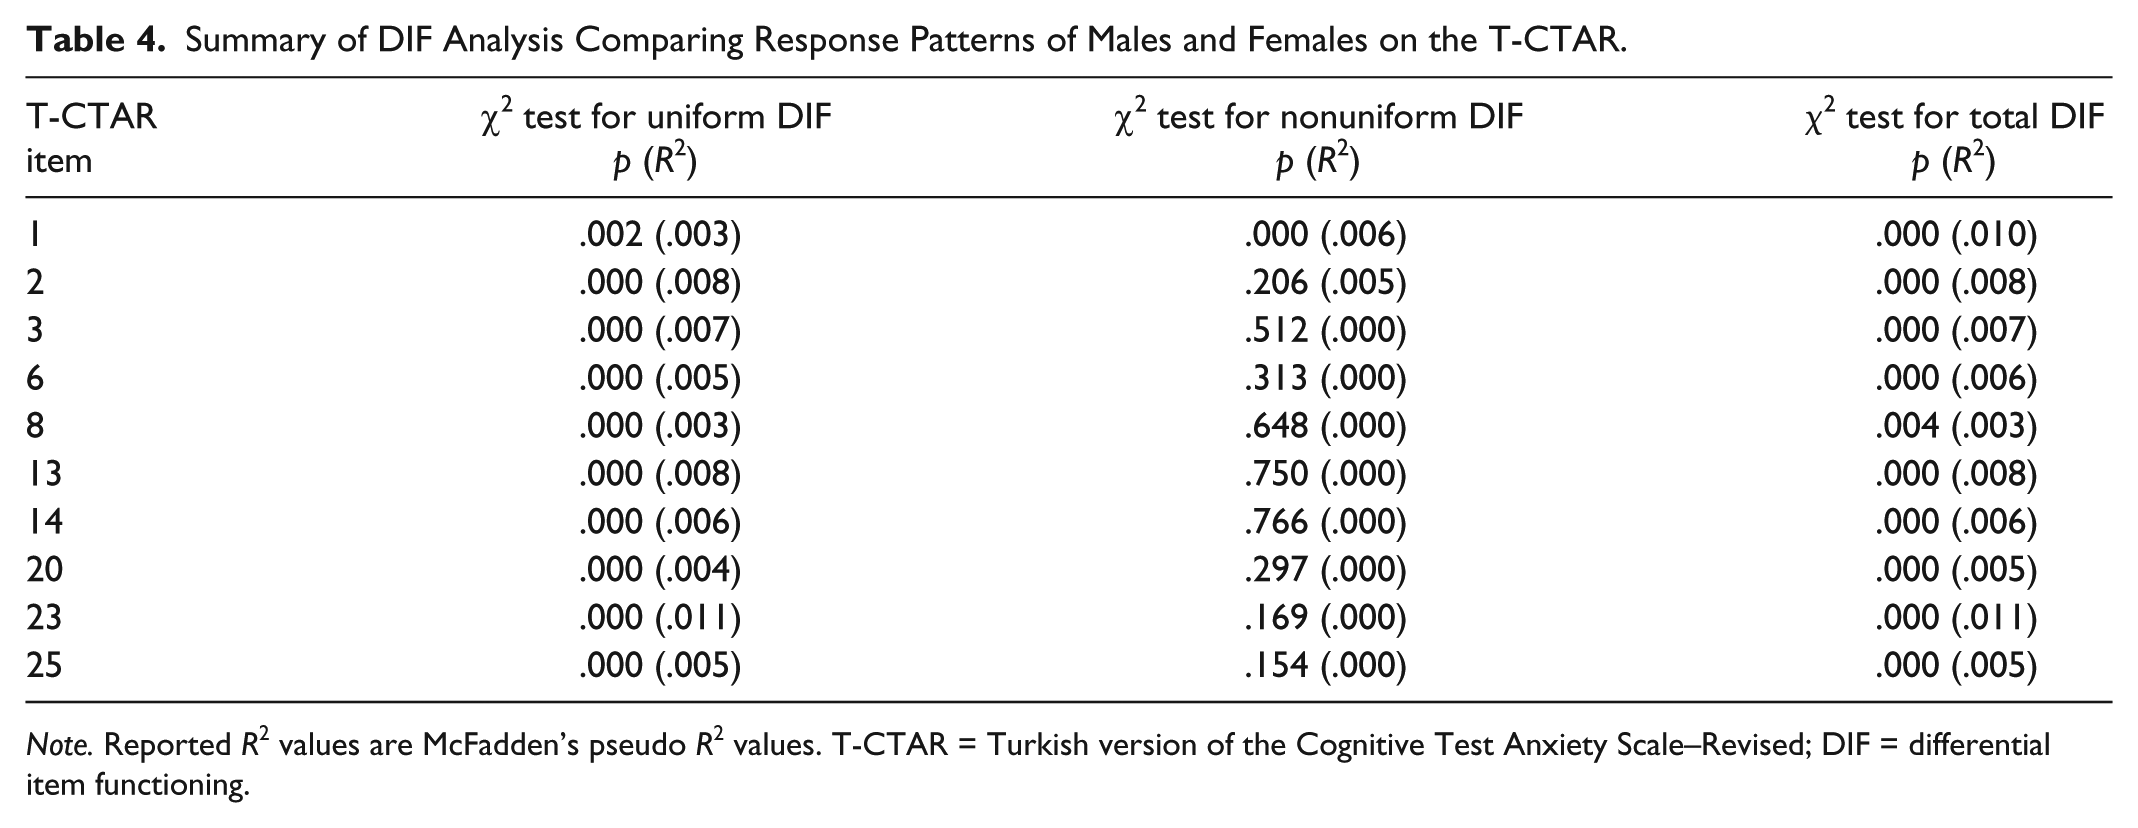
Note. Reported R2 values are McFadden’s pseudo R2 values. T-CTAR = Turkish version of the Cognitive Test Anxiety Scale–Revised; DIF = differential item functioning.
Gender Differences in the Experience of Test Anxiety
To compare gender difference in the perception and experience of cognitive test anxiety, an independent samples t test was conducted comparing levels of test anxiety reported by males and females on the T-CTAR. Results of the analysis revealed females reported significantly higher levels of cognitive test anxiety (M = 53.75, SD = 15.03) than males (M = 49.18, SD = 14.74) on the T-CTAR, t(1072) = 4.99, p < .001, d = 0.30. These results support previous findings suggesting that females often report higher levels of test anxiety than their male counterparts (Cassady, 2010; Ergene, 2003; Hembree, 1988) and, when considered in conjunction with the previously described DIF analysis, suggest the observed gender differences cannot be attributed to the differential functioning of items contained in the T-CTAR.
Discussion
The primary focus of this study was to test the viability of a newly designed T-CTAR in measuring levels of cognitive test anxiety in a sample of high school students in the final year of secondary education. In addition, the study was designed to examine the relationships among the T-CTAR and the well-established Turkish version of the TAI.
Translation efforts resulted in a measure that students and experts alike agreed provided a valid treatment of the test anxiety construct for use in educational and research contexts. Furthermore, investigation of the factorial structure for the T-CTAR demonstrated that while the 25-item single-factor solution is viable, a 23-item solution was superior. For both versions, the results confirmed a line of research illustrating that the core items in the T-CTAR and CTAR can represent a central construct of cognitive test anxiety that is most readily conceived as a single dimension when examining the general population (Cassady & Finch, 2015).
The analyses also provided compelling evidence that two items from the English version of the CTAR should be removed (Items 22 and 24). Item 24 was also identified as problematic for achieving optimal fit in prior work with the English version (Cassady & Finch, 2015) and addresses the notion that “luck” plays a role in successful test performance. The repeated failure of this item to fit well within the cognitive test anxiety construct suggests it is not a good item for future use. This particular item raises another issue of cultural context that bears attention in studies of test anxiety in a multicultural framework. The concept of “luck” was raised in prior studies with diverse populations who viewed any issues of chance or luck to be determined in a religious or spiritual context. Within different religious and cultural frameworks, the concept of luck may very well carry different meaning and further supporting removal. Item 22 addresses focuses on recognizing mistakes after completing tests—which may be peripherally related to test anxiety but not a direct component characteristic. Although the item has performed reasonably in prior versions, it was clearly not a useful item in the T-CTAR.
Further analyses demonstrated that the gender differences observed in total cognitive test anxiety (including in this study) were not a measurement artifact deriving from inappropriate DIF for specific items on the T-CTAR. As such, the data illustrate that males and females respond in a functionally similar way for the collection of 23 items on the T-CTAR. Consequently, gender differences noted in overall T-CTAR scores can be presumed to illustrate a generally higher level of cognitive test anxiety for high school females in Turkey than their male counterparts. This pattern is consistent with a long history of research in test anxiety and other measures of negative affective responses (e.g., Hembree, 1988; Kapıkıran, 2002; Putwain & Daly, 2014), but the advantage of the data in this study is that the specific focus on item-level differences among males and females has been ruled out as a source of meaningful explanation for gender differences.
The study also supported that the T-CTAR was a valid and reliable measure of test anxiety, as demonstrated in the high internal consistency and theoretically consistent pattern of convergent validity observed when assessed alongside the Turkish version of Spielberger’s (1980) TAI. The data did not follow primarily expected patterns because the correlations between T-CTAR and the subscales of the TAI did not diverge as anticipated. However, this was revealed to be more of an issue with the extremely high correlation between the subscales in the TAI, precluding effectively identifying divergent validity with the current measures.
Footnotes
Declaration of Conflicting Interests
The author(s) declared no potential conflicts of interest with respect to the research, authorship, and/or publication of this article.
Funding
The author(s) disclosed receipt of the following financial support for the research and/or authorship of this article: Portions of this work were supported by the Research Design Studio at Ball State University and the Ball State University Aspire Grants program.