
Abstract
The 17-item revised version of the Cognitive Test Anxiety Scale (CTAR-17) was translated into Persian to be used for Iranian students. In this study, we used the Rasch rating scale model to examine the psychometric qualities of the translated scale in terms of dimensionality, use of response category, sample appropriateness, and reliability. A total of 297 undergraduate university students were administered the CTAR-17. Results indicated that the scale enjoyed acceptable reliability and the 4-point category scale functioned optimally. Perfect fit to the Rasch rating scale model was achieved once four items were deleted from the scale. Findings suggest that a 13-item brief version of CTAR-17 in Persian is a valid measure of cognitive test anxiety and can be used in treatment programs and future cross-cultural research on test anxiety.
Introduction
Cognitive Test Anxiety (CTA)
Research in the field has long recognized that there are at least two primary forms of test anxiety, classically referred to as worry and emotionality (Liebert & Morris, 1967; Sarason, 1961). Throughout the 1980s and 1990s, refinement of the test anxiety construct consistently identified the emotionality component to include primarily physiological responses to anxiety-producing evaluative events, which included elevated heart rate, headaches, dizziness, and feelings of panic (e.g., Deffenbacher, 1980; Hembree, 1988; Sarason, 1984). Conversely, the worry component included a variety of manifestations, including (a) self-deprecating ruminations, (b) distractibility during study and test-taking, (c) comparisons with peers, (d) worry about the impact of tests on self-esteem and peer status, (e) avoidance of test preparation and evaluative situations, and (f) impaired study skills and cognitive processing (e.g., Cassady, 2010; Naveh-Benjamin, 1991; Sarason, Pierce, & Sarason, 1996; Zeidner, 1998; Zeidner & Matthews, 2005). This range of beliefs and behaviors related to testing promoted attending to the traditional aspect of “worry” as a broader construct known as CTA (Cassady, 2010; Cassady & Johnson, 2002). Simultaneously, greater attention to the learners’ experiences across three phases of the learning–testing cycle—test preparation, test performance, and test reflection (Cassady, 2004b; Schwarzer & Jerusalem, 1992)—has enabled a greater degree of attention to various types of test anxiety experiences for learners encountered before, during, and after exams (Rafferty, Smith, & Ptacek, 1997).
Zeidner and Matthews (2005) proposed a detailed typology identifying six forms of test anxiety that accounted for the different types of reactions experienced by learners with test anxiety. The first type is referred to as Study or Testing Skill Deficiencies—students with CTA have been traditionally shown to display poor study skills, inappropriate testing strategies, and basic cognitive issues such as poor working memory and organization skills (Naveh-Benjamin, 1991). The second type, Anxiety Blockage and Retrieval Failure, is demonstrated by learners who have acquired information but fail to successfully retrieve it during an evaluative event (Covington, 2000; Covington & Omelich, 1987). The third type of test anxious learners is known as Failure-Accepting; those learners who have adopted a learned-helplessness orientation to testing events and “give up” trying to adequately prepare (Cassady, 2004b). In Zeidner and Matthews’s typology, the fourth group is Failure-Avoidant, characterized by heightened rates of procrastination, performance-avoidance goal structures, and attempts to limit threat by avoiding difficult tasks (Elliot & McGregor, 1999; Lay, Edwards, Parker, & Endler, 1989; Stoeber & Joormann, 2001; Wolters, 2003). The fifth group (Self-Handicappers) also tends to engage in avoidance behaviors, but the individual will also refer to those barriers (“I didn’t have time to study” or “I lost my book”) as attributions for the failure, preserving self-esteem and self-concept by externalizing their failures (Thomas & Gadbois, 2007; Urdan, 2004). Finally, the sixth group (Perfectionists) have excessively high performance standards, are overly critical of personal performances, and consequently enter study and testing situations with elevated levels of perceived threat for testing events (Eum & Rice, 2011; Kawamuri, Hunt, Frost, & DiBartolo, 2001; Stoeber, Feast, & Hayward, 2009).
The prevalence of CTA in standard educational settings demonstrates the importance of the construct. Systematic studies have demonstrated that between 25% and 40% of learners experience one form of test anxiety or another, with higher rates noted for ethnic minorities and females in particular (Carter, Williams, & Silverman, 2008; Ergene, 2003; McDonald, 2001; Putwain, 2007). Furthermore, there is concern that prevalence rates may be rising due to the progressive increases in reliance on standardized measures of performance in making critical decisions in schools (e.g., Lowe, Grumbein, & Raad, 2011). This increase in prevalence for test anxiety suggests that a growing number of students will experience academic failure (e.g., Ramirez & Beilock, 2011), even in situations where the evaluations hold no external evaluative pressure (Cassady, 2004a; Cassady & Gridley, 2005; Naveh-Benjamin, 1991; Zeidner & Matthews, 2005).
Assessment of CTA
Building upon the work examining the construct of test anxiety from varied perspectives that identified worry and emotionality aspects of test anxiety, including Sarason’s (1984) Reactions to Tests and Spielberger’s (1980) Test Anxiety Inventory, the Cognitive Test Anxiety Scale (CTAS) was developed to focus explicitly on the broad array of indicators generally referred to as worry, with greater attention to all phases in the learning–testing cycle (Cassady & Johnson, 2002). The focus on the cognitive (and not the emotionality) aspects of test anxiety was driven by Hembree’s (1988) meta-analysis and relevant research, demonstrating that the cognitive dimension (i.e., “worry”) was the component of test anxiety that had the greatest negative impact on performance. The CTAS has been validated and used as a self-report instrument in various settings, including the United States (e.g., Bourne, Arend, Johnson, Daher, & Martin, 2006; Cassady, 2004a, 2004b; Ramirez & Beilock, 2011), Great Britain (Kapetanaki, 2010; Putwain & Daniels, 2010), and Greece (Tsianos, Lekkas, Germanakos, Mourlas, & Samaras, 2009). Translation of the scale into Chinese (Chen, 2007; Zheng, 2010), Arabic for use in Kuwait (Cassady, Mohammed, & Mathieu, 2004), and Spanish for native Argentinians (Furlan, Cassady, & Perez, 2009) demonstrated that the scale was also valid across cultural contexts and useful for examining cross-cultural patterns of test anxiety. However, sparked in large part by the careful scrutiny applied during translation attempts in the Argentina sample, analyses of the original items in the CTAS demonstrated that the use of reverse-coding on the original scale produced a secondary factor that had been previously undetected in original scale validation efforts, perhaps due to more sensitive measurement methods available in the later analyses (Cassady & Finch, 2014; Furlan et al., 2009). Review of factor analyses for both Argentinian and U.S. samples revealed that the structure of the original 27-item CTAS could be explained with a two-factor model that included “cognitive test anxiety” and “test confidence,” with the latter containing all the reverse-coded items. The original intention of the reverse-coded items in the CTAS was based on the zeitgeist of measurement at the time to avoid response set biases in respondents (Nunally & Bernstein, 1994).
A large scale comparative analysis of the optimal factor structure for the original CTAS confirmed that the originally proposed single-factor solution, the updated two-factor view, as well as a shortened version of the scale (dropping the reverse-coded items), were all viable solutions for interpreting the data from that scale (Cassady & Finch, 2014). However, the finding prompted a revision process for the CTAS to ensure optimal measurement of the CTA construct. The revision process involved reviewing the item data for the original scale and creating additional items that were consistent with the view that CTA is a construct that is present in all three phases of the learning–testing cycle. In the end, 25 items were initially generated for consideration in the first round of data validation for the Cognitive Test Anxiety Scale–Revised (CTAR). Examination of the scale structure and response patterns resulted in the final selection of single-factor scale composed of 17 items (12 of which were in the original version of the CTAS), which is the focus of the current study.
Present Investigation
Traditionally, test anxiety research has been a construct with an international focus. Leading research in the field has been historically developed in research programs from Germany, England, the Netherlands, and the United States. As mentioned before, progress with CTA research has been made, with cross-cultural validation work occurring in North and South America (Furlan et al., 2009), Europe (Putwain & Daniels, 2010; Tsianos et al., 2009), Asia (Chen, 2007; Zheng, 2010), and the Middle East (Cassady et al., 2004). While this international attention is vibrant and engaging, there is a growing awareness of the need to expand research to include explicit attention to the conditions of underrepresented cultural and ethnic groups. The objective of this study was to use Rasch modeling to determine whether the Persian translation of the 17-item CTAS confirmed the proposed unidimensional structure of CTA as well as to identify whether the items of the scale produce an interval measure of CTA. Furthermore, the opportunity to report on the analysis of CTA experienced by university students in Iran advances the mission of the field to examine students from traditionally overlooked cultures.
Method
Translation Procedure
The short form of the revised CTAS (CTAR-17; Cassady & Finch, 2014) was translated from English into Persian with a focus on transliteral equivalence. The CTAR-17 is composed of 17 items using a 4-point ordered response rating scale that is common to test anxiety research (e.g., Sarason, 1984): 1 = not at all typical of me, 2 = somewhat typical of me, 3 = quite typical of me, and 4 = very typical of me. An experienced translator of psychology works reviewed the translation to ensure semantic and psychological equivalence of the two versions. The revised Persian translation was then back-translated into English by a second Persian–English bilingual. The back-translated English version was compared with the original English version by the author of the original CTAR as well as an American doctoral student in psychology with experience using the scale. A number of minor changes were suggested which were implemented in the final version used in this study.
Participants
The Persian translation of CTAR was given to 297 Iranian undergraduate students in two schools of humanities (n = 185) and engineering (n = 112) in a university located in the Northeast of Iran. The sample included 131 female and 166 male students, their mean age was 22.32 (SD = 3.73). Test takers were instructed to read each statement and mark which descriptive rating best described their beliefs. No item required reverse-scoring, and higher scores indicated higher levels of CTA.
Measurement Model
As repeated analyses with CTA revealed a consistent unidimensional construct (Cassady & Finch, 2014), the Rasch unidimensional model was utilized to evaluate the validity of the scale. The Rasch model is a latent trait model which relies on probabilistic assumptions to scale persons and items and evaluate the psychometric properties of measurement instruments. The Rasch model transforms ordinal person and item raw scores into interval measures which can be located on the same metric.
One important principle in Rasch and item response theory (IRT) models is the assumption of unidimensionality. Unidimensionality means that a single latent trait accounts for variability in the observed responses or only one attribute of an object or entity is measured at a time. This requirement is essential for measurement because an instrument which claims to measure levels of a construct cannot be influenced by varying levels of another construct (Stout, 1987). The Rasch model is a prescriptive model that specifies certain assumptions for unidimensionality. If the data fit the Rasch measurement model (i.e., if the assumptions of the model hold), all the items measure one unidimensional construct. Fit statistics are in fact summaries of deviations of observed responses from which the model prescribes for construction of interval unidimensional measures.
The appealing property of the Rasch model is that item and person parameter estimates do not depend on the specific sample of persons or items used for scaling. Furthermore, unlike two-parameter and three-parameter logistic IRT models, no assumptions regarding the normality of the distribution of person traits need to be made. These primary advantages drove the decision to use the Rasch model in the present study to evaluate the psychometric properties of the CTAR-17. Andrich’s (1978) rating scale model, which is a polytomous extension of the Rasch model for items scored on more than two categories, was used to model responses to the 4-point scale.
Results
In this study, we used the Rasch modeling technique to examine four empirical questions focusing on the psychometric qualities of the CTAR. Specifically, we evaluated (a) the quality of the individual items in the CTAR-17 for estimating the unidimensional construct of CTA, (b) the quality of the 4-point rating scale for effectively differentiating levels of perceived CTA, (c) verification of the unidimensional nature of the measured construct, and (d) examination of differential item functioning (DIF) based on gender. The parameters of the model were estimated by WINSTEPS Rasch program (Linacre, 2009b).
Individual Item Characteristics
Table 1 shows the statistics for the 17 items of the Persian CTAR-17 (PCTAR-17). Item statistics, including item difficulty locations, their fit values, separation reliability for items and persons, principal components analysis (PCA) of standardized residuals, and rating scale diagnostics, were investigated. “Estimate” in Table 1 indicates the difficulty (endorsability) of items, and “Error” is the standard error associated with each item estimate. The analyses of the items yielded an item difficulty range of −1.07 to 1.79 logits with a separation reliability of .98. Person estimates based on PCTAR-17 ranged from −3.77 to 2.72, with a separation reliability of .86. Separation reliability is the ratio of true score variance to observed score variance. True score variance is computed by subtracting the average of the squared parameter standard errors from the variance of the parameter estimates. This value is then divided by the variance of the parameter estimates. It is performed both for item parameters and for person parameters. It is called separation reliability because it indicates how well the item and person parameters are separated or differentiated on the measured variable. A high separation reliability index for items or persons means that there is a high probability that items/persons with high difficulty/ability estimates do have higher difficulty/ability estimates than persons/items with low estimates (Linacre, 2009a).
Item Measures and Fit Statistics for the PCTAR-17.

Note. PCTAR = Persian Cognitive Test Anxiety Scale–Revised; MNSQ = mean-square.
The quality of the items and their contribution to the measurement of the construct of CTA were also assessed using outfit and infit mean-square statistics. Infit and outfit mean-square values indicate how well the items represent the single underlying construct intended to be measured. Outfit mean-square is computed by averaging the squared residuals (the difference between observations and model expectations) for each item across all persons. To compute infit values, squared residuals are weighted by their statistical information (i.e., their variances) and then averaged; this makes them impervious to unexpected observations (Linacre, 2009a). Outfit mean-square values are sensitive to outliers (i.e., unexpected responses by persons high or low on the trait continuum), but infit mean-squares are sensitive to unexpected responses by persons on items that are targeted on them and are not influenced by outliers. “High infit mean-squares indicate that the items are mis-performing for the people on whom the items are targeted. This is a bigger threat to validity, but more difficult to diagnose than high outfit” (Linacre, 2009a, p. 596).
Outfit and infit mean-square values in the range of 0.60 to 1.40 are considered productive for measurement in rating scales (Linacre, 1999; Wright & Linacre, 1994). The expected value for infit and outfit statistics is 1. Values greater than 1.4 indicate aberrant response patterns that distort the measurement and are instances of multidimensionality or construct-irrelevant variance (Baghaei, 2008); values smaller than 0.60 indicate deterministic response patterns, as those expected in a Guttman scale, and are benign. They suggest redundancy and duplication of information; they do not distort measurement but can lead to spurious high reliabilities. Table 1 indicates that only Item 15 has an infit and outfit value above the acceptable range, suggesting that Item 15 may be a poor item for inclusion in the PCTAR-17. None of the infit and outfit values is below 0.60.
Response Scale Analyses
Properties of the rating scale structure were also examined. Table 2 presents category statistics for the 4-point scale, identifying the count (number of category endorsements across the items). As shown in Table 2, a large portion of the endorsed response categories were Categories 1 and 2 (indicating low levels of perceived test anxiety). As such, the data generated by the PCTAR-17 appear to serve to identify extreme cases of test anxiety, which would be indicated by endorsement of the highest category rating.
Category Statistics for PCTAR-17.

Note. PCTAR = Persian Cognitive Test Anxiety Scale–Revised; MNSQ = mean-square.
The second parameter for examination was the category observed average. This is the PCTAR-17 mean of all persons in the sample who selected that category. We expect observed averages to increase along with category values, which was the pattern observed with these data.
Next, examination turns to the infit and outfit mean-squares for each category level. These values (see Table 2) are the average of the infit and outfit mean-squares associated with the responses in each category, with an expected value of 1.0; values above 1.50 are problematic (Linacre, 2009a). As shown in the table, all categories were within accepted limits.
Finally, the thresholds reported in Table 2 identify the points on the rating scale where the probability of being observed in either of two adjacent categories is equal. The first category has no prior category, so there is no measure for that. The rating scale model assumes that step difficulties do not vary across the items and estimates one set of category thresholds for all the items. When evaluating rating scales, the order of the thresholds for items is examined. We expect threshold estimates to increase with category values. Disordered thresholds indicate that the category occupies a narrow interval on the latent variable or is poorly defined for respondents (Linacre, 1999). Disordering of the thresholds indicates that respondents are not able to clearly distinguish among the response options as finely as expected (Bond & Fox, 2007). When there is disordering in the thresholds, the recommendation is to reduce the number of response options by collapsing the adjacent categories (Bond & Fox, 2007; Linacre, 1999) because there is no sense in having, say, five categories when respondents cannot distinguish among them. Examination of the threshold estimates of the CTAR-17 shows that they are ordered.
A graphic representation of the probability curves for each response category is provided in Figure 1. Each category should have a peak on the curve that indicates that the category is the most probable response for some regions of the scale. The curves show that each category represents a unique section of the measured construct (i.e., each category is most probable for respondents falling on certain sections of the trait continuum). “The plot should look like a range of hills. Categories which never emerge as peaks correspond to disordered Rasch-Andrich thresholds. These contradict the usual interpretation of categories as being a sequence of most likely outcomes” (Linacre, 2009a, p. 304).

Category probability curves for PCTAS-R (17).
Examination of Unidimensionality for PCTAS-R
R. M. Smith and Plackner (2009) state that infit and outfit statistics are “relatively insensitive to systematic threats to unidimensionality” (p. 424). Therefore, to further investigate the unidimensionality of the scale, global fit statistics were checked by investigating patterns in the residuals. Residuals are differences between predictions of the Rasch model and the actual observations. The smaller the residuals, the better the data tend to fit the model—or the better the model has accounted for the variance in the data. Residuals are part of the data the model has not explained, so we expect them to be uncorrelated and randomly distributed (Linacre, 2009a). By subjecting residuals to PCA, we aim to demonstrate that the residuals are uncorrelated and no factor can be extracted from them. It is important to note that PCA is performed on the standardized residuals and not the original data. That is, the target dimension—or latent trait—has already been removed when PCA is applied (Linacre, 2009a). Therefore, any component extracted from the residuals is a secondary, off-target dimension. If the data fit the Rasch model, we expect the latent trait to explain all information in the data and the residuals represent random noise. In this case, residuals would be normally distributed, independent of each other, and, consequently, their matrix of correlations would be 0 (E. V. Smith, 2002). Therefore, PCA of residuals should produce no noticeable factors. However, if we do extract a factor from residuals, it means that a secondary dimension is also measured by the test and the test is not unidimensional (Baghaei, 2011).
To determine whether the factor extracted from the residuals is ignorable or not, the size of its eigenvalue is considered. The size of the eigenvalue in the first factor is a measure of unidimensionality or global fit of data to the Rasch model (E. V. Smith, 2002). Eigenvalues above 2 suggest that the dimension extracted from the residuals is above noise level and is a secondary dimension that threatens the unidimensionality of the scale (Linacre, 2009a).
PCA of the standardized residuals showed that the measures explain 42.8% of the variance; 24.1% are explained by item measures and 18.7% are explained by person measures. In all, 57.2% of the variance remains unexplained. Factor 1 in the residuals accounted for 7.3% of the unexplained variance, after removing the first factor, equivalent to 2.2 in eigenvalue units, which is an indication of multidimensionality.
Loadings in the PCA of standardized residuals show the correlation between the items and an off-target secondary component extracted from the residuals. Negatively and positively loading items represent two sets of items orthogonal to the target dimension. Items with a correlation near 0 do not participate in this secondary component. A high loading for an item on the secondary component means that the item is correlated with the off-target dimension and may be less correlated with the target Rasch dimension or the latent trait. Examination of the content of contrasting clusters of items with high positive and negative loadings (above ±0.40) can guide us to discover substantive definitions of the secondary components as secondary dimensions (Linacre, 2009a).
Table 3 shows the loadings of the 17 items on the first factor identified in the PCA of residuals with the first component removed. Factor 1 revealed that two groups of items contribute to the definition of CTA. Items that loaded negatively on Factor 1 are directly related to feelings of nervousness, whereas items that loaded positively are more global testing concerns about the outcomes of tests. Individuals’ CTA estimates from these two clusters of items correlated at .63.
Item Loadings for PCTAR-17 on First Factor in PCA of Residuals.

Note. PCTAR = Persian Cognitive Test Anxiety Scale–Revised; PCA = principal components analysis.
To investigate unidimensionality, E. V. Smith (2002) suggested estimating person parameters on the basis of two subsets of an instrument. Unidimensionality of an instrument implies that person parameter estimates should not depend on the subset of items that respondents happen to encounter. If a person’s trait estimate changes in the different subsets of an instrument, then the data represent more than one dimension and the test lacks construct validity. This means that different subsets of a unidimensional test produce equivalent person parameter estimates, within measurement error, after estimates are brought onto a common scale. The equivalence of estimates is tested by means of t tests. Statistically significant t tests indicate that person parameters are not equal across the two subsets of the instrument and the instrument measures more than one dimension. Person estimates from the subsets can also be correlated or cross plotted against each other. Equivalent estimates should fall within the 95% quality control lines.
We cross plotted persons’ CTA measures, separately estimated and equated, based on the negatively and positively loading items. The plot showed that many respondents fall outside the 95% quality control lines. Two hundred ninety-seven t tests were run to compare the CTA estimates obtained from the two sections of the test for all respondents. Findings showed that about 10% of the t tests were significant. According to E. V. Smith (2002), less than 5% of the t tests should be significant if unidimensionality is desired. These are all clear indications that the two sets of items are not closely related and the scale is not unidimensional.
Figure 2 provides the plot of item loadings on the first factor extracted from the residuals. The plot graphically represents the loadings of items on the off-target dimension, with items on the two ends of the plot having higher loadings. Those on the top end have positive loadings and those on the bottom end have negative loadings. It shows that four items indicated with A, B, C, and D are outlying at the top. The contrasting pattern which does not accord with the rest of the items and caused misfit was, therefore, attributed to these four items.

Plot of item loadings on the first factor in PCA of residuals.
In a follow-up analysis, Items 17, 13, 15, and 16, which correspond to Items A, B, C, and D, respectively, were deleted, and the scale was reanalyzed. As Table 4 shows, the 13 remaining items had acceptable fit as indicated by outfit and infit mean-square values. PCA of standardized residuals, after deleting the four items, showed that measures explain 48.3% of the variance and the size of the eigenvalue in the first factor reduced to 1.6, which indicates unidimensionality and decent model fit with no change in test reliability.
Item Measures and Fit Statistics for the PCTAS-R (13 Items).
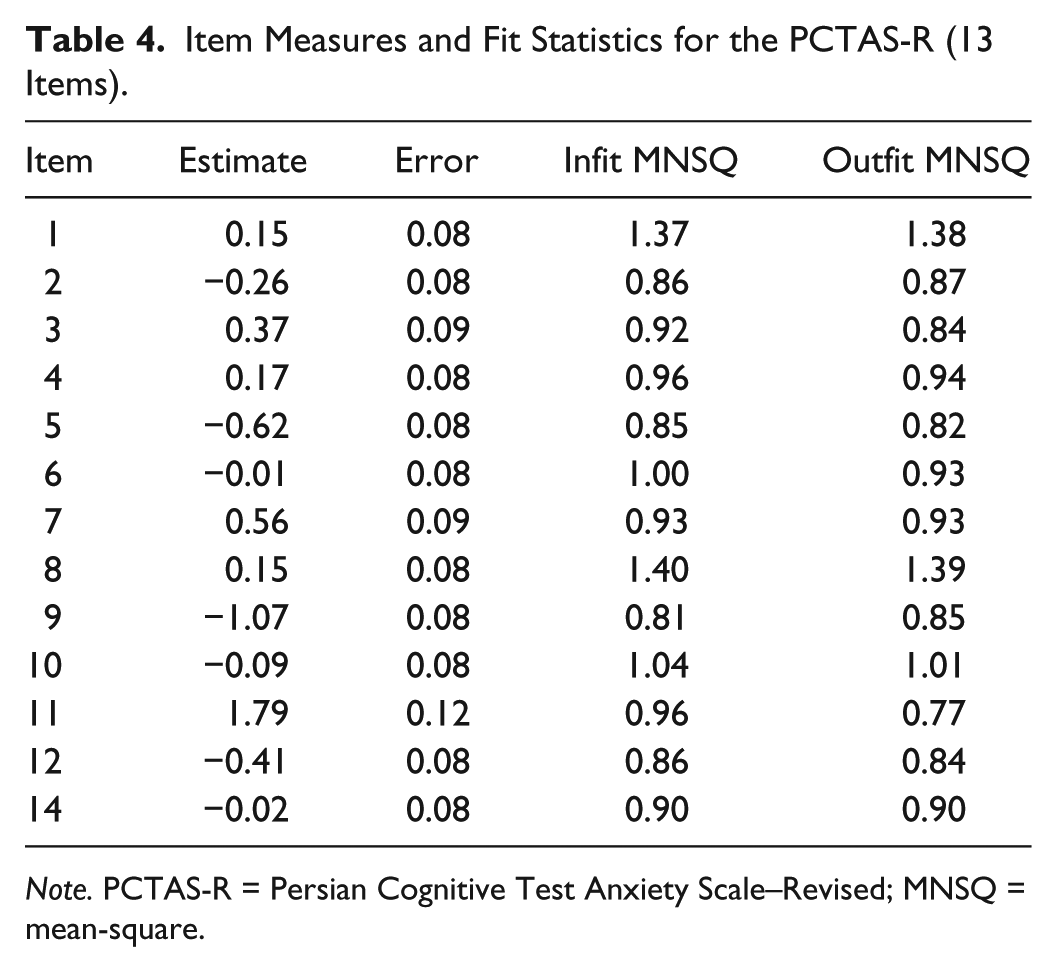
Note. PCTAS-R = Persian Cognitive Test Anxiety Scale–Revised; MNSQ = mean-square.
Deleting the four items improved the qualities of the rating scale by increasing the distance among the thresholds, which means that each category has a wider range on the scale. Threshold estimates after deleting the four items were −1.81, 0.47, and 1.34, with the same fit indices.
Figure 3 is a Wright map of the distribution of persons and the 13 items’ threshold estimates on the variable of CTA. The test is composed of 4-point Likert-type items; therefore, the operational range of item estimates is defined with the threshold estimates associated with each item. It shows the relative difficulty (endorsability) of the items and their threshold estimates (on the right) and the distribution of the persons (on the left). Items on top of the scale are hard to agree with and those at the bottom are easier to agree with. Persons at the top are those with higher CTA levels and those at the bottom with lower CTA levels. A unique property of the Rasch model is that item difficulty estimates and person ability estimates are expressed on the same metric and are comparable. The map shows that the items define a clear hierarchy of increasing test anxiety. The map also depicts that item categories define an operational range wider than the overall item estimates shown in Table 1. The lowest threshold is −3.06 logits (Item 9) and the highest is 3.25 logits (Item 11), which define a range of 6.31 logits covering a wide range of the trait continuum.

Wright map of the distribution of persons and items on the latent variable.
Gender DIF
Finally, we explored DIF across gender. DIF occurs for an item when respondents with the same location on the latent trait have different probabilities of endorsing the item. DIF is an indication of the change of construct for different subpopulations of respondents and is a serious threat to test validity. In this study, the stability of the construct measured by PCTAR-17 was examined across gender, revealing that Items 1 and 8 were differentially functioning items across males and females. The difference in the location estimates of Items 1 and 8 across males and females were 0.52 (SE = 0.17) and 0.70 (SE = 0.17) logits, respectively. Both items were easier for male students to endorse (p < .05).
Discussion
The purpose of the present study was to validate the Persian translation of the shortened form of the CTAR-17. Translation was made utilizing forward and backward procedures. Examination of equivalence of items across languages was satisfactory. The rating scale model (Andrich, 1978) which is a member of the family of Rasch models for polytomous items was used for validation. Construct validity under the Rasch model is conceptualized as fit of the data to the model’s assumptions. If data fit the Rasch model, the items and persons can be located on a common interval scale and all the items measure a single unidimensional construct. In particular, the analyses were centered on identifying evidence of a unidimensional structure for the Persian form of the CTAR-17, identifying the quality of individual items for estimating CTA in a Persian sample, demonstrating the efficacy of a 4-point response scale, and estimating DIF sensitive to gender for individual items.
The overall findings demonstrated that a shortened version of the Persian translation that eliminated four items from the CTAR-17 provided a more effective unidimensional representation for CTA in this sample. Examination of item characteristics and response scale quality demonstrated that the 13-item Persian Cognitive Test Anxiety Scale (PCTAS) fits the Rasch model effectively. Finally, the analyses examining DIF related to gender identified two items demonstrating differential response patterns for males and females in the sample.
Unidimensional Structure for PCTAS
The results of this study indicated that acceptable fit to the Rasch model was achieved once four items were deleted from the initial 17-item Persian translation for the CTAR. The 13-item Persian version of the scale (PCTAS) had a satisfactory person separation reliability of .86 and item separation reliability of .98. Deviation from the English version of the CTAR by eliminating four items appears to be the most viable solution for valid analyses for the Persian translation. The four items identified through the PCA of the standardized residuals may be conceptualized as focusing more on a global orientation toward the relationship between tests and performance for students, rather than more specific experienced symptoms of test anxiety (see Table 3, Items 17, 13, 15, and 16). In this Persian university sample, the data demonstrated that beliefs about test performance tendencies did not fit within a unidimensional construct for CTA. Naturally, cultural differences between undergraduates in Iran and the United States may underlie the differential patterns observed in the PCTAS and the U.S. sample data collected in the past. For instance, the items removed from the original 17-item version focus on test performances misrepresenting the overall ability of the learners or being beyond their initial control. In Western samples, students with high CTA have reported higher levels of perceived helplessness over testing (Cassady, 2004b), higher rates of failure avoidance motivation (Zeidner & Matthews, 2005), and generally reduced levels of test performance (Hembree, 1988; Zeidner & Matthews, 2005). What is not clear is whether this relationship holds in the sample of students collected in this study located in Iran. In both Iran and the United States, university exams are generally viewed as high stakes assessments that determine not only current and future standing in their academic program, but are also associated with eventual success in securing employment upon graduation.
Item and Model Fit
First, examination of the rating scale statistics showed that the 4-point scale functioned optimally. Given the prevalence of the 4-point scale used in the PCTAS and earlier version of the CTAS (e.g., Sarason, 1984), this validation was anticipated. Furthermore, after deleting the four off-dimension items, the category intervals became slightly wider; this is an indication that each category is more distinct and better defined when the four items are removed from the scale.
Examining the hierarchy of the item difficulties can provide valuable information about the development and progressive symptoms of CTA. That is, items that are “easily endorsed” demonstrate indicators of commonly reported CTA symptoms, whereas those items that are least likely to be endorsed provide greater information about learners with extreme levels of anxiety. As illustrated in Figure 3, Items 9 and 5 were the items most likely to be endorsed (i.e., “When I take a test, my nervousness causes me to make careless errors” and “At the beginning of a test, I am so nervous that I often can’t think straight”). Alternatively, the least likely to be endorsed items (and thereby indicators requiring greater levels of CTA to be endorsed) were Items 11 and 7 (i.e., “During tests, the thought frequently occurs to me that I may not be too bright” and “I tend to freeze up on things like intelligence tests and final exams”). The advancement offered to the field from this burgeoning line of work is the start of a line of research that will identify those items that are most illustrative of elevated levels of CTA, and will lead to a more effective scaling process. That is, with additional data in future samples, we anticipate being able to structure a more sophisticated diagnostic indication of test anxiety where items with different levels on the hierarchy have differential influence on overall anxiety ratings.
DIF for Gender
DIF analysis by gender demonstrated that Item 1 (“I get distracted from studying by thoughts of failing”) and Item 8 (“I think of consequences of failing during tests”) exhibited significant DIF. Both items were easier for male students to endorse, which goes counter to broad and general effects observed in self-reported test anxiety studies examining overall gender differences, where females generally report higher levels of anxiety (e.g., Cassady, 2010; Hembree, 1988; Zeidner, 1998). However, the examination of DIF differs from the studies that review overall levels of anxiety between males and females—reviewing the individual item response patterns. In this sample, response pattern differences on those two specific items do not suggest overall heightened levels of test anxiety for males. All that these data illustrate is that the males in this Iranian sample were more likely to endorse the two items focused on perseverating on thoughts of test failure. Two explanations for this pattern may be forwarded.
First, in this particular sample, the majority of females were majoring in the humanities, whereas the majority of males were engineering majors. Students in hard sciences courses tend to experience higher rates of exam threat or anxiety than in the liberal arts (Britner, 2010). This may be due to the common practice in engineering programs to rely on “high stakes” testing and “gateway” courses that promote a heightened awareness of the learners on test failure.
A second potential reason for the observed DIF for these two items may be related to societal differences in the future concern for job security related to exam performance. Similar to research conducted on test anxiety for Kuwaiti women (Cassady et al., 2004), female university students in Iran may have a lower degree of pressure to secure employment than their male counterparts. Iranian society accepts educated women who are jobless and are housewives but this is not acceptable for men. Failure in exams for women simply means repeating the course. But for males, failure means falling behind a year or more in graduation, which means falling behind in finding a job and missing the limited available employment opportunities.
Limitations and Future Directions
One limitation of the study is that the sample used in this study is from a single undergraduate university population in Iran. Further studies could expand on the validation with a broader exploration with additional university populations to allow for greater diversity. An additional limitation to the overall validation of the scale for this specific population was the distribution of males and females across university majors—the potential confound for gender and primary area of study poses difficulty in interpreting the gender DIF finding.
Future basic research goals exploring the use of the PCTAS should address potential measurement invariance of the scale for male and female students, demographic characteristics, and across different cultures. Students’ worries about exams are very much affected by age, the demands of family, educational systems, and societies (e.g., Cassady, 2010; Zeidner, 1998). Therefore, different structures for exam anxiety may be expected across different populations, which are worth investigating. In addition, continued validation of the scale beyond the fit to a Rasch model is valued—for instance, compared with other measures of test anxiety or examining relationships with known outcome variables related to test anxiety (e.g., perceived test threat, academic achievement).
Applied research activities related to the PCTAS can build upon these initial construct validation indicators to build decision-making models for identification and intervention for students with debilitating CTA. In particular, as more information on the hierarchical response patterns for the various items on the PCTAS becomes available, researchers and practitioners will gain essential information on the primary items that illustrate the most significant degrees of test anxiety, perhaps generating a list of “critical items” for focus. Clinicians and school counselors can quantify changes in symptoms as a result of treatment and evaluate treatment programs. The brevity of the scale is an advantage that makes its application in research and treatment easier.
Footnotes
Declaration of Conflicting Interests
The author(s) declared no potential conflicts of interest with respect to the research, authorship, and/or publication of this article.
Funding
The author(s) disclosed receipt of the following financial support for the research and/or authorship of this article: This research was partially supported by the Research Department of Islamic Azad University, Mashhad Branch, grant no. D/20281 to Purya Baghaei.