
Abstract
Government of India (GOI) initialized financial inclusion campaign to quell exclusion. The campaign did not gain expected progress. Government employed technologies to speed up the process. Among banking technologies, mobile banking appeared as a possible solution for financial exclusion with wide mobile phone coverage. Inputs on rural people’s intention toward technologies for effective financial inclusion were essential. Technology adoption factors, performance expectancy, effort expectancy, social influence, attitude, perceived risk, and behavioral intention (BI), were short listed after literature review. Factors were subjected to reliability, exploratory factor analysis (EFA), multiple regression, and interaction analysis. Rural provinces in Karnataka state were surveyed. We used mixed sampling technique to reach 959 samples. Multiple regression–interaction analysis revealed age and gender moderated attitude’s path toward BI.
Introduction
Financial inclusion promotes economic growth. Rural people get payments and services at affordable costs. With technology intervention in financial inclusion, electronic banking activity in rural India leads to increased savings and better living standards (The Economist, 2004). Good living standard paves way to balanced regional development (Donner, 2008; Duncombe & Heeks, 2002; Hudson, 2006). Financial inclusion campaign routes organized financial system to low-income strata in a rural region enabling inclusive growth. Inclusive banking gained pace after 1969 bank nationalization further supplemented by micro finance in the 1990s.
Government of India (GOI) commenced financial inclusion campaign in 2006 and established 96,828 Customer Service Points (CSPs) by March 2012. Banking correspondents (BCs) visited remote locations to give bank services. Unable to pursue campaign on a large scale, GOI in 2008 constituted Rangarajan committee to assess facts in rural region. Rangarajan committee defined financial inclusion as “the process of ensuring access to financial services providing timely and adequate credit required by vulnerable groups such as weaker sections and low-income groups at an affordable cost” (Vijaya Bhaskar, 2013). Rangarajan committee’s report was an eye opener for banks. Union Budget report of 2007 to 2008 suggested imminent need for financial inclusion. Banks spotted the opportunity in rural regions. Reserve Bank of India (RBI; 2007) estimated population with no bank accounts at 41%. One third of Indian population with 51.4% farmer households were not aware of formal finance, and 73% of excluded rural households had no reach to credit (Rangarajan Committee, 2008).
Well-planned campaigns educate, train, and clear anxiety (Carter & Bélanger, 2005). Worldwide, governments have electronically reengineered their conventional public services to reach underprivileged segments (Schaupp & Bélanger, 2005). Developing countries need technologies for economic growth (Avgerou, 2008). So far, low trust level on government campaigns has hampered e-governance success (Belanger & Hiller, 2006; Carter & Bélanger, 2005; Gefen & Heart, 2006; Shim et al., 2002; Welch, Hinnant, & Moon, 2005). Low technology adoption rates and resistance are a matter of concern in developing countries where high utility and value-based technologies were resisted (Bélanger & Carter, 2008; B. Gupta, Dasgupta, & Gupta, 2008; Qian & Dongdong, 2011; Schuppan, 2009).
Planning commission of India, through carefully planned financial inclusion, vast coverage, and information gaps on ground realities, hampered progress. As rural people get farm yield, it is sold for cash. This time spectrum was best for banks to approach farmers. Dasgupta, Paul, and Fuloria (2011) found that saving habits results in better cash management skills among rural people.
Without banks, rural farmers do not save (Sunil, 2013). Indian banks covered metropolitan areas in the last 30 years, except rural areas (Manjule & Arunkumar, 2014). For a successful inclusive banking, acceptance of banking technology is imperative (Chugh, 2014).
Problem Identification
Banking sector used technology in 1960. Researches related technology to economic development. Banking industry experienced technological changes in information management and money transfer. Unnithan and Swatman (2001) studied technology-mediated banking service. Previous studies did not give groundbreaking facts. Information technology (IT) was widely associated with economic development strategies in 2003 (World Bank, 2003). According to Khan Commission Report (2004), India had the second highest financially excluded households in the world. Initially, RBI used micro finance institutions (MFIs), business facilitators (BFs), and BCs to reach remote rural regions. Inclusion campaign did not gain expected success. RBI aimed rules for mobile banking transactions in 2008. Daily transactions limit was raised to INR 50,000 (US$1,000; RBI, 2009). RBI aimed IT and banking services to 600 million new customers (Ketkar et al., 2012). Mobile banking guidelines emphasized safety, efficiency, and accessibility (RBI, 2014).
Donner (2008) found more mobile phones possessions than bank accounts in the world. According to Jiang (2009), rural areas represent real India. Even after urban migration trend, 69% of the population are still in rural areas.
Indian government reports show increase in rural branches from 8,000 in 1969 to 89,000 in 2011. These numbers made no difference in rural regions. Potnis and Deosthali (2012) pointed the need to find factors that explain electronic banking resistance.
Data comparison of the world with two growing nations, India and Bangladesh, confirms that mobile phones outnumber bank accounts (Table 1). Dahotre (2009) already observed India as a potential market for mobile banking service implementation. Business Monitor International (BMI) in 2011 estimated positive trend for e-banking services supported by Sachin (2012). Fully implemented mobile banking service offers mini statement, account history check, SMS alerts, access to card statement, balance check as well as mobile recharges (Vinayagamoorthy, Sankar, & Sangeetha, 2012). Bihari (2012) found mobile banking as a valuable addition to traditional services. Mobile phones are available at just US$15 (~INR 900) in India. This favored mobile phones diffusion among rural people. However, widespread coverage and large mobile phone use in Delhi did not result in mobile banking adoption (S. Singh, 2014). Annesha (2014) observed a consistent increase of wireless subscribers from 2012 to 2014. Recent developments in the mobile banking domain are as follows:
Philippines started Smart Money and G-Cash mobile money transfer services (Wishart, 2006).
MTN offered mobile banking, and WIZZIT money transfer was also introduced in South Africa (Richardson, 2008).
Mobile-based DrumNet application was launched in Kenya and e-diary in Sri Lanka. Farmers earned US$262 per month (Qiang, Kuek, Dymond, & Esselaar, 2011).
With 43% of the population in the financially excluded group, telecom companies and banks in India tied up to offer mobile savings accounts.
Vodafone and Safaricom started M-PESA in Kenya around 2005. Initially, there were 2.37 million subscribers. Number of subscribers in 2012 increased to 15 million. This figure comprised 70% of the Kenyan population. Presently, M-PESA accounts half of the world’s mobile money transfers (CGAP, 2010; Maitrot & Foster, 2014; Maurer, 2012).
According to Central Intelligence Agency World Factbook (2013), in the year 2010-2011, nonbank financial institutions (NBFIs) eyed more market share as BCs. RBI denied permission for NBFIs.
RBI issued Aadhaar cards to 510 million people and enabled 182 million information and communication technology (ICT) bank accounts (RBI, 2014).
Twelve Indian banks in 2010 offered mobile banking services. Another 61 banks added up by 2014 (RBI, 2014; TRAI, 2013).
Comparison of Mobile Phones and Bank Accounts.

Source. Sunil (2013).
Bina and Giaglis (2007) concluded mobile phones as the best alternatives for financial inclusion. This finding was already supported based on location free access, real-time information, and improved control on bank accounts (Krishna & Walsham, 2005; Laukkanen & Lauronen, 2005; Rao & Prathima, 2003; Scornavacca & Hoehle, 2007; Varshney & Vetter, 2002). Archer, Hollingworth, and Halsall (2007) with Naqvi and Al-Shihi (2009) pointed post 2009 as apt for banks to look beyond traditional banking. C. Vyas (2009) observed India and Australia as potential markets for mobile banking implementation. Mobile banking enables service delivery from any place, any time (Jonathan, 2010). McKay and Pickens (2010) concluded branchless banking as 19% cheaper than traditional banking practices. Potnis and Deosthali (2012) observed first 1 billion mobile phones slowly moved in the market until 20 years worldwide. Next 2 billion phones circulated in 4 years and next 3 billion vanished within a year.
According to 2012 Telecom Regulatory Authority of India (TRAI; 2012) press release, as of April 7, 2012, wireless phone subscribers in India were 911.17 million. Out of 911.17 million, 594.11 million (65.20%) accounted for urban cities, and rural subscribers were 317.06 million (34.80%). Indiscriminate service delivery was the prime objective of public policy. Statistical details such as 17 million out of 143.2 million using mobile Internet in 2011 remain a concern where telecom and banking industry need to reach unbanked population (Archana, 2012; R. Gupta & Jain, 2014, 2015; Ketkar et al., 2012).
Research Gap 1
According to Basu (2005), Dev (2006), and Mohan (2006), rural institutional credit was extended ignoring facts on rural people’s saving intention. Mobile phones helped drive growth in saturated markets (Donner & Excobari, 2010). Hudson (2006) recognized mobile phone’s productive role in agricultural development. Jensen (2007) highlighted the digital divide as a major issue in developed and developing countries. Burrell and Anderson (2008) brought out advantages of mobile phones in constrained situations. Indian banks used business correspondents for inclusive banking with less success. Banking technology is essential for effective inclusion (Chung & Kwon, 2009; Duncombe & Boateng, 2009; C. S. Yu, 2012; T. Yu & Fang, 2009).
Research Gap 2
According to Ravichandran and Rai (2000), technology adoption requires active user participation. Developing nations face resistance in technology implementation (Kleijnen, Wetzels, & de Ruyter, 2004). Suoranta and Mattila (2004) expressed concern on low mobile banking adoption rates in the world. Riivari (2005) and Y.-S. Wang, Lin, and Luarn (2006) concluded technological advances and service availability do not trigger adoption. Mallat, Rossi, and Tunainen (2004) and Y.-S. Wang and Liao (2007) emphasized reason behind fewer mobile phone transactions to be studied. Mobile banking with convenience, ubiquity, and interactivity solves coverage problem (Bihari, 2011). In India, mobile phones have penetration than computers. Vaishnavi (2011) and Dash (2014) observed India lags behind other countries in mobile payment adoption with a very large potential.
Research Gap 3
The mobile phone is simple compared with computers. Carroll (2005) pointed mobile phones diffusion in urban, suburban, and rural areas unexpectedly fast. Widespread mobile phones diffusion did not result in mobile banking adoption (Laforet & Li, 2005; Luarn & Lin, 2005; Scornavacca & Hoehle, 2007). H. Kim, Chan, and Gupta (2007) recommended more studies on mobile banking adoption. Indians have consistently resisted new technologies (Chaipoopirutana, Combs, Chatchawanwan, & Vij, 2009; Laukkanen & Pasanen, 2008; Maurer, 2008; Puschel, Mazzon, & Hernandez, 2010; Zarifopoulos & Economides, 2009). Knowledge on motivators and inhibitors of mobile banking technology is required (Ashta & Assadi, 2011; H. F. Lin, 2011; Thakur & Srivastava, 2014).
Research Gap 4
Wareham, Zheng, and Straub (2005) attracted information system (IS) researchers toward mobile commerce. Observing mobile commerce growth, more e-payment feasibility studies by Harle and Beresford (2005); H. Wang, Cao, and Zhang (2005); Gianluigi, Strangio, and Schuster (2006); and Huang and Boucouvalas (2006) surfaced. Kendall, Kendall, and Kah (2006) supporting Ravichandran and Rai (2000) highlighted necessity of people’s participation in technology adoption campaigns. Laukkanen and Cruz (2009) and K. Lee and Chung (2009) observed mobile banking idea gaining awareness in the world. International Telecom Union (ITU) stated, out of 5 billion users worldwide, India had already 500 million telecom subscribers by December 2009. According to R. Singh (2009) and S. Singh, Srivastava, and Srivastava (2010), low-cost mobile phones sold well in Indian markets supported by Zainudeen and Ratnadiwakara (2011). Khalifa, Cheng, and Shen (2012) predicted the mobile industry would surpass US$119 billion mark from tiny US$18.3 billion industry. Every year in India, after 2008, more than 100 million mobile subscribers added to telecom density (Vishal, Pandey, & Sanjay, 2012).
Research Objectives
The article investigates mobile banking service adoption in rural Karnataka. Subobjectives assess the relationship of independent variables, performance expectancy (PE), effort expectancy (EE), social influence (SI), attitude, and perceived risk (PR), with dependent variable, behavioral intention (BI). The study also attempts to measure moderation of age and gender on PE, EE, SI, and attitude’s path toward BI.
Prior Research and Theoretical Background
In literature review, various theoretical models in IT/IS domain were reviewed. Conceptual models had roots in psychology and sociology explaining technology acceptance (Venkatesh & Davis, 2000). Technology adoption was a distinguished area in IS research (Benbasat & Barki, 2007; Venkatesh, Davis, & Morris, 2007).
Fishbein and Ajzen (1975) introduced “Theory of Reasoned Action” (TRA). TRA had three variables, namely, BI, attitude, and subjective norm. In 1980, Ajzen and Fishbein revised TRA as “Theory of Planned Behavior” (TPB) later known as “Decomposed Theory of Planned Behavior” (DTPB). DTPB used relative advantage, compatibility, and risk variables. These variables belonged to Diffusion of Innovation (DOI) theory, also known as Innovation Diffusion Theory (IDT). Rogers (1995) introduced DOI with five attributes: relative advantage, complexity, trialability, compatibility, and observability. Out of five variables in DOI, relative advantage, complexity, and compatibility were consistently related to innovation adoption.
Davis in 1986 studied computer-usage behavior. Davis (1989) improved TRA framework to Technology Acceptance Model (TAM) with perceived usefulness (PU) and perceived ease of use (PEOU) as basic factors. Venkatesh and Davis (2000) improved TAM to TAM2. TAM2 examined PU and usage intention from SI perspective.
TAM was influential and famous. Various empirical platforms tested TAM for measurement validity. Adoption studies based on TAM investigated simple technologies. TAM studies used teenagers and students in universities. Generalization of findings was questionable (Legris, Ingham, & Collerette, 2003).
Venkatesh, Morris, Davis, and Davis (2003) had already introduced Unified Theory of Acceptance and Use of Technology (UTAUT). UTAUT explained the adoption of complex technologies like online bulletin boards and instant messengers, online stock trading (Yang, 2005), electronic marketplaces (Y.-S. Wang et al., 2006), and mobile commerce adoption in Finland (Carlsson, Waiden, & Bouwman, 2006; Park, Yang, & Lehto, 2007). Fruhling and Vreede (2006) and Lucas, Swanson, and Zmud (2007) reviewed IS adoption studies on TAM and stressed on the need to look beyond TAM. UTAUT is a powerful framework (Goodhue, 2007). There are limited studies on UTAUT investigating mobile banking adoption (Samudra & Phadtare, 2012).
Research Gap 5
UTAUT condenses 32 variables not only from TAM but also from Social Cognitive Theory (SCT) by Bandura (1977) and Compeau and Higgins (1995), Model of Personal Computer Usage (MPCU) by Triandis (1977) and Thompson, Higgins, and Howell (1991), and Motivational Model (MM) by Davis, Bagozzi, and Warshaw (1992). UTAUT helped to study mind-sets of people at organizational and nonorganizational environments. Johns (2006) and Alvesson and Kärreman (2007) suggested borrowing and experimenting variables improve a theory. Moderating variable (MV) inclusion in UTAUT boosts its ability to measure interaction effects (Bagozzi, 2007). Three types of UTAUT extensions are as follows:
Studying new users (Yi, Jackson, Park, & Probst, 2006), new technologies (Chang, Hwang, Hung, & Li, 2007), and new cultural settings (B. Gupta et al., 2008);
The new addition of constructs to test endogenous variables (K. Y. Chan, Gong, Xu, & Thong, 2008; Sun, Bhattacherjee, & Ma, 2009);
Addition of exogenous variables (Neufeld, Dong, & Higgins, 2007; Yi et al., 2006).
Al-Gahtani, Hubona, and Wang (2007) and Armida (2008) pointed out the requirement of systematic investigation of technology adoption as earlier studies did not research moderators. Initially, UTAUT catered to technology acceptance explanation in organizations. Later, the framework was also used to study consumer technologies as it was a multibillion dollar industry (Llamas & Stofega, 2010). Basic constructs of UTAUT, PE, EE, SI, and facilitating condition consistently measured BI. Innovations and perceived enjoyment constructs effectively measured actual usage (Thakur, 2013).
Hypothesis Development
Variables PE, EE, SI, and BI are from UTAUT. Study dropped facilitating condition variable as its items measured after sales service aspect. Study has added attitude and PR variables to theoretical framework from TAM as each experiment is a quest for more knowledge (Alvesson & Kärreman, 2007).
PE
PE describes the extent of benefits technology offers in a job. Nysveen, Pedersen, and Thorbjørnsen (2005a, p. 252) stated, “If a system doesn’t assist its users performing jobs, it is not received.” PE consistently relates to BI at voluntary (nonorganizational) and involuntary (organizational) settings (Al-Qeisi, 2009; Jack, Suri, and Townsend (2010); Venkatesh et al., 2003).
We can compare PE with relative advantage (McCloskey, 2006; Plouffe, Hulland, & Vandenbosch, 2001; Rogers, 2003), convenience, affordability (H. F. Lin, 2011), and PU in TAM (Venkatesh et al., 2003). Previous studies of Pikkarainen, Pikkarainen, Karjaluoto, and Pahnila (2004) and Cheong and Park (2005) uphold PU’s role in technology adoption studies. Eriksson, Kerem, and Nilsson (2005); Luarn and Lin (2005), and Chiu, Hsu, Sun, Lin, and Sun (2005) linked PU to BI supported by Guriting and Ndubisi (2006). PU helped to study performance aspects in technology adoption. Venkatesh and Bala (2008), Chung and Kwon (2009), Daud and Yusoff (2011), T. Zhou (2011), and Padashetty and Krishna (2013) studied and validated PU performance.
PE was consistently related to BI in adoption studies of online context (Koufaris, 2002; J. C. C. Lin & Lu, 2000), productivity in the workplace (O’Cass & Grace, 2004; Yang, 2005), Wireless Application Protocol (WAP), phones (Nysveen, Pedersen, & Thorbjornsen, 2005b), and mobile commerce (Y.-S. Wang et al., 2006). Lai, Lai, and Jordan (2009); Luo, Li, Zhang, and Shim (2010); T. Zhou, Lu, and Wang (2010); Bumguardner, Strong, Murphrey, and Dooley (2014); and Marchewka and Kostiwa (2014) concluded PE influences BI. This leads us to hypothesize the following:
EE
EE was consistently related to BI in both organizational and nonorganizational settings. EE effectively measures technology adoption behavior in pretechnology implementation stages. Postimplementation studies cannot access details of product/service features (Venkatesh & Morris, 2000). EE is ease of learning a technology (Meuter, Ostrom, Roundtree, & Bitner, 2000; Venkatesh & Brown, 2001; Venkatesh et al., 2003). EE evolved from PEOU and complexity variable. Complex technologies face resistance (Y. E. Lee & Benbasat, 2004; Meuter, Bitner, Ostrom, & Brown, 2005; Venkatesh & Zhang, 2010).
Usability characteristics explain PEOU (Lederer, Maupin, Sena, & Zhaung, 2000). Plouffe et al. (2001) and Venkatesh et al. (2003) have linked EE to PEOU as they both measure complexity levels in technology usage. Better ease of use promotes usefulness (Au & Kauffman, 2008; Mallat, 2007; Ondrus & Pigneur, 2006; Venkatesh & Davis, 2000; Vrechopoulos, Constantiou, Sideris, Doukidis, & Mylonopoulos, 2003). Ease of use in mobile services is a crucial factor for adoption (C. Kim, Mirusmonov, & Lee, 2010; H. F. Lin, 2011).
According to Venkatesh (2000), inexperienced people in surveys respond based on beliefs. PEOU was strongly related to BI in TAM, TAM2, and combined technology acceptance model and technology planned behavior (C-TAM-TPB; Venkatesh et al., 2003; Y.-S. Wang, Wang, Lin, & Tang, 2003). There are various aspects of experience (Luarn & Lin, 2005; Venkatesh & Davis, 2000; Y.-S. Wang & Liao, 2007). Amin, Hamid, Lada, and Anis (2008) observed the PEOU’s relationship with BI in mobile banking service adoption. PEOU was also used by AL Rawashdeh, Abu-Errub, Areiqat, and Dbbaghieh (2012) to study e-learning adoption, Internet pass delivery adoption (M. Y. Wu, Yu, & Weng, 2012), e-books adoption (Gao & Deng, 2012), and interaction board adoption (Wong & Dioko, 2013).
Foon and Fah (2011); Pappas, Giannakos, Pateli, and Chrissikopoulos (2011); Yahya, Nadzar, Masrek, and Rahman (2011); Govender and Sihlali (2012); Moghavvemi, Salleh, Zhao, and Mattila (2012); and Jeong and Yoon (2013) validated significant relationship of EE and BI. Hence, we hypothesized the following:
SI
SI is an individual’s belief on other’s expectation of him or her to use a system (Venkatesh & Davis, 2000). SI construct consists of family, relatives, and friends items (Pedersen & Ling, 2002). SI has two facets. That is interpersonal and external influence in DOI theory. Interpersonal influence occurs from family, friends, neighbors, and relations, whereas media externally influences (Bhattacherjee, 2001; Teo & Pok, 2003). SI in UTAUT evolved from social factors, social image, and subjective norms. S. Singh et al. (2010), Puschel et al. (2010), and Riquelme and Rios (2010) noticed the strong family and friends influence in technology adoption. Social norm explains SI. SI is a perception an individual holds on people important to him or her expecting a particular behavior (Puschel et al., 2010).
Karahana and Limayem (2000) validated social norm by studying email acceptance (Hsu & Lu, 2004), online games (S. C. Chan & Lu, 2004), Internet banking (Riquelme & Rios, 2010; Schepers & Wetzels, 2007), and mobile banking adoption. Dahlberg, Mallat, Ondrus, and Zmijewska (2008) and Puschel et al. (2010) found a significant relationship of social norm with BI. van Biljon and Kotze (2008) found two facets of social pressure. They are neighbors and family as well as relations. Puschel and Mazzon (2010) studied product decision patterns for Internet service adoption using SI.
Rural people depend on opinion leaders for decision making. In these situations, SI provides vital inputs on varied belief structures and attitudes. Venkatesh and Davis (2000), Cheong and Park (2008), Akour (2009), Lai et al. (2009), Williams (2009), C. Kim et al. (2010), and Chen and Chang. (2011) validated SI effect on BI. Therefore, we hypothesized the following:
Attitude
Attitude variable was widely used in TAM (Fishbein & Ajzen, 1975). The attitude variable provides insight on favorable and unfavorable beliefs about a specific behavior (Xu, 2006). Attitude explained adoption leading to intention development for decades (Schepers & Wetzels, 2007). Ajzen and Fishbein linked attitude to BI as early as 1980. Their work garnered good support.
TRA and TPB models assume that intention exactly predicts an individual’s behavior better. Ajzen in 1985 argued intention as a function of attitude and reiterated again in 2002. Attitude is an outcome of personal influence and SI (Nysveen et al., 2005b). Later, Nysveen et al. (2005b) concluded relationship between attitude and BI varies for technologies in service sectors. Tsang, Ho, and Liang (2004), Park et al. (2007), Gao and Deng (2012), and Asif and Krogstie (2012) validated attitude’s relationship with intention. This led us to hypothesize the following:
PR
PR is an insecure feeling about technologies (Bebko, 2000; M. Kim & Lennon, 2000; Venkatesh & Brown, 2001). During 1960s, technology adoption studies used PR variable (Laroche, McDougall, Bergeron, & Yang, 2004). Doubts augment risk perception on technologies (Chen, 2008; Gewald, Wüllenweber, & Weitzel, 2006; I. Lee, Choi, Kim, & Hong, 2007; Ndubisi & Sinti, 2006). Risk perception includes low trust, technological anxiety, and behavioral introspection variables.
Security is a concern for banks in the mobile banking introduction where data safety (Coursaris, Hassanein, & Head, 2003), security aspect (Luarn & Lin, 2005), and immediate action on lost PIN codes (Kuisma et al., 2007; Poon, 2008) need attention. Strategy plays an important role in managing consumer anxiety (G. Kim, Shin, & Lee, 2009; Koenig-Lewis, Palmer, & Moll, 2010). Banks need strong know your customer (KYC) norms (Dasgupta et al., 2011). Privacy issues fuel increased risk perception (Bansal, Zahedi, & Gefen, 2010; Dupas, Green, Keats, & Robinson, 2012; Eastlick, Lotz, & Warrington, 2006; Greenberg & Baron, 2008; Lim, 2003; Malhotra, Kim, & Agarwal, 2004; Tan & Teo, 2000). PR gained recognition from scholars in IS studies by providing insight on hidden intentions behind a conduct. Service intangibility makes consumer decision complex and sensitive (Bebko, 2000; J. Kim & Lennon, 2013; Laroche et al., 2004).
Pavlou (2003) described PR as user’s expectation of loss in the course of achieving targeted result. Coursaris et al. (2003) observed 62,000 mobile phones lost by London taxi passengers. J. H. Wu and Wang (2005) found a significant relationship between PR and intention studying mobile commerce adoption at Taiwan. Furthermore, Gu, Lee, and Suh (2009); Luo et al. (2010); Safeena, Date, and Kammani (2011); Monitise (2012); and Sathya and Sabhyasachi (2015) found PR as a major barrier in mobile banking adoption. Therefore, we can hypothesize the following:
BI
BI is defined as the degree of user’s willingness to use new technology. Ajzen and Fishbein in 1980 introduced BI as reliable predictor. Multiattribute models used BI. Ajzen and Fishbein explored consumer belief, attitudes, and intentions. Most of the technology adoption frameworks used BI as the dependent variable. Predicting outcomes were better (DeLone & McLean, 2003; Venkatesh et al., 2003).
Featherman and Fuller (2003); Cunningham, Gerlach, and Harper (2004); and Lapointe and Rivard (2005) concluded BI development patterns vary, and they depend on features of technologies. BI played vital role in IS adoption studies (Y.-S. Wang & Liao, 2007; T. Zhou et al., 2010).
UTAUT had voluntariness of use and experience as MVs. They were only significant in organizational settings. Prior experiences of mobile banking were nil in rural areas, and therefore, study selected age and gender for moderation analysis. Age and gender are demographic variables. Baker, Al-Gahtani, and Hubona (2007); Sulaiman, Jaafar, and Mohezar (2007); Harma and Dubey (2009); and Alafeef, Singh, and Ahmad (2011) validated importance of age and gender role in IS research.
Gender (MV)
Gender is one of the crucial variables in consumer behavior research (Forsythe & Chun, 2000). Lack of gender-based studies, especially in mobile banking adoption research, was clear (Thomas & Taskov, 2007; Venkatesh & Morris, 2000). Some isolated technology adoption studies are found on email (Venkatesh & Morris, 2000), information retrieval (Venkatesh & Morris, 2000), e-learning (Ong & Lai, 2006), communication technologies (Laforet & Li, 2005), and online purchasing behavior (Thomas & Taskov, 2007).
Morris and Venkatesh (2000) identified gender and age differences in technology adoption. Venkatesh and Morris (2000) and Venkatesh (2000) concluded EE as a stronger determinant for women than men supported by Venkatesh et al. (2003). Kirchmeyer (2002) observed gender can give psychological insight explaining mobile banking adoption behavior. Perea y Monsuwé, Dellaert, and de Ruyter (2004) found that men were interested than women in the online shopping trail. Females preferred more catalog and mall shopping. Consistent records of age and gender moderation were found in the literatures (Nysveen et al., 2005b; Venkatesh et al., 2003).
According to Venkatesh, Morris, and Ackerman (2000), PU affected attitudes at the workplace where external suggestions shaped female attitude. Lynott and McCandless (2000) observed that gender role depends on birthplace and culture. Gender and age were widely acclaimed by Venkatesh et al. (2003) as key determinants. Garbarino and Strahilevitz (2004) and Nysveen et al. (2005a, 2005b) stated gender as important demographic variable in technology adoption studies. Li and Kishore (2006) theorized that gender moderates the relationship in the path of PE, EE, and SI leading to BI. We can hypothesize the following:
According to Fernando and Porter (2002), men adopt technologies faster than women. Slyke, Comunale, and Belanger (2002) found gender moderation in Internet banking adoption supported by Lichtenstein and Williamson (2006). Sulaiman et al. (2007) in a Malaysian study found 70% of men preferred mobile banking compared with 34.4% females as men read more technology magazines. Females used more online shopping than men. In the latest research on gender differences, L. Zhou, Dai, and Zhang (2007) identified gap reduction in gender behaviors. Porter (2008), further explaining Fernando and Porter’s (2002) findings, concluded that, in the transportation sector, males adopted technologies faster as their occupation demanded it. Kwiatkowski, Zettlemoyer, Goldwater, and Steedman (2010) observed low-cost online service drives mobile banking adoption.
Age
Affiliation needs increase with age. Elderly people with low experience gave more importance for SI (Venkatesh & Morris, 2000). Older people resisted scanners (Oumlil & Williams, 2000). Age was preferred by psychology researchers and practitioners (Mattila, Karjaluoto, & Pento, 2003). While reviewing age literature, the quest was on whether young or old people prefer technology. Sulaiman et al. (2007) found that younger age group was interested in technologies. Laukkanen (2007a, 2007b) related education and income of people with adoption. According to Rettie (2008), age explained adoption than gender in Western geographies. Venkatesh and Goyal (2010) theorized gender and age moderating independent variables in UTAUT model. This lead us hypothesize the following:
Moderation findings in UTAUT are reliable (Venkatesh et al., 2003). Varied demographic patterns and cultural influence make studying age complicated. Most researchers have found aging results in low intellectual ability. Harma and Dubey (2009) observed 20 to 30 age group corporate people had a low PR on mobile banking. Needs and preferences change with age. Age and gender are crucial in moderating paths of independent and dependent variables (Y. C. Lee, Li, Yen, & Huang, 2010).
Research Methodology
The study probes prevailing mobile banking service adoption problem by descriptive approach.
Data Collection
A questionnaire consisted of variables and their items. Questionnaire measured items on a 7-point scale. Technology adoption studies in nonorganizational setting measured variables on a 7-point scale. Survey method execution prompted administering of questionnaire.
Sampling Design
The mixed sampling technique helped to reach 959 samples. The technique combines probability and nonprobability sampling methods. Absence of sample frame led to use of nonprobabilistic sampling method. Mixed sampling enhances internal and external validity of a study. It facilitates generalization with less bias in procedure.
Probabilistic sampling methods randomly pick samples. Probabilistic sampling requires a sample frame. Villagers’ list of names (sample frame) was not clearly available. The Indian Census database as sample frame was a clear fit in sampling process (see http://censusindia.gov.in/Census_Data_2001/Village_Directory/List_of_Villages/List_of_Villages_Alphabetical.aspx?cki=&ComboState_Code=29). With systematic probability sampling, villages were randomly selected. Nonprobabilistic sampling permits inclusion or exclusion of population elements in a sample. Researcher used judgmental sampling to include rural respondents in the sample (see Figure 1).

Mixed sampling technique.
Probabilistic sampling method randomly picked villages from a vast exhaustive list of villages in Karnataka using 2011 census. Calculation of Kth element is as follows:

where N is the population size, and n is the sample size.
Rural population of Karnataka was 37,469,335 (N); 959 (n) was sample size. When substituted, the result was 39,071. So 39,071 was kth element. Every 39,071th village in the exhaustive list was a rural area for the survey. Judgmental sampling helped in identifying the respondent depending on his or her ability to understand and respond to queries. The survey collected a total of 972 samples, out of which 959 samples were eligible for editing, coding, and tabulating processes.
Data Analysis and Interpretation
Data analysis consisted of various steps. The procedure examined coded data before analysis. The steps involved in data analysis are as follows:
Data screening for treatment (missing data, unengaged responses, outliers)
Reliability analysis (for Cronbach’s α values above .70)
Exploratory factor analysis (EFA) for validity
Multiple regression analysis
Mean centering instead of median split
Interaction/moderation analysis (Aiken and West’s approach, Jeremy Dawson’s approach).
After treating data, constructs of theoretical framework were subjected to reliability analysis. Convincing values of Cronbach’s alpha cleared the way for EFA. EFA was conducted to check sample adequacy by Kaiser–Meyer–Olkin (KMO) test and convergent validity of the constructs. Principal components analysis (PCA) extracted pure and true eigenvalues. While performing EFA, multicollinearity was also examined to decide on rotation pattern. As there was no correlation among constructs, variables were orthogonally rotated with varimax rotation. After confirming validity and successful extraction of constructs, multiple regression analysis revealed relationship strengths. In the interaction analysis, every data entry influences the output. Interaction approach followed mean centering for accurate results. Previous studies used median split. Median split, though widely followed, was not supported by IS adoption researchers (Irwin & McClelland, 2003). Splitting converts a continuous variable to categories (low, high) on the basis of median. Studies that preferred median split were much familiar using ANOVA not regression analysis. Median split results in loss of predicting power in a continuous variable (Aiken & West, 1991). Nearly one third of the data are lost (MacCallum et al., 2002) and lead to false conclusions (Austin, Barbir, Ferris, & Garg, 2004; McClelland, Lynch, Irwin, Spiller, & Fitzsimons, 2015). Centering was essential in interval scale measurement. Centering concentrates power in variables (Snijders & Bosker, 2012). Later interaction moderation analysis output provided interesting insights on relationships.
Preanalysis Data Screening
The details of factor and reliability analysis are as follows (see Table 2).
Factor Loadings of Constructs.

Source. Data Analysis.
PCA method perfectly loads variables with small dimensions (Berk, 2008). All items under six factors loaded on their constructs. KMO test and Bartlett’s test for sample adequacy were significant at 0.853, explaining 62.75% of variance from six factors. Gorsuch (1983) recommended minimum sample size of 100 for EFA. Comrey and Lee (1992) suggested 100 samples are poor for EFA, 200 to 300 are good, 500 are very good, and 1,000 samples are excellent supported by Pearson and Mundform (2010). Sample size 959 was convincing for EFA (see Table 3).
Reliability Value of Constructs.

Source. Data Analysis.
Reliability value of the model remained .798. Constructs exceeded the acceptable norm of .50 to .60. Reliability score of all constructs met Hari, Egbu, and Kumar’s (2006) required alpha value of mobile banking adoption constructs (equal or more than .70).
In multiple regression analysis, we followed Aiken and West’s approach for mean centering of variables. Tables 4 to 6 represent a multiple regression analysis.
Results of Multiple Regression.

Source. Data Analysis.
ANOVA of the model.
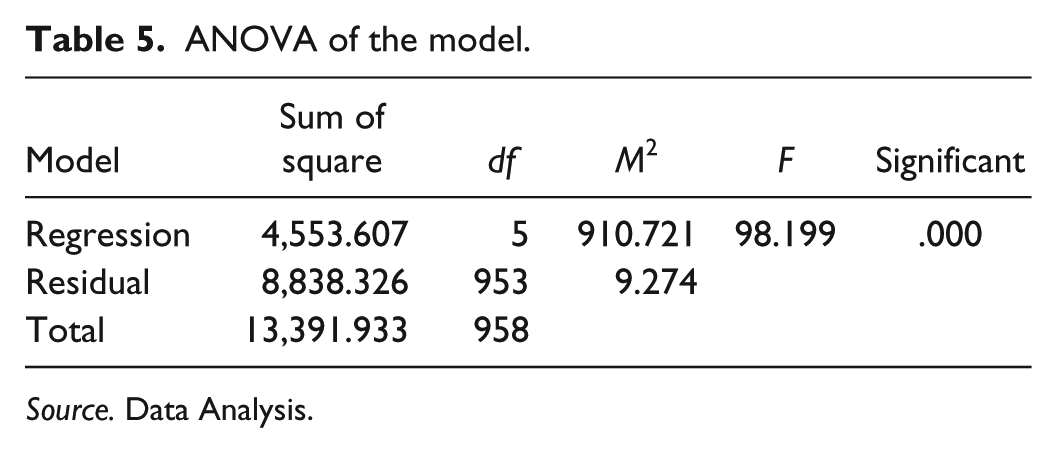
Source. Data Analysis.
Regression Values.

Source. Data Analysis.
R and R2 values were .583 and .340. ANOVA was statistically significant. Independent variables, PE, EE, SI, Attitude, and PR, were significantly related to dependent variable BI. H1, H2, H3, H4, and H5 were satisfied.
Centered variables were further subjected to interaction analysis. Gender was not centered as it was a perfect categorical variable. Attitude had interaction effect by age and gender. Tables 7 to 9 and diagrams of interaction analysis are as follows.
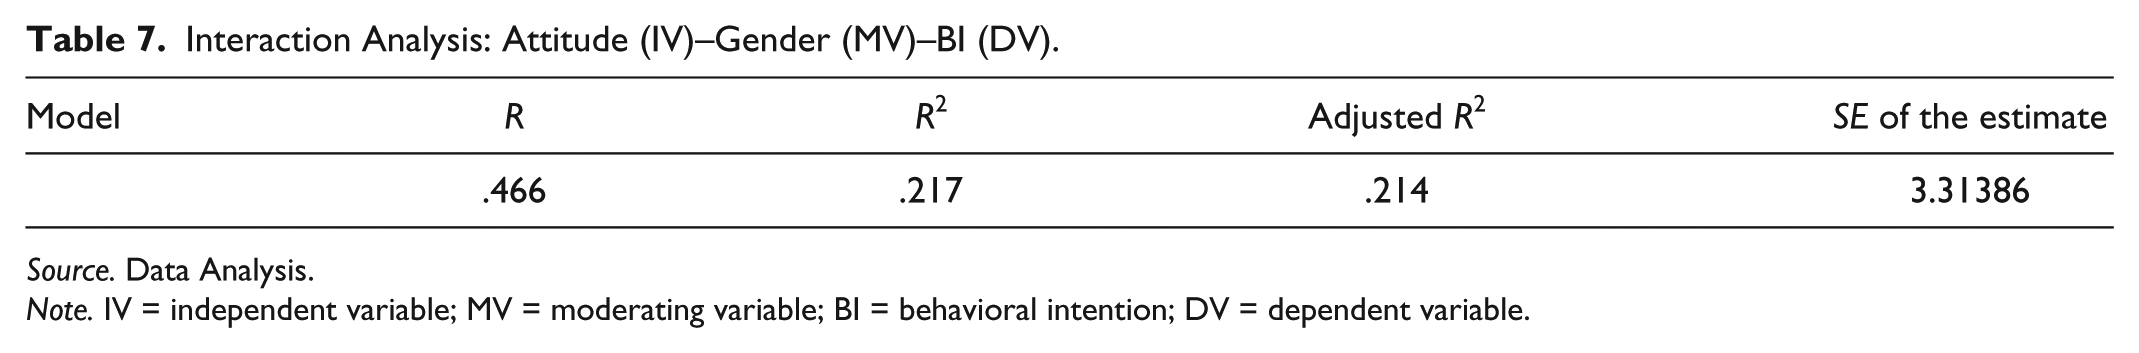
Interaction Analysis: Attitude (IV)–Gender (MV)–BI (DV).
Source. Data Analysis.
Note. IV = independent variable; MV = moderating variable; BI = behavioral intention; DV = dependent variable.
ANOVA of Att-Gende-BI Interaction.
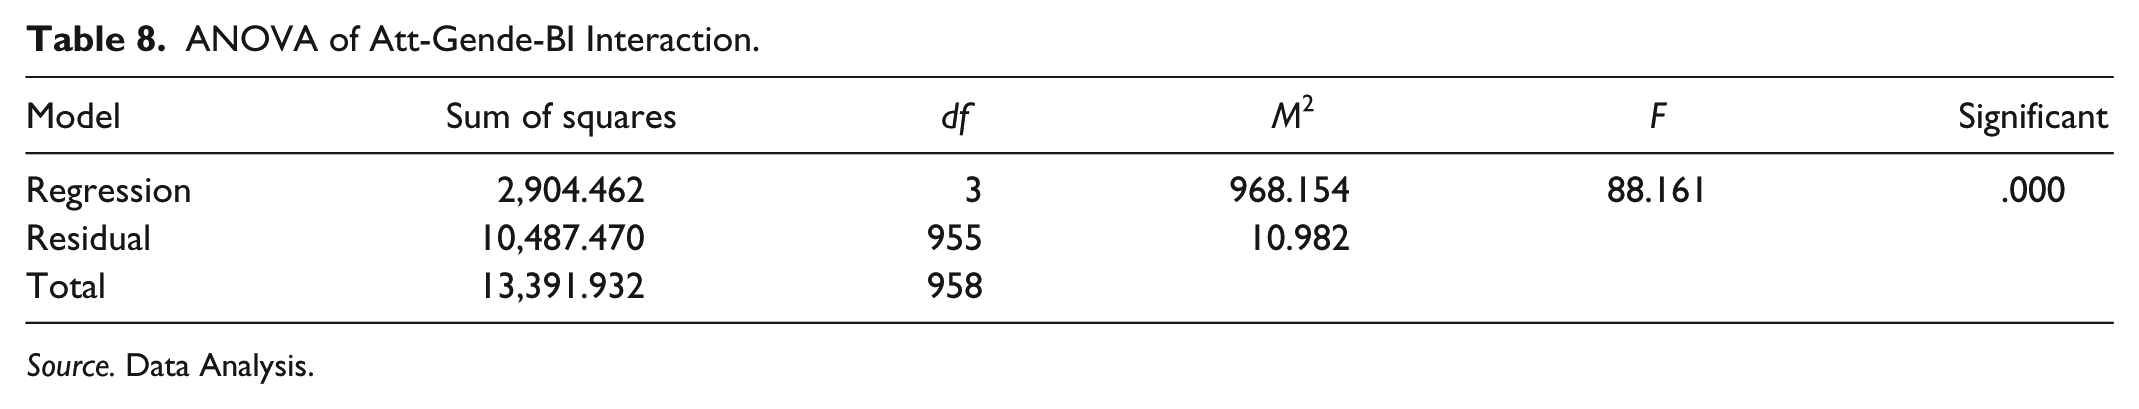
Source. Data Analysis.
Interaction Relationship (ATT–Gender–BI).

Source. Data Analysis.
Note. ATT = attitude; BI = behavioral intention.
Gender moderated attitude’s path to BI. R and R2 values were .466 and .217. ANOVA was significant. Interaction was significantly related (.028) with beta −.182. Figure 2 is an interaction output.

Interaction effect of gender on attitude’s path toward behavioral intention.
The interaction plot follows Jeremy Dawson’s approach. Gender dampened positive relationship between BI and attitude (see Tables 10-12).
Interaction Analysis: Attitude (IV)–Age (MV)–BI (DV).

Source. Data Analysis.
Note. IV = independent variable; MV = moderating variable; BI = behavioral intention; DV = dependent variable.
ANOVA of Att-Age-BI Interaction.

Source. Data Analysis.
Interaction Relationship of Age.

Source. Data Analysis.
Note. ATT = attitude.
Age moderated attitude’s path to BI. R and R2 values were .466 and .217. ANOVA was significant. Interaction variable was significant (.032) with beta value .081 (see Figure 3).

Interaction effect of age on attitude relationship with behavioral intention.
Age strengthened the positive relationship of attitude and BI, but the gender weakened relationship. Age provided vital insight on mobile banking adoption behavior in rural Karnataka (see Figure 4).
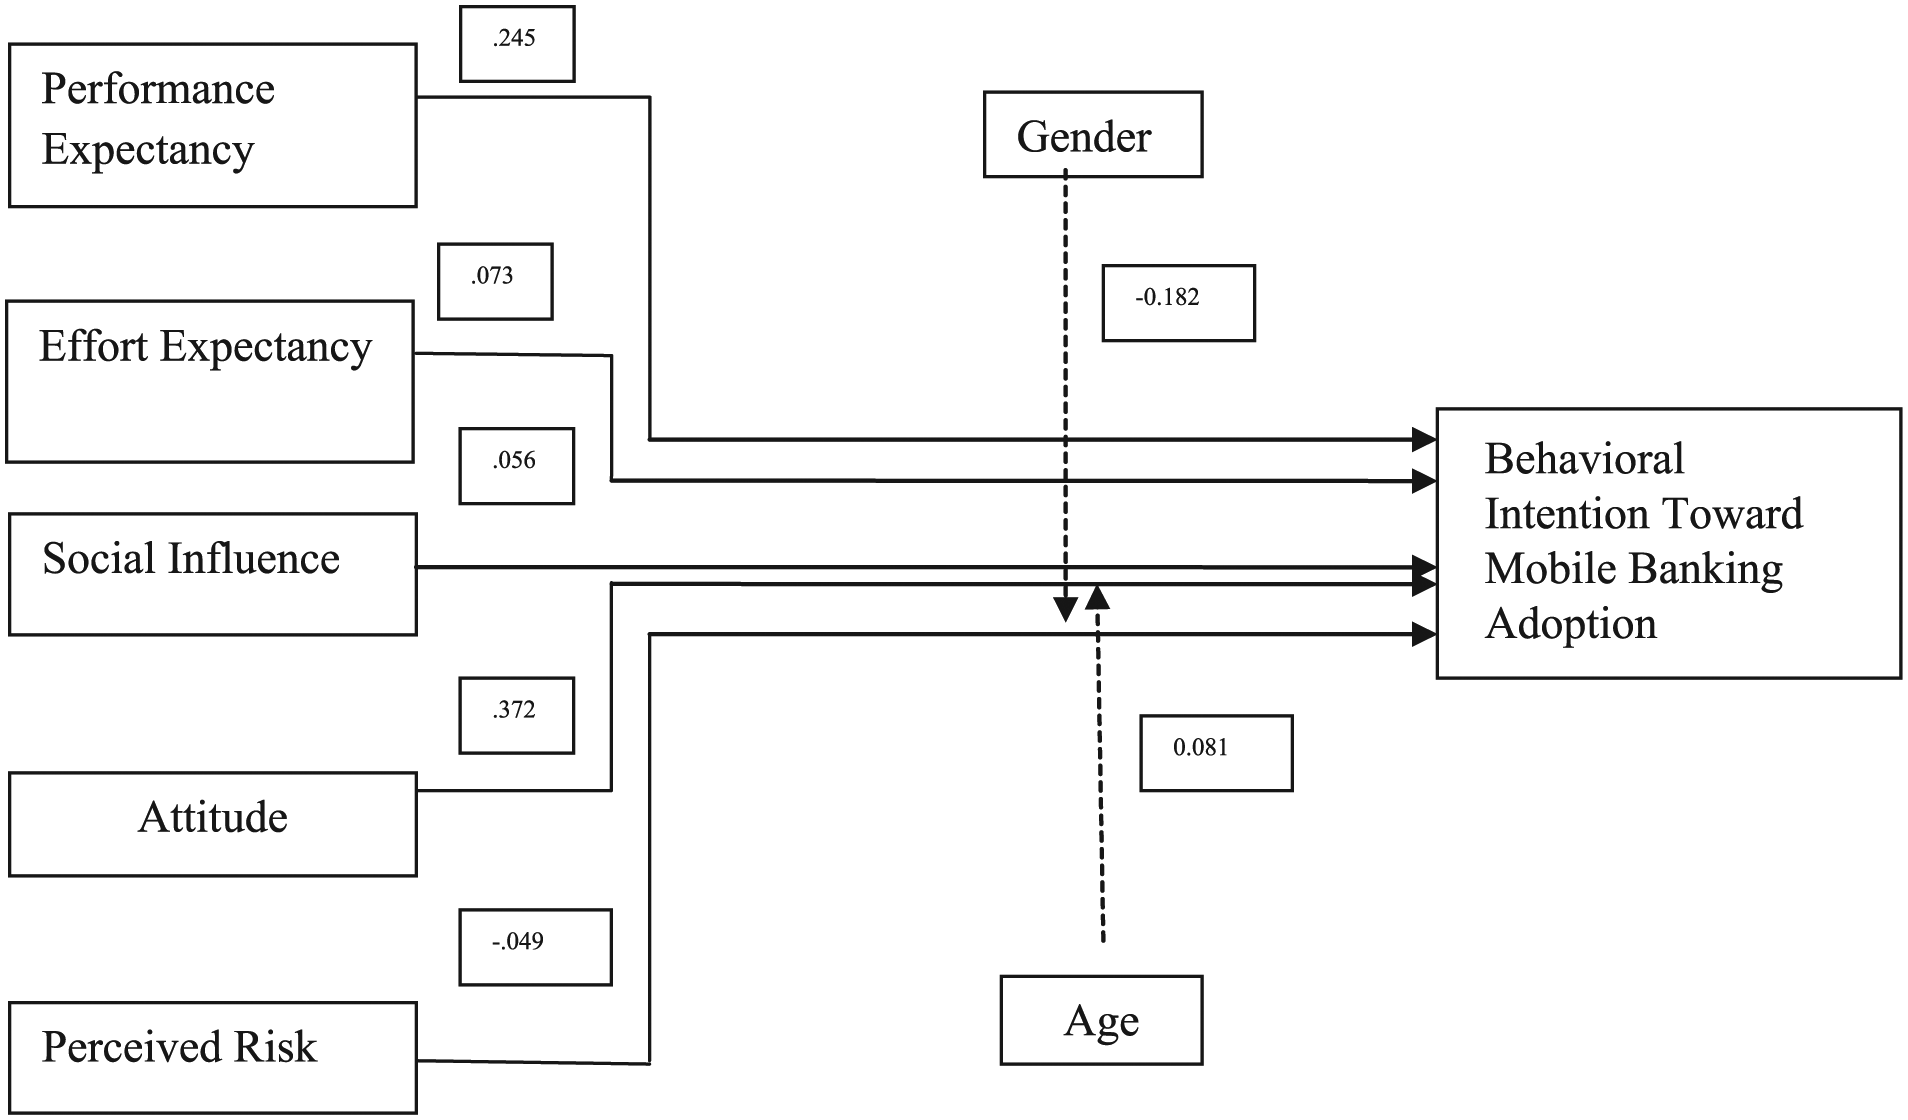
Relationship of independent and moderating factors leading to intention.
Among H6 and H7, only H6d and H7d were statistically significant. H6a, H6b, H6c, H7a, H7b, and H7c were not statistically significant. Results are found in the online appendix.
Implications
Technology, installed just as a part of the campaign, is aimless. Hands on training and demonstrations drive adoption (Keengwe et al., 2008). By the findings, it was clear that if mobile banking technology improves job performance compared with traditional banking methods, it gets adopted as PE was related to BI. If mobile banking service is easier to learn, rural people would adopt it as part of EE’s relationship with BI. SI revealed a mild influence of family members and friends on people in adopting mobile banking service. The attitude was significantly related to the BI signaling presence of favorable environment for mobile banking service. PR had a negative relationship indicating risk perception of rural people. In interaction analysis, age strengthened attitude’s relationship with BI. Higher the age of an individual, more positive would be the individual’s attitude leading to BI development.
Implication on Academics
Generalization is tough for academicians in adoption and interaction curve predictions due to uneven demographic patterns (Rheingold, 2002). According to Alvesson and Kärreman (2007) and Johns (2006), geographical variables of various adoption stages (timelines) would give groundbreaking knowledge on technology adoptions supported by Stofega and Ilamas (2009). Survey projects funded by government research agencies such as the NCAER (National Council of Applied Economic Research) and NSSO (National Sample Survey Organization) can spread awareness of financial inclusion. These projects improve financial literacy among rural people. Rural people can learn the need of opening and sustaining bank accounts. Bank transactions enhance their cash management skills and increase national financial depth.
E-Commerce offers bank opportunity in mobile banking service. Mobile currency service providers can get a gist of rural population’s mind-set by academic studies. The campaigns should communicate mobile banking advantages. Ease of use variable gives product/service implication information to corporate sector (Venkatesh, Thong, Chan, Hu, & Brown, 2011). Mild SI relationship with BIs indicates probability of opinion leader’s influence to help technology adoption. Corporates can target promotions of mobile banking services with opinion leaders. The issue of risk perception needs attention. Instilling confidence and trust eliminates gossips and grapevines. As more aged people are with favorable attitude, people aged ≥30 years can also be targeted based on mobile banking’s valuable contribution to their occupation and lifestyle. Academics can supplement corporate with crucial inputs to target campaigns. Companies can design campaigns to diffuse mobile banking service technology among rural people (Munongo & Chitungo, 2013; Sathya & Sabhyasachi, 2015).
Conclusion
Mobile phones are the future of financial transaction. It should reach average person (Sharma & Kansal, 2012). Favorable attitude was found in rural people. These factorial relationships hold crucial information for technology diffusion.
Relevance of Findings
The findings were relevant with earlier studies conducted by IS adoption scholars. List of supporting studies in chronological order is as follows:
PE was related to BI, supported by J. C. C. Lin and Lu (2000), Wolcott and Cagiltay (2001), Koufaris (2002), Pikkarainen et al. (2004), Cheong and Park (2005), Chiu et al. (2005), Eriksson et al. (2005), Luarn and Lin (2005), Nysveen et al. (2005b), Guriting and Ndubisi (2006), Y.-S. Wang et al. (2006), Y. K. Lee, Park, and Chung (2008), Chung and Kwon (2009), Lai et al. (2009), Luo et al. (2010), and T. Zhou et al. (2010).
EE was related to BI, supported by Venkatesh and Davis (1996, 2000), Meuter et al. (2000), Venkatesh and Brown (2001), Venkatesh et al. (2003), Meuter et al. (2005), Y.-S. Wang and Liao (2007), Amin et al. (2008), Cohen (2008), Y. K. Lee et al. (2008), Chung and Kwon (2009), Venkatesh and Zhang (2010), Foon and Fah (2011), Pappas et al. (2011), Yahya et al. (2011), Moghavvemi et al. (2012), Govender and Sihlali (2012), and Jeong and Yoon (2013).
SI had mild influence on BI, supported by Venkatesh and Davis (2000), Lu, Yao, and Yu (2005), Schepers and Wetzels (2007), Cheong and Park (2008), Wills et al. (2008), Akour (2009), Lai et al. (2009), Williams (2009), C. Kim et al. (2010), Puschel and Mazzon (2010), Riquelme and Rios (2010), Quazi (2011), and Shen et al. (2011).
Attitude variable was related to BI, supported by Ajzen (1985), Pedersen, Methlie, and Thorbjornsen (2002), Tsang et al. (2004), Park et al. (2007), and Schepers and Wetzels (2007).
PR was negatively related to BI in the study. PR was found to be a barrier, supported by Gu et al. (2009), Luo et al. (2010), Safeena et al. (2011), Monitise (2012), and Sathya and Sabhyasachi (2015).
Gender moderated attitude’s path to BI. Gender’s moderation was supported by Kirchmeyer (2002), Venkatesh et al. (2003), Garbarino and Strahilevitz (2004), and Nysveen et al. (2005a).
The age moderated attitude’s path toward BI. Mattila et al. (2003); Laforet and Li (2005); Laukkanen et al. (2007); Flinders (2008); Cruz, Filgueiras Neto, Muñoz-Gallego, and Laukkanen (2010); and Venkatesh et al. (2010) supported age’s moderation. Findings unsupported by earlier studies are given in Table 13.
Unsupported Findings.

Source. Literature Review.
Note. SI = social influence; BI = behavioral intention; PE = performance expectancy; EE = effort expectancy.
IS Studies from 2008 to present timeline supported our findings. Compared with PE, EE, and attitude’s strength, SI’s relationship with BI was weak. However, responses indicated that surrounding people mildly influenced rural people’s choice in mobile banking service adoption. PR was negatively related to BI. SI consistently did not influence BI in the Venkatesh and Morris (2000) and Chau and Hu (2001) studies. Venkatesh et al.’s (2003) study upholds varied demographic distributions as a reason. Kleijnen et al. (2004) and S. C. Chan and Lu (2004) used SI construct to study wireless finance adoption and Internet banking, where a significant relationship with BI was clear. Gender dampened strength between attitude and BI. Age strengthened the relationship. The study did not support the Ben Oumlil and Williams (2000). Laukkanen and Lauronen’s (2005) findings were older age resulted in lesser chances of technology adoption. A study supported rare finding of Karjaluoto, Pakola, Pietilä, and Svento (2003), where middle-aged people (30-49 years) adopted technology faster than younger people. Furthermore, Laforet and Li (2005) in china, Flinders (2008) in Japan, and Cruz et al. (2010) in Brazil had similar conclusions. Study concludes rural elders have a favorable attitude leading to BI development adopting mobile banking service.
Future Scope of the Study
In Pune (Maharashtra), electricity payment, telephone bill payments, and funds transfers are already launched as pilot projects. Future studies can aim inclusion of more independent variables and dependent variables with added moderators at an expanded territory. SI apart from the present practice of measuring in basic items can also be measured from social network sources (Goldstein & Cialdini, 2009; Sykes, Venkatesh, & Gosain, 2009). This can work well in an urban setting. According to Central Intelligence Agency (2011), India is a mixture of multilingual, multiethnic symphony. North and South India are demographically different. Identical financial inclusion campaigns all over the country may not yield success. As moderations of age and gender have occurred, especially in the path of attitude to BI, more studies can also focus on exploring attitude and its nearest components leading toward development of BI.
Footnotes
Declaration of Conflicting Interests
The author(s) declared no potential conflicts of interest with respect to the research, authorship, and/or publication of this article.
Funding
The author(s) received no financial support for the research and/or authorship of this article.