
Abstract
Moderated multiple regression (MMR) is frequently used to test moderation hypotheses in the behavioral and social sciences. In MMR with a categorical moderator, between-groups heteroscedasticity is not uncommon and can inflate Type I error rates or reduce statistical power. Compared with research on remedial procedures that can mitigate the effects of this violated assumption, less research attention has focused on statistical procedures that can be used to detect between-groups heteroscedasticity. In the current article, we briefly review such procedures. Then, using Monte Carlo methods, we compare the performance of various procedures that can be used to detect between-groups heteroscedasticity in MMR with a categorical moderator, including a heuristic method and a variant of a procedure suggested by O’Brien. Of the various procedures, the heuristic method had the greatest statistical power at the expense of inflated Type I error rates. Otherwise, assuming that the normality assumption has not been violated, Bartlett’s test generally had the greatest statistical power when direct pairing occurs (i.e., when the group with the largest sample size has the largest error variance). In contrast, O’Brien’s procedure tended to have the greatest power when there was indirect pairing (i.e., when the group with the largest sample size has the smallest error variance). We conclude with recommendations for researchers and practitioners in the behavioral and social sciences.
Keywords
Testing for the equality of regression slopes is frequently conducted in the behavioral and social sciences. Evidence of this can be found in research on differential prediction (Aguinis, Culpepper, & Pierce, 2010; American Educational Research Association [AERA], American Psychological Association [APA], & National Council on Measurement in Education [NCME], 1999; Saad & Sackett, 2002) and analysis of covariance (Fox, 2008; Huitema, 1980; Rutherford, 1992). Testing for the equality of regression slopes is equivalent to testing whether the relationship between a continuous outcome and a continuous predictor differs depending on a third variable—a moderator (Saunders, 1956; Stone-Romero & Liakhovitski, 2002).
The study of moderator variables, in general, is important for theory development and knowledge cumulation in education, management, industrial-organizational psychology, and related disciplines. Consistent with this, Hall and Rosenthal (1991) noted,
If we want to know how well we are doing in the biological, psychological, and social sciences, an index that will serve us well is how far we have advanced in our understanding of the moderator variables of our field. (p. 447)
Although a variety of procedures exist for detecting the effects of continuous and categorical moderators (Stone-Romero & Liakhovitski, 2002; Zedeck, 1971), researchers have noted that moderated multiple regression (MMR) has become the major procedure for testing hypotheses involving categorical moderators (Aguinis, 2004; Overton, 2001; Sackett & Wilk, 1994; Shieh, 2009).
Regrettably, in MMR with a categorical moderator, it is not uncommon to violate the homoscedasticity assumption (see Aguinis & Pierce, 1998; DeShon & Alexander, 1996; Overton, 2001), which can lead to inflated Type I errors or reduced statistical power (DeShon & Alexander, 1996; Ng & Wilcox, 2010; Overton, 2001). More specifically, in MMR, the form of heteroscedasticity that can manifest is one in which the error variance differs across the levels of a categorical moderator (e.g., gender; for a review, see Aguinis, 2004; DeShon & Alexander, 1996; Ng & Wilcox, 2010; Rosopa, Schaffer, & Schroeder, 2013; Wilcox, 1997), or stated another way, between-groups heteroscedasticity exists (Ng & Wilcox, 2010).
Based on a review of three journals (Academy of Management Journal, Journal of Applied Psychology, and Personnel Psychology) from 1987 to 1999, Aguinis, Peterson, and Pierce (1999) identified 87 articles that reported at least one test for the equality of regression slopes. Out of 117 tests, Aguinis and his colleagues found that at least 39% of these violated the assumption. The implication of this finding is that researchers might have wrongly concluded that an interaction exists in the population when it does not (Type I error) or that an interaction does not exist in the population when it does (Type II error). In either case, “substantive research conclusions can be erroneous, theory development can be hindered, and incorrect decisions can be made . . .” (p. 319).
Although there exist a number of remedial procedures (Rosopa et al., 2013) that can be used to mitigate the effects of between-groups heteroscedasticity in MMR, including the use of statistical approximations (Alexander & Govern, 1994; DeShon & Alexander, 1994; Shieh, 2009), robust methods (Cribari-Neto, 2004; Long & Ervin, 2000; Wilcox, 2005), and weighted least squares regression (Overton, 2001; Rosopa, 2006), less research attention has focused on statistical procedures that can be used to detect between-groups heteroscedasticity in MMR. Currently, there is no empirical research that systematically compares the various approaches that can be used to detect between-groups heteroscedasticity. Thus, consistent with recommendations by Rosopa et al. (2013), one major purpose of the present article is to compare the performance of various procedures that can be used to detect between-groups heteroscedasticity in MMR with a categorical moderator.
Although researchers across diverse disciplines (e.g., econometrics, psychology, and statistics) have suggested different approaches for detecting heteroscedasticity in general (Rosopa et al., 2013), some procedures are sensitive to non-normality. A robust approach by O’Brien (1979, 1981), however, has been recommended for use in ANOVA. Thus, another purpose of the present article is to suggest a variation of O’Brien’s procedure that can be used for instances in which a researcher is interested in testing for the equality of regression slopes.
Our article is divided into four major sections. First, we formally define the model used in MMR with a categorical moderator. Second, we describe between-groups heteroscedasticity and its biasing effects. Third, we review various procedures that can be used to detect between-groups heteroscedasticity, including O’Brien’s (1979, 1981) procedure. Fourth, we describe the results of a Monte Carlo simulation designed to assess the relative performance of various procedures that can be used to detect between-groups heteroscedasticity.
MMR With a Continuous Predictor and a Categorical Moderator
When testing for the equality of k regression slopes using MMR, a continuous outcome (y) is modeled as a function of a continuous predictor (x), a categorical moderator (z) (indexed by k − 1 regressors, that is, z1, z2, . . ., zk−1), and the two-way interaction between x and z (indexed by k − 1 product terms between x and the regressors). Population parameters are denoted by Greek letters such as β and
When k = 2, the full linear model for the ith observed response in the jth group can be expressed as

for i = 1, 2, . . ., nj, j = 1, 2, . . ., k, where nj is the jth sample size; β0, β1, β2, and β3 are unstandardized regression coefficients; and eij is the ith residual in the jth group (an estimate of ε ij , an unknown population error). Although Equation 1 is a fixed effects regression model, when the predictors are treated as random variables, the estimates of E(yij) can be viewed as conditional on the specific values of the predictors, that is, E(yij | xij, z1ij) (Bauer & Curran, 2005; Rencher, 2000).
More generally, for k ≥ 2, the full linear model for the
Note that normally distributed ε ij s are neither required nor assumed for the linear model to be valid (Rencher, 2000). However, when the normality assumption is invoked for statistical inferences (e.g., confidence intervals, hypothesis tests), this implies that the yijs (and ε ij s) are independent. When k = 2, the test for the equality of independent slopes is distributed as t with df = N − 4. When k > 2, the test statistic is distributed as an F random variable (see the appendix).
In Equation 1, the N residuals (eij) are assumed to have a diagonal N × N covariance matrix given by

(Fox, 2008; Rencher, 2000). Note the common variance on the main diagonal in Equation 2. Heteroscedasticity, in contrast, is said to exist when these variances are no longer equal. This can be denoted by

where
Between-Groups Heteroscedasticity and Its Biasing Effects
Extant research has found that between-groups heteroscedasticity can affect statistical inferences (e.g., increased Type I or Type II error rates) and these effects are nontrivial (DeShon & Alexander, 1996; Dretzke, Levin, & Serlin, 1982; Ng & Wilcox, 2010; Overton, 2001).
The error variance in the jth group (

where
Inspection of Equation 4 shows that if

where
This violated assumption has biasing effects on the Type I error rates and the statistical power of MMR whether subgroup sample size (nj) is equal or unequal across the categorical moderator. Although with equal njs and equal
With between-groups heteroscedasticity and unequal njs, however, the effects are much more severe. Type I error rates and statistical power “can be either gross underestimates or severe overestimates depending on the pattern of sample sizes relative to the pattern of error variances” (DeShon & Alexander, 1996, p. 270). More precisely, when the larger
To exacerbate matters, unequal njs are quite common in the behavioral and social sciences for a number of reasons. One reason is that attrition may result in unbalanced data (Shadish, Cook, & Campbell, 2002), such as in randomized experiments where participants in some conditions fail to complete an outcome measure. Another reason is that the population from which a researcher purposively samples could be disproportionate across subpopulations of the characteristic of interest (e.g., race; Shadish et al., 2002). This commonly occurs in the validation of personnel selection instruments (see, for example, Hattrup & Schmitt, 1990; Hunter, Schmidt, & Hunter, 1979). In addition, in longitudinal studies or in the analysis of archival data, missing values can lead to unequal njs across variables of interest (Schafer & Graham, 2002).
Overall, the biasing effects of between-groups heteroscedasticity on Type I error rates and statistical power can have implications on both theory development and practice in the behavioral and social sciences (Aguinis & Pierce, 1998; Oswald, Saad, & Sackett, 2000; Rosopa et al., 2013). For example, assume that sample sizes are unequal between two independent groups (e.g., male vs. female) and between-groups heteroscedasticity exists such that the larger error variance is paired with the group with the larger sample size (i.e., direct pairing). Furthermore, assume that the researcher/practitioner failed to detect a hypothesized slope difference between groups (i.e., between males and females) that actually exists in the population. Stated differently, the failure to detect a hypothesized moderating effect that exists in the population might be due to the influence of between-groups heteroscedasticity. As detailed in a review by Aguinis and Pierce (1998), inflated Type I error rates could lead to the publication of specious results. This seems plausible considering that, for decades, researchers have noted the problem of failing to detect hypothesized moderators using MMR (Aguinis & Stone-Romero, 1997; McClelland & Judd, 1993; Zedeck, 1971).
As noted above, researchers have identified a number of alternatives to MMR when between-groups heteroscedasticity exists. For example, DeShon and Alexander (1996) conducted a comprehensive Monte Carlo study evaluating the relative performance of various statistical approximations, with two statistical approximations (viz., A and J approximations) having the most promise. With a dichotomous moderator, Overton (2001) suggested a weighted least squares approach for MMR. In addition, some researchers have recommended certain robust estimators regardless of the form of heteroscedasticity (Cribari-Neto, 2004; Long & Ervin, 2000).
Because violation of the between-groups homoscedasticity assumption can afflict the Type I error rates and power of MMR, it would be useful to assess whether this assumption has been violated. The following section considers this issue.
A Review of Procedures for Detecting Between-Groups Heteroscedasticity
An issue seldom raised by researchers or practitioners in the context of MMR is how to detect violations of the between-groups homoscedasticity assumption. Although Aguinis (2004) explained that there are two methods (to be noted below) for evaluating whether the assumption has been violated, any procedure that can be used to test the equality of k independent variances could potentially be used to detect between-groups heteroscedasticity in MMR with a categorical moderator. Some procedures involve the variances of the residuals, whereas others may use some other measure of dispersion (Boos & Brownie, 2004; Conover, Johnson, & Johnson, 1981). Some procedures are used specifically in the context of ANOVA (e.g., Brown & Forsythe, 1974). Another procedure is used primarily in regression models in econometrics (e.g., Breusch & Pagan, 1979). In addition, as noted below, a rule-of-thumb has also been recommended in MMR with a categorical moderator (see DeShon & Alexander, 1996). However, the relative performance of these and other procedures described below has not been examined.
In addition, although a number of studies have compared various tests for homogeneity of variances specifically in ANOVA (see, for example, Conover et al., 1981; Martin & Games, 1977), we could not find any studies involving MMR with between-groups heteroscedasticity and the effects of direct and indirect pairing. For example, a simulation conducted by Conover et al. (1981) involved a one-way ANOVA with four independent groups, and they included only direct pairing conditions when N = 80. Thus, because neither sample size nor type of pairing was manipulated, the effect of these factors could not be examined. Games, Winkler, and Probert (1972) empirically investigated the robustness of various tests for homogeneity of variances to violations of the normality assumption in the context of ANOVA with three independent groups. However, because sample sizes were always equal across groups, pairing of error variances was not considered. Boos and Brownie (2004) reviewed the two-sample case and a one-way ANOVA, but did not report simulation results. In a simulation by Sarkar, Kim, and Basu (1999), they included a one-way ANOVA with three independent groups and considered both direct and indirect pairing for Ns as large as 120.
As noted above, Aguinis (2004) mentioned two methods for detecting between-groups heteroscedasticity. One was a heuristic method suggested by DeShon and Alexander (1996). The second was a statistical test by Bartlett (1937). In the sections that follow, we describe these and other procedures that could be used to detect between-groups heteroscedasticity.
Heuristic Method
DeShon and Alexander (1996) described a heuristic method to signal whether the between-groups heteroscedasticity assumption has been violated to such a degree as to unduly influence the results of MMR analyses. Specifically, when a researcher calculates the variance of the residuals separately within each of the k groups, the ratio of the largest estimated variance to the smallest estimated variance should not exceed 1.5. This ratio is computationally simple and does not require specialized software.
Note that the heuristic method is not a statistical test, but rather a rule-of-thumb and its statistical performance, in terms of Type I error or power, has not been examined. As a rule-of-thumb, the heuristic method may not possess the desirable property of being robust at any Type I error rate (α). That is, regardless of α (e.g., .01 or .05), a researcher would conclude that heteroscedasticity exists if the ratio (based on sample estimates of two variances) exceeds 1.5. However, the heuristic method was included in the present simulation to assess its performance relative to other procedures.
Bartlett
Bartlett (1937) developed a procedure that can be used to test for homogeneity of variances by conducting a transformation of the variances. To use this procedure, this test involves transforming the variances of the residuals across the levels of z. To test the null hypothesis that


and

where
Brown and Forsythe
To detect heteroscedasticity in the context of ANOVA, Brown and Forsythe (1974) suggested conducting a one-way ANOVA on the absolute value of the residuals around the group median instead of the mean (cf. Levene, 1960). Based on simulations conducted by Conover et al. (1981), tests for homogeneity of variances based on the median tend to control Type I error rates better than tests based on the mean. Brown and Forsythe’s procedure is relatively straightforward and appears to be less affected by skewed data in unbalanced designs than other procedures, while still providing adequate statistical power (Lix, 1996). In addition, because of its computational ease, it may be a very practical procedure for researchers and practitioners (Boos & Brownie, 2004; Conover et al., 1981).
Score
The score test, developed independently in the econometrics (Breusch & Pagan, 1979) and statistics (Cook & Weisberg, 1983) literature, can be used to detect various forms of heteroscedasticity. For example, the score test can be used to test whether error variances differ as a function of continuous predictors, categorical predictors, or predicted values. This procedure requires two regression analyses. In the first analysis, the sum of squares error (SSE) from the regression equation of interest is required (see the numerator of Equation A4 in the appendix). Then, in a second regression analysis, the squared residuals from the first analysis are regressed on the variables believed to be the cause of the heteroscedasticity (e.g., the categorical moderator), and the sum of squares regression (SSR) is calculated. The test statistic for the score test, (SSR/2) / (SSE / N)2, is asymptotically distributed as chi-square with degrees of freedom equal to the number of variables used to predict the squared residuals.
Although the score test is not frequently used in the behavioral sciences, this procedure was included in the present study because of its flexibility. In addition, because the components needed for the statistical test are based on two regression equations (i.e., customized syntax or a stand-alone program is not required), this procedure would be generally accessible for a wide variety of users.
O’Brien
Analogous to testing for the main and interactive effects in ANOVA, O’Brien (1979, 1981) developed a procedure that could be used to test for the main and interactive effects of the variances in the cells of one-way and factorial designs. This robust procedure has been recommended even when the normality assumption is violated (Maxwell & Delaney, 2000; O’Brien, 1979, 1981). An especially lucid description of the procedure can be found in Maxwell and Delaney (2000).
Because O’Brien’s (1979, 1981) procedure is limited to designs that have only categorical predictors (e.g., one-way and factorial ANOVAs), it would be useful to generalize this method to designs that include categorical and continuous predictors. Below, we describe how O’Brien’s (1979, 1981) method can be used where hypotheses involving the equality of regression slopes are being tested. Here, we focus on a dichotomous moderator. 3
The modified procedure requires three steps. The first step is to calculate the residuals (eij) from the full model (see Equation 1). Then, for each group, we calculate

The second step involves a transformation of each of the individual residuals. This calculation is achieved using the following equation:

To check the calculations, the average of the
The third step is to conduct a two-independent-samples t test on the transformed residuals from Equation 7, using the categorical moderator (z) (e.g., female vs. male, treatment group vs. control group) as the grouping variable. If the results of this test are statistically significant at some predetermined α, then there is evidence to suggest that between-groups heteroscedasticity exists. 4
In the following sections, we describe the design and results of a Monte Carlo study used to compare the performance (viz., Type I error and statistical power) of the five procedures described above—heuristic method, Bartlett’s (1937) test, Brown and Forsythe’s (1974) test, score test, and modified O-Brien’s (1979, 1981) test.
Method
We used Monte Carlo methods (Robert & Casella, 2004) to evaluate the performance of five procedures that can be used to detect between-groups heteroscedasticity in MMR with a dichotomous moderator. Note that the nominal α for all tests was .05. The manipulated parameters of our 5 × 3 × 8 × 2 × 5 research design resulted in 1,200 conditions. Each of the manipulated parameters is described next.
Manipulated Parameters
Total sample size
Five levels of N were used in the present study. These levels were 60, 120, 180, 240, and 300. The Ns for the present study overlap with those used in previous research on MMR (e.g., Aguinis & Stone-Romero, 1997; DeShon & Alexander, 1996) and bracket the Ns typically encountered in validation studies (Salgado, 1998).
Subgroup sample size
Sample size within groups was systematically manipulated using the following three ratios (n1:n2): (a) 1:1, (b) 1:2, and (c) 1:3. For example, when N = 120, the subgroup sample sizes, based on the three ratios, were (a) n1 = n2 = 60, (b) n1 = 40 and n2 = 80, and (c) n1 = 30 and n2 = 90.
Between-groups heteroscedasticity
Between-groups heterosce-dasticity assumed eight levels, which involved the ratios of the population error variance in each group (
Type of pairing
Depending on whether the larger error variance (
Effect size
In the present study, the MMR effect size (f 2) was also manipulated. Although varying the size of the moderating effect was not the focus of our study, we felt that it was useful to determine whether the moderator effect size influenced the performance of the various procedures to detect between-groups heteroscedasticity. We used the modified effect size by Aguinis, Beaty, Boik, and Pierce (2005). Based on their 30-year review of research involving MMR with a categorical moderator in applied psychology and allied fields, the median effect size was .002.
Thus, in the present study, the levels of the manipulated effect size were .001, .002, .005, .01, and .02. These levels included the median effect size reported by Aguinis et al. (2005). Although Cohen (1988) labeled f 2 = .02 as a small effect, in the review by Aguinis et al., they found that this was the effect size at which studies in applied psychology and management had an average power level of .84 to detect such an effect. Beyond this effect size, the power of the usual MMR test for equality of regression slopes would exceed typical recommended levels for power.
Data Generation
For each condition, data generation and statistical analyses were conducted in R—a free, open source, statistical software package (Culpepper & Aguinis, 2011; R Development Core Team, 2011). For the jth group, nj observations of bivariate normal data with population means of 0 were generated using the mvrnorm function in the MASS library in R. The population variances for x (
We also conducted a series of accuracy checks to ensure that the data we generated conformed to the various parameters that we manipulated. In addition, we checked our data generation algorithm against similar conditions considered by DeShon and Alexander (1996), Dretzke et al. (1982), and Overton (2001).
On each simulated data set, the five procedures (viz., heuristic method; Bartlett’s, 1937, test; Brown and Forsythe’s, 1974, test; the score test; and the modified O’Brien’s, 1979, 1981, test) were used to test whether between-groups heteroscedasticity existed. For each condition, there were 5,000 replications. The proportion of times that the null hypothesis was rejected within a condition was recorded for each procedure.
Results
The performance of the five procedures are compared below in terms of Type I error rate and power. Due to space limitations, we do not present the results of all 1,200 conditions. Because the pattern of results were the same regardless of the size of the moderating effect, we present results when f 2 = .002, the median effect size based on the 30-year review by Aguinis et al. (2005). Note that the complete set of results and R code can be obtained from the first author.
Type I Error
For the conditions in which homoscedasticity existed (i.e.,
Empirical Type I Error Rates as a Function of Sample Size and Subgroup Proportions.

Note. N = total sample size; n1 = sample size in Group 1; n2 = sample size in Group 2; f2 = .002.
Although the heuristic method is not a formal statistical test, but simply a rule-of-thumb, and given that sampling error will affect the estimate of the residual variance in Group 1 and the estimate of the residual variance in Group 2, when N = 60 and subgroup sample sizes are equal, it appears that due to chance alone, 28.64% of the time the heuristic method would signal that between-groups heteroscedasticity exists when it does not. Perhaps not surprisingly, this inflated Type I error rate becomes increasingly worse as the sample size of the subgroups becomes more disproportionate. That is, the effect of sampling error on the estimates of the subgroup residual variance is exacerbated. For example, when N = 60 and n1:n2 = 1:2, the empirical Type I error rate for the heuristic method was .3362 and when n1:n2 = 1:3, the empirical Type I error rate was further inflated to .3714. Notably, the empirical Type I error rates for the other four procedures remained near .05.
Another interesting result regarding the heuristic method is that as N increases its empirical Type I error rate decreases. For example, when N = 120 and subgroup sample sizes were equal, the empirical Type I error rate for the heuristic method was .1184 and when N = 240, the empirical Type I error rate decreased to .0302. This is due to the fact that as N increases, the sampling error associated with estimating the residual variance in each group also decreases. Thus, as N increases, the two estimated variances are much more precise estimates of the population ratio (
Statistical Power
In this section, empirical rejection rates when the homoscedasticity assumption is violated (i.e., heteroscedasticity exists) are presented (see Tables 2-4). Table 2 presents results when subgroup sample sizes are equal (i.e., n1:n2 = 1:1). Table 3 and Table 4 present results when subgroup sample sizes are unequal, n1:n2 = 1:2 and n1:n2 = 1:3, respectively. There were notable differences in the performance of the five procedures in terms of power, which we describe across equal subgroup sample sizes, and both the direct and indirect pairing conditions.
Statistical Power as a Function of Sample Size and Degree of Between-Groups Heteroscedasticity When Subgroup Sample Sizes Are Equal.

Note. N = total sample size;
Statistical Power as a Function of Sample Size, Degree of Between-Groups Heteroscedasticity, and Type of Pairing When Subgroup Proportions (n1:n2) Are 1:2.
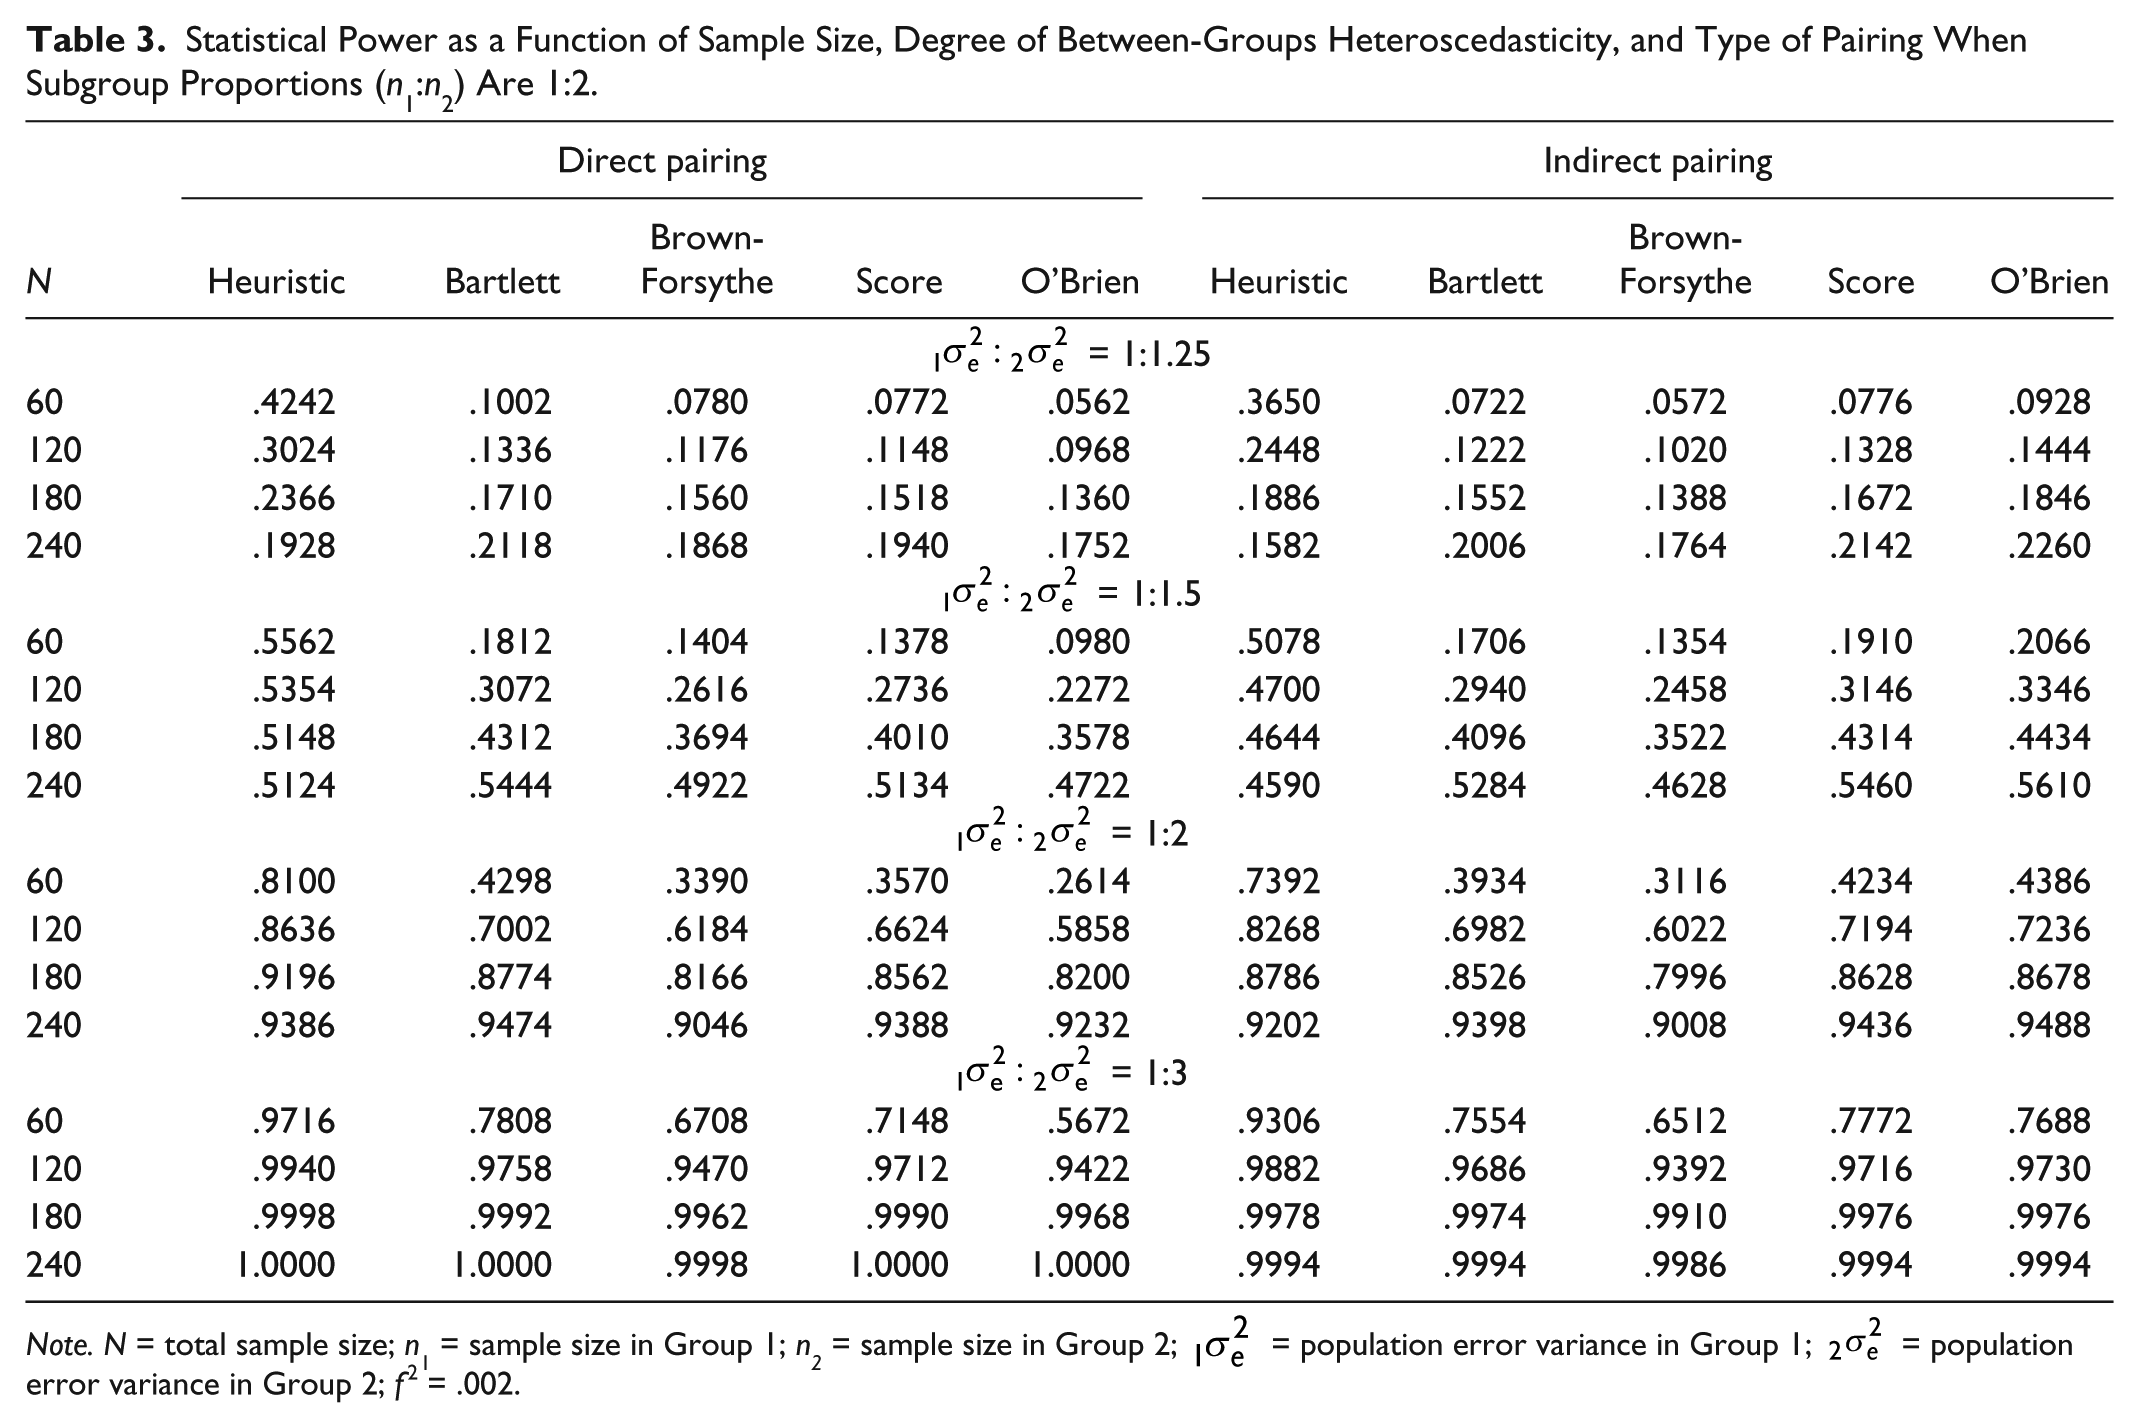
Note. N = total sample size; n1 = sample size in Group 1; n2 = sample size in Group 2;
Statistical Power as a Function of Sample Size, Degree of Between-Groups Heteroscedasticity, and Type of Pairing When Subgroup Proportions (n1:n2) Are 1:3.

Note. N = total sample size; n1 = sample size in Group 1; n2 = sample size in Group 2;
Equal subgroup sample sizes
Recall that when subgroup sample sizes are equal, direct versus indirect pairing does not apply because the pairing of the larger (or the smaller) error variance with the group with the larger (or smaller) sample size is a non-issue because sample sizes are the same. In Table 2, with the exception of the heuristic method, four procedures had power that increased monotonically as N increased and as the degree of between-groups heteroscedasticity increased. Although Bartlett’s (1937) test tended to be the most powerful and Brown and Forsythe’s (1974) test tended to be the least powerful, it appears that when subgroup sample sizes are equal, there is relatively little difference in the power of these four procedures.
For the heuristic method, although it had the greatest power of all five procedures, recall that it had very inflated Type I error rates (see Table 1). Thus, the increased power comes at the cost of inflated Type I error rates. The heuristic method had power that increased monotonically as the degree of between-groups heteroscedasticity increased. For example, in Table 2, assuming N = 120, the heuristic method had power equal to .2480 when between-groups heteroscedasticity (
Interestingly, when the degree of between-groups heteroscedasticity is fixed (e.g., 1:1.25), the power of the heuristic method did not increase monotonically as N increased. Recall that when subgroup sample sizes were equal, N = 60, and homoscedasticity was satisfied, the empirical Type I error rate was .2864 (see Table 1). Then, for a fixed N (e.g., 60), as the degree of between-groups heteroscedasticity increased, power increased (see Table 2). Because at larger Ns, the empirical Type I error rate of the heuristic method was always decreasing (cf. Table 1), power then increases as heteroscedasticity increases albeit at a much lower starting point due to the lower Type I error rate.
Direct pairing
In Table 3, when there was direct pairing, the heuristic method was generally the most powerful of the five procedures when N ≤ 180. Otherwise, the most powerful procedure was Bartlett’s (1937) test followed by the score test, Brown and Forsythe’s (1974) test, and the modified O’Brien (1979, 1981). For these four procedures, power increased monotonically as N increased and as the degree of between-groups heteroscedasticity increased. Consistent with Table 2, at milder levels of direct pairing (
In Table 4, with direct pairing, the trends were similar to Table 3. However, compared with Table 3, because of the increasingly disproportionate subgroup sample sizes in Table 4, power generally decreased. However, the rank order of the various procedures remained the same. Excluding the heuristic method, which was the most powerful due to its inflated Type I error rate, Bartlett’s (1937) test continued to be the most powerful and the modified O’Brien (1979, 1981) was still the least powerful.
Indirect pairing
For all five procedures, power was lower when there was indirect pairing versus direct pairing. Notably, of the four procedures that were able to control Type I error rate at the nominal level (viz., Bartlett’s, 1937, test; Brown and Forsythe’s, 1974, test; the score test; and the modified O’Brien’s, 1979, 1981, test), the rank order of these procedures changed when there was indirect pairing. When there was indirect pairing (see Table 3 and Table 4), the modified O’Brien (1979, 1981) tended to be the most powerful, followed by the score test, Bartlett’s (1937) test, and Brown and Forsythe’s (1974) test.
It deserves noting that the heuristic method had the greatest statistical power of all five procedures because of its inflated Type I error rate. However, as its Type I error rate decreased with increasing N, the heuristic method has power that becomes similar to the other four procedures (see Table 4).
Discussion
Because between-groups heteroscedasticity is a problem in MMR analyses with categorical moderators, the present study compared the performance of various procedures that could be used to detect this statistical violation. As noted above, research has focused primarily on remedial procedures that can be used when between-groups heteroscedasticity exists. However, we felt that it was also important to compare different ways of detecting between-groups heteroscedasticity that have not been previously examined empirically in MMR with a dichotomous moderator (viz., heuristic method; Bartlett’s, 1937, test; Brown and Forsythe’s, 1974, test; score test; and modified O’Brien’s, 1979, 1981, test). By comparing various procedures, we hoped to offer some initial recommendations for researchers and practitioners in the behavioral and social sciences.
A number of key findings can be gleaned from our study. In general, Bartlett’s (1937) test is the most powerful in detecting between-groups heteroscedasticity when sample sizes are equal or when direct pairing occurs, thus providing empirical support for the recommendation offered by DeShon and Alexander (1996). It is noteworthy, however, that when there is indirect pairing (i.e., the largest
The score test performed well across conditions, typically with the second highest power levels. Perhaps due to its origins in econometrics and statistics, it does not appear to be well known in the psychology literature and related fields. However, the score test may still be a very attractive alternative for researchers because of its flexibility to detect heteroscedasticity of various forms, including between-groups heteroscedasticity.
Brown and Forsythe’s (1974) test was the least powerful across conditions. It deserves noting, however, that this procedure was developed to be robust against violations of normality. Because normality was not manipulated in the present study, it is plausible that under conditions of non-normality, in which research has suggested that Bartlett’s (1937) test performs poorly (Box, 1953; Levene, 1960), Brown and Forsythe’s test could potentially outperform Bartlett’s test. Similarly, because O’Brien’s (1979, 1981) method has been found to be robust when the normality assumption is violated, it is possible that, under conditions of non-normality, the modified O’Brien could outperform Bartlett’s test even in the direct pairing conditions.
As N increases and the degree of between-groups heteroscedasticity increases, the differences in power among the five procedures are not substantial. For the conditions considered in the present study, it appears that for Ns ≥ 240, it generally makes little difference which procedure is used, especially if there is a high degree of between-groups heteroscedasticity.
The present study demonstrated that O’Brien’s (1979, 1981) procedure can be extended to designs beyond one-way and factorial ANOVA to include continuous predictors. The modified procedure controlled Type I error at the nominal level and had power levels comparable with, and in some cases greater than, other procedures.
The heuristic method had very poor properties. Admittedly, it is not a statistical test. Thus, it may not be reasonable to expect the heuristic method to be robust. Note that the empirical rejection rates (i.e., Type I error and power) for the heuristic method are unaffected by whether α = .01, .05, or .10. Thus, at any alpha, for the 1,200 conditions considered in the present study, the heuristic method would have the same rejection rates. To counteract its inflated Type I error rate, and interpolating from Table 1, the heuristic method may be recommended for use when k = 2 and N > 200.
Recommendations for Research and Practice
A few recommendations for research and practice can be identified. First, when testing for the equality of regression slopes, it is important that researchers and practitioners evaluate whether the homoscedasticity assumption has been satisfied. Consistent with Rosopa et al. (2013), the residuals from Equation 1 (for the two-group case, specifically) or Equation A1 in the appendix (for two or more groups, more generally) should be calculated. Then, the sample-based variance of these residuals can be calculated separately for each group. Assuming that N > 200, a simple ratio of the largest to the smallest residual variance can be calculated. In addition, direct pairing exists if the largest group has the largest residual variance; alternatively, indirect pairing exists if the largest group has the smallest residual variance. As subgroup sample sizes become increasingly disproportionate, it becomes increasingly important to know whether direct pairing or indirect pairing exists.
Second, based on the results of the present study, Bartlett’s (1937) test is the most powerful for detecting between-groups heteroscedasticity when the normality assumption is satisfied and direct pairing exists. However, when there is indirect pairing, the modified O’Brien’s (1979, 1981) test should be used. Notably, if subgroup sample sizes are approximately equal, it makes little difference which statistical procedure is used because the differences in statistical power are generally small.
Third, if between-groups heteroscedasticity is detected, an alternative procedure should be used instead of ordinary least squares regression. To mitigate the biasing effects of between-groups heteroscedasticity, Rosopa et al. (2013) discussed a number of procedures including weighted least squares regression and heteroscedasticity-consistent covariance matrices.
Conclusion
The present study adds incrementally to the extant literature on statistical procedures that can be used to detect between-groups heteroscedasticity in MMR with categorical moderators. It appears that different procedures may be needed to optimally detect between-groups heteroscedasticity when there is direct pairing (viz., Bartlett’s, 1937, test) versus indirect pairing (viz., modified O’Brien’s, 1979, 1981, test). This is a finding unique to this study. Moreover, because the heuristic method has never been empirically examined, the present simulation results are the first to note that this method has very inflated Type I error rates and it may be best to use this method when N > 200 to counteract the inflated Type I error rates. In addition to comparing the performance of various procedures, we proffered a modification to O’Brien’s (1979, 1981) method, which can be added to the statistical tools used by researchers and practitioners in the behavioral and social sciences.
Footnotes
Appendix
The full linear model for the
where
The best linear unbiased estimator of the parameters in Equation A1 is
Although
where
where SSE = sum of squared errors. Moreover, when
Although
Assuming that
where df1 = the number of terms omitted from the full model and df2 = the error degrees of freedom for the full model. It is worth noting that an equivalent general linear hypothesis test can be conducted using the full model in Equation A3 (see Equation 8.27 in Rencher, 2000). If F > F(1 − α, df1, df2) (where α = Type I error rate), then the null hypothesis of equal regression slopes is rejected; stated differently, z moderates the relation between y and x. Otherwise, the null hypothesis of equal regression slopes cannot be rejected. These procedures are described in greater detail in numerous texts (see Cohen, Cohen, West, & Aiken, 2003; Fox, 2008; Maxwell & Delaney, 2000; Neter, Kutner, Nachtsheim, & Wasserman, 1996). Note that when k = 2, the test of the moderating effect based on the F ratio in Equation A5 is equivalent to a two-tailed t test with df2 = N − 4.
Authors’ Note
Portions of this article were presented at the 75th annual conference of the Psychometric Society in Athens, Georgia, and the 26th annual conference of the Society for Industrial and Organizational Psychology in Chicago, Illinois.
Declaration of Conflicting Interests
The author(s) declared no potential conflicts of interest with respect to the research, authorship, and/or publication of this article.
Funding
The author(s) received no financial support for the research and/or authorship of this article.