
Abstract
The relative fit of one- and two-factor models of the Procrastination Assessment Scale for Students (PASS) was investigated using confirmatory factor analysis on an ethnically diverse sample of 345 participants. The results indicated that although the two-factor model provided better fit to the data than the one-factor model, neither model provided optimal fit. However, a two-factor model which accounted for common item theme pairs used by Solomon and Rothblum in the creation of the scale provided good fit to the data. In addition, a significant difference by ethnicity was also found on the fear of failure subscale of the PASS, with Whites having significantly lower scores than Asian Americans or Latino/as. Implications of the results are discussed and recommendations made for future work with the scale.
Keywords
The Procrastination Assessment Scale for Students (PASS; Solomon & Rothblum, 1984) is a commonly used measure of academic procrastination (Harrington, 2005) that was designed to assess procrastination in two different areas: “frequency of procrastination,” which measures how often students procrastinate on various academic tasks, and “reasons for procrastination,” which assesses a variety of different motives for engaging in procrastination.
In their original work, Solomon and Rothblum (1984) conducted a factor analysis of the reasons for procrastination section of the PASS and retained two factors, which accounted for 67% of the variance. The first factor, “fear of failure,” consists of five items and measures procrastination due to a fear of not meeting one’s own standards or of failing in one’s work, and the second factor, “aversiveness of tasks,” consists of three items and measures procrastination primarily due to the perceived unpleasantness of a task. Although the PASS has been cited as the most commonly used measure of academic procrastination (Ferrari, Johnson, & McCown, 1995; Harrington, 2005), considering its frequent use, relatively little additional factor analytic work has been done on the scale. This work is reviewed below.
Overall, studies that have examined the factor structure of the PASS Reasons for Procrastination scale have provided good support for the “fear of failure” factor and moderate support for the “aversiveness of task” factor. Clark and Hill (1994), in conducting an exploratory factor analysis of the PASS, reported a two-factor solution, with the factors named “aversiveness of task” and “evaluation anxiety,” the latter of which they considered to be very similar to Solomon and Rothblum’s (1984) “fear of failure” factor. Although the individual factor item loadings were not provided, Clark and Hill concluded that the two factors in their solution were conceptually very similar to the two-factor solution reported by Solomon and Rothblum. Harrington (2005) conducted an exploratory factor analysis of the Reasons for Procrastination scale of the PASS and reported a three-factor solution. The first two factors were consistent with Solomon and Rothblum’s “fear of failure” and “aversiveness of task” factors, although the aversiveness of task factor consisted of five items, rather than the three items reported by Solomon and Rothblum (1984). The third factor reported by Harrington was not clearly defined, as it failed to exhibit simple structure, with all but one of the items cross-loading on other factors. In a study conducted on a Turkish sample, Ozer, Demir, and Ferrari (2009) conducted an exploratory factor analysis of the PASS and reported a four-factor solution. Although the first factor approximated the “fear of failure” factor reported by Solomon and Rothblum, the “aversiveness of task” factor did not clearly surface among the remaining factors. Instead, these latter three factors were reported to measure “risk taking,” “laziness,” and “rebellion against control.” In comparing their results with Solomon and Rothblum (1984), the authors speculated that differences in the factor solutions may be due to the cultural differences between the two samples. Finally, Watson (2011) examined the factor structure of the PASS and retained six factors, although neither the method of factor extraction nor the individual factor item loadings were reported. Of the factors extracted, the “fear of failure” and “aversiveness of task” factors accounted for the first and second most variance in the factor solution, respectively.
Although the above-mentioned studies have evaluated the fit of the PASS using exploratory factor analysis, surprisingly, to the best of the authors’ knowledge, the fit of the PASS has not yet been investigated using confirmatory factor analysis (CFA). This is an important limitation, as CFA is an ideal procedure for testing the fit of both theoretical and empirically derived models to the data. Furthermore, very little work has investigated procrastination among ethnically diverse samples (cf. Prohaska, Morrill, Atiles, & Perez, 2000), with most studies consisting predominantly of White students. This is also important, as with the increasing ethnic diversity of the U.S. population, and forecasts for continued growth (Passel, 2011), it is critical that more research be conducted using ethnically diverse samples.
Therefore, the current study advances previous work by providing, to the best of the authors’ knowledge, the first CFA of the PASS Reasons for Procrastination scale. The relative and absolute fit of both one- and two-factor models of the PASS will be investigated using an ethnically diverse sample of students.
Method
Participants
The PASS was administered to a sample of 359 university undergraduates (74% female, M age = 19.20 years, SD = 2.38 years, range = 18-52 years) enrolled in an introductory psychology course at a university in the western United States in the fall 2014 semester. The sample was ethnically diverse, with 49% reporting as Hispanic, 22% Asian American, 21% White, 4% African American, and 3% as “Other,” with 1% failing to report their ethnicity.
Materials
The PASS Reasons for Procrastination scale (Solomon & Rothblum, 1984) asks respondents to recall a time where they procrastinated on a term paper, and then includes items covering a number of potential reasons for having procrastinated on the assignment. The scale was developed using 13 different themes or “reasons” for procrastination, with two items created for each theme. Although the full-length scale contains 26 items, based on the results of a factor analysis, Solomon and Rothblum (1984) interpreted two factors, which consisted of 8 items in total: “fear of failure” (Items 19, 24, 33, 39, and 42) and “aversiveness of task” (Items 27, 34, and 35). Although Solomon and Rothblum did not report reliability estimates for the PASS in their original study, subsequent work (e.g., Alexander & Onwuegbuzie, 2007; Onwuegbuzie & Collins, 2001) has indicated internal consistency reliability estimates of .84 and .85 on the fear of failure subscale and of .74 and .76 on the aversiveness of tasks subscale based on samples of 116 and 135 students, respectively.
Procedure
After providing informed consent, all participants completed the PASS and demographic questions online, receiving credit toward a class research requirement for their participation. Fourteen participants who did not answer all eight questions on the PASS were excluded from the analysis, resulting in a final sample of 345 participants.
Results
The mean, standard deviation, and coefficient alpha for the subscales and total score of the PASS are reported in Table 1. Estimates of internal consistency based on the sample of 345 students were .84 for the fear of failure subscale and .66 for the aversiveness of tasks subscale. Univariate ANOVAs were conducted for gender and ethnicity (Asian American, White, and Hispanic) on each subscale and on the total PASS score. Due to significantly different variances for ethnicity, Welch’s procedure with Games–Howell post hoc tests were conducted, both of which are appropriate with unequal group variances (Howell, 2007). For ethnicity, Whites (n = 75, M = 10.95, SD = 4.40) had significantly lower scores on the fear of failure subscale than both Asian Americans (n = 77, M = 12.88, SD = 4.35) and Latino/as (n = 172, M = 12.49, SD = 5.21), Welch’s F(2, 169.65) = 4.23, p = .016, η2 = .02. No other differences for ethnicity or gender were significant on the “fear of failure,” “aversiveness of task,” or total PASS scores.
Mean, Standard Deviation, and Coefficient Alpha (α) for the Subscale Scores and Total Score of the PASS.
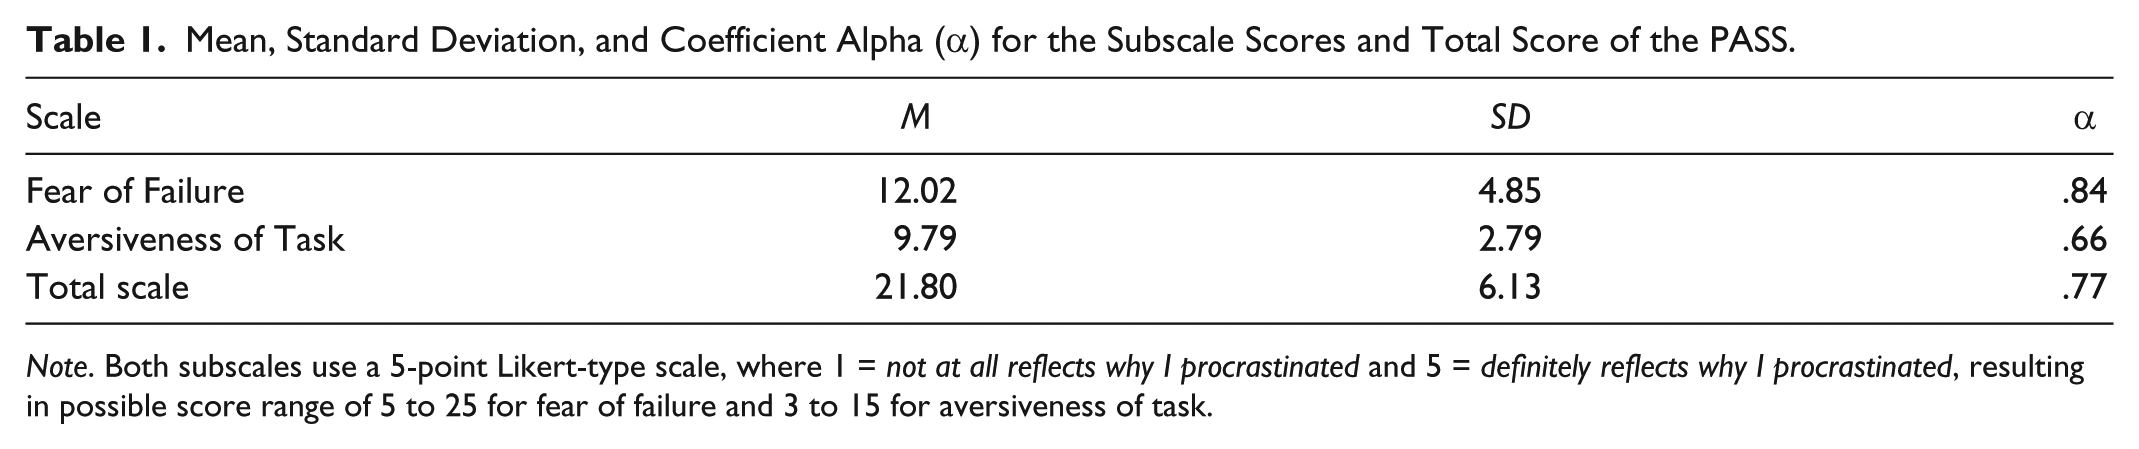
Note. Both subscales use a 5-point Likert-type scale, where 1 = not at all reflects why I procrastinated and 5 = definitely reflects why I procrastinated, resulting in possible score range of 5 to 25 for fear of failure and 3 to 15 for aversiveness of task.
CFAs were run for a one-factor model consisting of all eight items and a model based on the original two-factor factor solution reported by Solomon and Rothblum (1984). Both models were estimated using EQS 6.2 for Windows (Bentler & Wu, 2002). In analyzing the data, Mardia’s test indicated that the data significantly departed from a multivariate normal distribution, with a normalized z estimate of 4.42, where values above 3 typically suggest multivariate nonnormality (Ullman, 2006). Given the presence of multivariate nonnormality in the data, solutions using the Satorra–Bentler scaled chi-square are reported, which is an appropriate adjustment to the maximum likelihood solution when the assumption of multivariate normality or independence has been violated (Hu, Bentler, & Kano, 1992; Ullman, 2006). Consequently, estimates for the models, which are provided in Table 2, are based on the Satorra–Bentler scaled maximum likelihood values.
Fit Statistics for the Independence, One-Factor, Two-Factor Correlated, and Two-Factor Correlated Errors PASS Reasons for Procrastination Scale (N = 345).

Note. All estimates based on Satorra–Bentler scaled maximum likelihood robust solution. PASS = Procrastination Assessment Scale for Students; CFI = comparative fit index; SRMR = standardized root mean square residual; RMSEA = root mean square error of approximation.
∆CFI reflects comparison with adjacent nested model.
A two-factor uncorrelated model was also investigated; it had significantly worse fit that the two-factor correlated model, Satorra–Bentler scaled
p < .05. **p < .001.
For the fit indices reported in Table 2, better fit is indicated by lower
Model Modification
Given the lack of good model fit, modification indices using the Lagrange multiplier test were inspected to examine potential areas of model improvement. The Lagrange multiplier test indicated that the freeing of the following three parameters would result in significant improvement in the model: correlated errors between PASS Items 19 and 24, Items 39 and 42, and Items 27 and 35. That these three pairs of items were identified is understandable, as in creating the PASS (and as was mentioned earlier in this article), Solomon and Rothblum (1984) generated a number of themes of procrastination, and specifically created two items from each of these themes in developing the scale. Of the two factors that make up the PASS (Table 3), six of the eight items share a common theme, with the specific item theme pairs as follows: “evaluation anxiety” (Items 19 and 24), “perfectionism” (Items 39 and 42), and “aversiveness of task” (Items 27 and 35). Therefore, a model was run allowing for correlated errors for each of these pairs of items, resulting in three additional paths estimated in the model. Although freeing a final path was suggested by the modification indices, specifically a cross-loading of Item 33 with the aversiveness of task factor, it was not freed because, unlike the correlated errors between common item themes, there was no theoretical or conceptual justification for allowing the path to estimate (Brown, 2006; Ullman, 2006).
Standardized Factor Loadings for the Items of the PASS Fear of Failure and Aversiveness of Task Subscales—Two-Factor Correlated Errors Solution.

Note. These eight items make up the two factors recommended by Solomon and Rothblum (1984) for the Reasons for Procrastination section of the PASS. Correlation among the two factors = .368. PASS = Procrastination Assessment Scale for Students.
All loadings significant at p < .01.
As is shown in Table 2 for the model labeled “two-factor correlated errors,” allowing the errors to correlate between item theme pairs resulted in good model fit, with all fit indices falling within recommended criteria. The two-factor correlated errors model also fit significantly better than the two-factor model without correlated errors, Satorra–Bentler scaled
Covariance Matrix (Along With Means and Standard Deviations) of the Items on the PASS “Fear of Failure” and “Aversiveness of Tasks” Subscales (N = 345).

Note. PASS = Procrastination Assessment Scale for Students.
Discussion
The results of the present study indicate that although the two-factor model of the PASS provided significantly better fit than the one-factor model, neither model provided optimal fit, with both falling short of recommended criteria. However, when allowing for correlated errors between the three pairs of items, the two-factor model fit the data well. Therefore, when taking into account common item themes, the PASS appears to be well represented overall as a two-dimensional measure of academic procrastination.
Although the model with the correlated errors between common item themes evidenced good fit overall, examining the individual factor loadings, although significant, the factor loading for Item 27 of the “aversiveness of task” factor was relatively low, accounting for only 9% of the item variance. In other work, Ozer et al. (2009), who did not find support for the “aversiveness of task” factor, reported a loading of .52 for this item on a five-item factor, which was named “laziness.” Given that the “aversiveness of task” factor proposed by Solomon and Rothblum (1984) consists of only three items, the relatively low loading for this item in the current study could explain why this three-item factor did not surface consistently in prior factor analytic work. Given these results, if this item continues to have a relatively low loading in future work, then either replacing or rewriting the item is recommended.
Although the primary focus of the current study was evaluating the fit of the PASS using CFA, in testing for mean differences on the PASS subscale scores, the results indicated that Whites had a significantly lower mean fear of failure score on the PASS than Asian Americans and Latino/as. In the only other study to examine the PASS using an ethnically diverse sample, Prohaska et al. (2000) did not find any differences between African Americans, Whites, and Latino/as on the PASS frequency of procrastination scale; however, the PASS Reasons for Procrastination scale was not investigated. Based on prior work with this population, it is expected that a significant proportion of both Asian American (many of whom are Hmong) and Hispanic participants were first-generation college students. Given the unique pressures that may come with being the first college student in one’s family, one possible reason for the difference in fear of failure scores between these groups is that first-generation students may procrastinate more in their studies, not due to an averseness of the task, but rather to a fear of failing in their work by not living up to the expectations of this unique role. This should be explored in future work. In particular, investigating both family educational background and degree of acculturation as possible mediators of the relationship between ethnicity and PASS fear of failure scores is recommended.
Although a particular strength of the current study is that the sample was ethnically diverse, because Latino/as constituted a large proportion of the current sample, evaluating the factor structure of the PASS using CFA on other ethnic groups is recommended. As Solomon and Rothblum’s (1984) scale was originally developed on a sample that was predominantly White (see Clark & Hill, 1994), and as this study is the first to test the fit of the PASS Reasons for Procrastination scale using CFA, with the results indicating good overall fit using an ethnically diverse sample, testing for factorial invariance between Asian Americans, Whites, and Latino/as (as well other ethnic groups) is recommended, given a sufficiently large sample size for each group.
Finally, although the current study provided evidence in support of the structural validity of the PASS using CFA, evaluating the effectiveness of the PASS relative to other measures of procrastination is warranted. Specifically, evaluating the utility of the PASS in predicting outcome variables, such as GPA or exam scores, relative to other measures of procrastination, such as the Tuckman Procrastination Scale (Tuckman, 2001) or the Lay Procrastination Scale (Lay, 1986), is recommended.
In conclusion, when allowing for correlated errors between common item themes, the PASS provided good overall fit to the data on an ethnically diverse sample. Although further factor analytic work is warranted—in particular testing for factorial invariance by ethnicity—the results of the current study suggest that the PASS is generally well represented as a two-dimensional measure of academic procrastination.
Footnotes
Authors’ Note
Portions of this article were presented at the 84th annual meeting of the Rocky Mountain Psychological Association, April 2014, Salt Lake City, Utah.
Declaration of Conflicting Interests
The author(s) declared that no potential conflicts of interest with respect to the research, authorship, and/or publication of this article.
Funding
The author(s) received no financial support for the research and/or authorship of this article.