
Abstract
A large body of research has addressed the benefits of visualization, whereas the analysis of the pitfalls has not received systematic attention. We aim to provide an overview of the common pitfalls and potential disadvantages of visual representations based on a multidisciplinary literature review. Subsequently, we develop a theoretically grounded classification of common cognitive, emotional, and social risks of visualization and populate it with a comprehensive list of visualization pitfalls. The aim of this research is not to diminish the potential of visualization, but rather to improve visual literacy by structuring our understanding of the possible limitations of graphic representations.
Keywords
Introduction: Why Examine the Pitfalls of Visualization?
The rise of visualization’s use on the Web, in social media, in education, and in management calls for a systematic understanding of the limitations of graphic representations and of potential mistakes that are committed when designing or viewing information and knowledge visualizations. Examining the potential risks and common mistakes committed in the interpretation and in the creation of visualization is relevant to enhance scholar understanding of an important aspect of visual literacy. In this article, the word visualization refers to the graphic display of information and knowledge. From a pragmatic point of view, a compilation and classification of pitfalls of visuals can be used as an instructional tool, to provide a comprehensive list, a vocabulary and definition of relevant terms related to the risks of visualization. Practitioners could profit from such a classification by using it as a checklist, against which they can test images and improve document design, infographics, or digital images.
Despite the notable number of publications on the benefits of using visual representations in a variety of fields (Meyer, Höllerer, Jancsary, & Van Leeuwen, 2013), few studies have systematically investigated the possible pitfalls that exist when creating or interpreting visual representations. Some information visualization researchers, however, have raised the issue and called to action: “Articles on limitations and pitfalls [of visualization] are scarce. For the advancement of the field, more such reports would be highly beneficial” (van Vijk, 2006, p. 426). Presently, a clear overview and classification of the risks and disadvantages associated with visual depictions of information has not been provided. Thus, as evaluated by Pauwels (2010), “Due to a lack of integrative efforts, we are in danger of constantly ‘reinventing’ knowledge about the visual and its workings” (in Meyer et al., 2013).
Such a synopsis could provide a comprehensive theoretical overview based on prior research findings, to assist researchers in investigating systematically the effects and the boundaries of visual representations of information (Eppler, 2006; Fong, Valerdi, & Srinivasam, 2007). This article aims to provide an instructive schema that contains prior research findings from a variety of fields related to visualization.
The goal of this article is to identify and classify the key problematic issues and risks inherent in visual representations, as well as to provide a structure to guide work in visualization production and quality assessment. We argue that this is an important step in visualization research to use as a basis for the future development of guidelines and rules for visualization developers and users, and for instructors. To compile a list of risks of visualization, we have screened studies from multiple related research domains. We have focused on the visual representation of information and thus did not analyze areas such as fine arts, photography, film, or scientific imaging.
We structure the article by starting with a review of visualization literature. In the third section, we provide a classification populated with reported disadvantages of visualizations. We then present examples of how to utilize the classification for evaluating and improving graphic representations of information. We end with the conclusions and an outlook for future research.
Our aim with the present work is not to diminish the potential of visualization. It is rather an attempt to deepen and structure our understanding of its possible limitations and constraints. This is relevant not only to avoid or detect mistakes in the production and interpretation of visualization applications, but also as a teaching tool to foster visual literacy.
A Review of Literature
To survey the current state of research on the pitfalls of visualization, we have analyzed 51 articles published in peer-reviewed journals and books in 6 main fields of research related to visual representations: (a) statistical graphic representations, (b) visual literacy and visual communication, (c) information visualization and human–computer interaction (HCI), (d) management studies, and (e) cross-cultural studies related to visualization. These fields have been selected for their coverage of characteristics of visual representations. Although several other fields have addressed the effects of visualization—such as film studies, sociology, architecture, or education—we have consciously chosen to set the boundaries of this classification to those areas that are closely related to the graphical displays of information. In Table 1, we have compiled a list of all the pitfalls of visualization found in the research reviewed in these fields. A brief description of each disadvantage is provided in the Table 2.
A Classification of Visualization Pitfalls.

List of Visual Representation Pitfalls With Brief Explanations.

We witness the earliest and most comprehensive collections of visual representation pitfalls in the area of statistical graphic representations. The main approach in this area has been to showcase particularly bad examples of visualized statistical information and to learn from them. This has been elegantly demonstrated in Edward Tufte’s (1986, 1990, 1997, 2007) popular books in which he highlights numerous ways in which visualization falls short of its potential. In his works, he uses several anecdotal examples of graphics that fail to tell the truth. He goes on to explain why and how they fail, for example, by measuring their “lie factor” (given by the size of the effect shown in the graph divided by the size of the actual effect found in the data). Similarly, Wainer points out 10 typical pitfalls in visualizing information in his article, “How to display data badly” (Wainer, 1984). His ironic counter-recommendations are as follows: (a) Minimize the data density, (b) minimize the data–ink ratio, (c) ignore the visual metaphor altogether, (d) only order matters, (e) graph data out of context, (f) change scale in mid-axis, (g) ignore the important, (h) jiggle the baseline, (i) Austria first! (ordering graph items alphabetically), and (j) label illegibly, incompletely, incorrectly, and ambiguously. Other similar publications in the field, as the popular book, “How to Lie with Statistics” (Huff, 1993), emphasize how information visualization can be used to mislead.
In the fields of Visual Literacy and Visual Communication, authors have discussed the heterogeneous interpretation of visual material due to differing prior experience (Avgerinou & Pettersson, 2011; Dwyer, 1972), including the knowledge of visual conventions (Avgerinou, 2007), and different cultural backgrounds (Avgerinou, 2007; Forsythe, 2011). At the same time, Knox’s (2007) study has shown emerging conventions in visual design, whereas Machin and Van Leeuwen (2007) have discussed the increasing institutionalization of visual cues in global media (in Meyer et al., 2013).
In the rich and rapidly evolving domain of Information Visualization, we can find a broad discussion on the properties of graphic representations and their positive use, but fewer considerations of their potential drawbacks. In particular, Ware (2004) identifies the underlying mechanisms of information visualization perception and brings to light potential issues of visualization use, including change blindness, wrong salience, wrong use of color, visual stress, cultural differences, and breaking conventions. Conversely, psychologist Kosslyn (2006) focuses on specific formats of graphic design (e.g., pie charts, bar and line graphs) and discusses graphic representation dangers such as defocus (distraction) and over-complexity. Van Vijk’s (2006) “Views on Visualization” is one of the few articles that explicitly considers “consequences and limitations of visualization.” He finds that visualization can have high initial cost to be understood (when new techniques are developed), is at times subjective, and can be wrong and misleading. Cawthon and Vande Moere (2007) studied the aesthetics of data visualization and found that information visualizations may trigger unwanted emotions or distractions. Few (2006) has extensively addressed the pitfalls of graphic dashboards used in organizations, addressing issues such as wrong use of color, low accuracy, useless decoration, and so on. Also in the specific area of visual analytics (Thomas & Cook, 2005) and collaborative visual analytics (Heer & Agrawala, 2008), the positive and negative mechanisms underlying the effectiveness of visualizations are examined. In the subdomain of Visual Languages, researchers have examined disadvantages of diagrams and of notations, as for example, unevenness (Blackwell et al., 2001; Green & Petre, 1996) or over-reliability appearance (Crilly, Blackwell, & Clarkson, 2006). In the study of diagrams, authors have discussed the limitations and possible restrictions of a specific format, for example, in the seminal study by Larkin and Simon (1987) and in the study on visualization over-determinism by (Shimoijma, 1996). In the related field of HCI, a few authors have considered the potential drawbacks of interactive visualizations, but only in the context of user interfaces—and how they inform or confuse users (Shneiderman, 1998).
The recent stream of management focusing on boundary objects and sociomaterial practices explores the potential (and to a much lesser extent, the risks) of using visualization in organizations (Buergi & Roos, 2003; Eppler, 2004; Eppler & Burkhard, 2005; Eppler, Mengis, & Bresciani, 2008; Henderson, 1995; Lurie & Mason, 2007; Meyer et al., 2013, Al-Kassab, Ouertani, Schiuma, & Neely, 2014; Roos, Bart, & Statler, 2004). These studies typically highlight visualization advantages through case evidence. A subset of management studies analyzes specifically the positive and negative effects of visualization for collaboration (Ewenstein & Whyte, 2007; Fong et al., 2007; Mengis, 2007; Nicolini, 2007; Oliver, 2007; Tversky, 2005; Whyte, Ewenstein, Hales, & Tidd, 2007), also in computer-mediated settings (DeSanctis & Gallupe, 1987). For instance, the political use of images in collaborative setting may provide unequal possibilities to contribute to the discussion (Henderson, 1995; Nicolini, 2007; Whyte et al., 2007), or it may affect the typical behavior of the discussants (Nicolini, 2007) who might pay more attention to the visual rather than to the facial expressions of the group participants.
Cross-cultural studies have also addressed the differing interpretation of visual representations caused by cultural variations: Already in 1966, Segall, Campbell, and Herskovits (1966) have described the influence of culture on visual perception. Nisbett (2003) and Nisbett and Miyamoto (2005) have shown through eye-tracking studies how Westerners and East Asians look at images differently, with Westerners focusing on the main central objects and East Asians paying attention also to the background. Chan, Li, Diehl, and Terlutter (2007) have described cross-cultural variations in consumers’ response to emotional images. A comprehensive review of cultural factors influencing the reception of visual representations of information has recently been published (Bresciani, 2014), which include, among others, the different meaning of colors and symbols across cultures, the appropriate use of visual humor in diverse cultural setting, and reading direction (right to left for Arabic and some Asian languages).
In total, we have identified more than 50 articles and books that discuss the potential pitfalls of graphic representations of information and knowledge. We have consciously not considered disadvantages related to the mere functionalities of specific visualization environments or software packages, instead concentrating our compilation of disadvantages on a higher level of granularity (e.g., more conceptual shortcomings). From this literature review, a number of concepts have emerged (see Table 1 for the complete list), with differing levels of abstraction and scope. In the next section, we cluster the results in a 3 × 2 classification.
Proposed Classification of Visualization Pitfalls
In this section, we propose a classification of visualization errors or disadvantages to structure the many factors that can make a graphic representation dysfunctional, and we populate it with the pitfalls that we have found in the literature. A classification of the large quantity of concepts that we have collected is necessary to structure them in an efficient and relevant way, as well as to make them usable and accessible.
The classification that we propose, shown in the following table (Table 1), is a matrix based on two causes of pitfalls, the designer or the user, and three types of (negative) effects: (a) cognitive, (b) emotional, and (c) social (Buergi & Roos, 2003). The concepts we have collected from the literature are classified and referenced in the six resulting cells. A short definition of each concept can be found in Table 2.
More specifically, the cause of a visualization problem can be twofold: the encoding (that is, caused by the designer/developer) or the decoding (that is, caused by the reader/user; Avgerinou, 2007). In the latter case, the person who reads the image makes a mistake in the interpretation (Tufte, 1986). The designer can intentionally or unintentionally introduce mistakes or drawbacks in a visual representation. Today’s interactive technologies have substantially contributed to empowering everyone to become a designer and swiftly create visual representations: The classification is thus useful especially for non-professional creators of visual representation who might not be familiar with design principles. These digital technologies, especially when utilized in social media platforms, allow users to both consume and create visual representations: Nevertheless, the classification is still valuable because a person can be either the user or the creator of a specific visual representation at a given time (although on a platform, a person can be both a user and a developer but of different visuals). The distinction between producer and user becomes even more meaningful when images are shared on social media (Neher, 2013) because different meaning can be attributed to the same visual by different users: It is thus important to find the origin of the potential problems (that is, the visual or the viewer). The distinction between designer and user-induced mistakes is particularly valuable in pragmatic terms, as it can give immediate insights for the producers and for the evaluators of visualizations, respectively. Visualization designers should look at the encoding section of the schema in Table 1, while users should pay attention to the pitfalls in the decoding section (or column) of the schema.
Conversely, the distinction between intentional and manipulative (Huff, 1993; Tufte, 1986; Wainer, 1984) or unintentional pitfall is at times difficult to classify, as it is not always possible to discern intentionality by merely observing a visualization. Thus, intentionality cannot be used for classification purposes, as it is often impossible to determine whether a designer or author has made a genuine mistake, or whether he or she intended to mislead.
Considering the second criterion of the classification, the effect of visualization drawbacks, we adopt the threefold distinction of cognitive, emotional, and social effects (Buergi & Roos, 2003; Kernbach, Bresciani, & Eppler, 2015; Roos et al., 2004). Similar categorizations include Norman’s classification of the design field (Norman, 2004): He distinguishes the visceral level (corresponding to emotions), the behavioral level (corresponding to usability), and the reflective level (regarding the meaning of things, or the self-image). This classification is also consistent with social interdependency theory, developed in the educational context, which distinguishes cognitive, behavioral, and social dimensions (Johnson & Johnson, 2005). Our proposed classification includes the often neglected “social” effects of visualization following the emerging trend on collaborative information visualization (Bresciani, Blackwell, & Eppler, 2008; Keel, 2007) in which visuals are considered supports for collaborative sense-making and understanding. Along the same line of thought, Heer and Agrawala (2008) state that although most research to date assumes a single-user focus on perceptual and cognitive processes, in practice, sensemaking is often a social process involving parallelization of effort, discussion, and consensus building. Thus, to fully support sensemaking, interactive visualization should also support social interaction. (p. 49)
We can observe that in Table 1, the list of cognitive disadvantages is the most extensive section. Most of the studies have focused on the cognitive effects of visualization, neglecting its social or emotional consequences. In the context of visualizing organizational strategy, Roos et al. (2004) also confirmed this impression: “While social and emotional modes of experience are involved in strategy process, in general they are suppressed in favour of cognitive elements” (p. 551). The emotional category is referring to the most visceral impact of visualization on the user’s feelings, whereas the social category includes disadvantages caused by the collaborative use of visualizations.
The categorization presented has implications for practice, as it can support visualization users and producers to prevent, reduce, or eliminate visualization threats. In this sense, it can be used as a negative checklist. Designers as well as researchers are supported by having a comprehensive view of the most common cognitive problems as well as the often overlooked social and emotional issues that may exist when using graphic representations of information. Visualization users can utilize the table as an instrument to control or reflect on their own potential biases as well as a designer’s quality of work.
We do not claim that all the elements identified in the table are always problematic. There may be instances where one or several of the listed issues are productively used on purpose. Visual ambiguity, for example, may lead to the creative re-interpretation of a graphic representation and thus lead to new insights (Eppler et al., 2008). Another example of a visualization risk that may provide a benefit is the shocking or disturbing effect of a graphic or an emotionally exaggerated visualization that, as a benefit, would be remembered for a long time (e.g., Figure 3). Furthermore, a high level of complexity should not be considered negative in absolute sense; rather, it depends on the familiarity and training of the target audience. Table 2 provides a brief description of each of the visualization pitfalls, based on the literature.
In the next section, we provide examples of the application of the classification for the evaluation of visualizations.
Examples
The aforementioned classification can be used as a reference point for evaluating and improving visualizations. To simplify this task for practitioners, the classified list of pitfalls is provided also in the pragmatic format of “Questions to Ask” in the appendix, which can be used as a checklist by visualization producers and users.
It is worth noticing that we do not expect to find issues with all the characteristics listed in the classification when looking at specific examples, but rather only with a few of them for each analyzed image. We will provide two examples of visual representations that present problems, and we will analyze the first from the point of view of the designer (an encoding problem), and the second from the point of view of the user (a decoding problem), following the cause-related criteria proposed in the classification.
We start by analyzing Figure 1, reported and discussed by Wainer (1984) and representing U.S. imports and exports, taking the point of view of a designer who receives the task of reviewing and improving the visual. We conduct an analytical evaluation of visualization problems based on the classification (with each identified disadvantage reported witin quotes), and we use the evaluation as a guideline to describe the solutions to counteract the negative effects.

U.S. trade with China and Taiwan.
For this task, we need to consider the “encoding” section of the classification, as we want to identify issues induced by the designer (the left column of Table 1). The classification can simply be used by considering the list of pitfalls, one by one, against the visual representation to be analyzed. In the proposed example (Figure 1), we find issues with “breaking conventions” (which is the second listed issue in the classification of pitfalls, based on Ware, 2004): Both the axes vary between the two graphs. Specifically, the y-axis is doubled in value in the graph on the right-hand side (US$3.000 million compared with US$6.000 million): The reader would expect the same scales on both graphs for comparison purposes. Continuing with comparing the list of negatives with the image, we see that there is “inconsistency” (Cawthon & Vande Moere, 2007; Tufte, 1986): In fact, the colors indicating the imports and exports are inconsistent between the right-hand side and left-hand side graph. In particular, in the graph about China trades, the imports are depicted in black and the exports in white, whereas in the graph on Taiwan trades (on the right-hand side), the meaning of the color is reversed. Next, we find a problem with “misleading/distorting” information (Tufte, 1986; van Vijk, 2006; Wainer, 1984) because the colors used to represent trade to and from the United States are inverted within the same graph without any reason, thus misleading the reader. Proceeding with the list, we can identify a “redundancy” (Few, 2006; Tufte, 1986) in the visual representation, as the data refer to the same quantities (time and millions of dollars): Higher efficiency could be achieved by depicting all the data on one single graph (to optimize the so called “data-ink ratio” proposed by Tufte, 1986). In this specific image, we do not identify issues related to emotional or social effects.
Given the specific disadvantages of this visualization identified through the schema, we can propose solutions to improve it. As a first step, the axes should follow the convention of having the same scale on both graphs. Similarly, the import and exports should be depicted with consistent colors across the graphs. To facilitate the comparison of the information provided, we can avoid the redundancy of having two graphs and draw all the data on one single chart. An improved representation, based on the identified problems, is shown in Figure 2. We now have a completely different insight regarding the meaning of the data. First, we swiftly notice that there is greater trade exchange occurring with Taiwan than with China. Second, the dotted lines depict exports, whereas the continuous lines represent imports; we can see that the U.S. level of exports to China is greater than the imports. The reverse is true for Taiwan, from which the United States imports more than it exports. These visual insights were not available with the original version of the image. The classification has thus helped in systematically identifying issues with the visual representation, which can then be addressed and solved.

Improved version of Figure 1.
We now take the point of view of the user to explain the “decoding” section of the classification: We act as a common reader of a visual representation found in a magazine or on the Internet. We show how to read a visualization critically using the proposed classification to be aware of pitfalls induced by our reading of the image. As exemplary illustration, we consider Figure 3, which represents civilian war casualties of the 20th century by country (Understandingusa, 2007).

Twentieth-century civilian war casualties by country.
Although there might be issues with the visualization induced by the designer, in this paragraph, we focus on differences in interpretation caused by the viewer. To do so, we utilize the right-hand side column of the classification (Table 1), which refers to decoding issues, and consider the visualization pitfalls one by one. We do not identify issues with change blindness or channel thinking, whereas we do recognize that interpretation of this visual is based on “perceptual skills” (Nisbett, 2003; Tufte, 1986; van Vijk, 2006) and “prior knowledge and experience” (Avgerinou & Pettersson, 2011; Chen, 2005): Some participants interpret the concentric circles as an indication of the quantity of civilian casualties by country, assuming that the larger the circle is, the higher the number of deaths. However, if we read the image carefully, we can see that the opposite is the case: In the innermost circle (which is the smallest) are positioned countries that had more than 1,000,000 casualties, whereas in the outermost circle, we find countries that witnessed less than 5,000 deaths. This is the case because the visual is developed on the metaphor of the shooting target; thus, more points are scored when hitting the center. However, users not familiar with shooting sports might find it difficult to detect and understand the intended metaphor.
Second, we find an issue also with the emotional user-induced effect of “personal likes and dislikes” (Tversky, 2005). In fact, different people may react differently to this type of graphic representation depending on their gender and sensitivity: The target superimposed on the image of a family is a very strong choice.
Finally, the social user-induced issue of “cultural and cross-cultural differences” (Avgerinou & Pettersson, 2011; Bresciani, 2014; Ewenstein & Whyte, 2007; Forsythe, 2011; Henderson, 1995; Nisbett, 2005; Segall et al., 1966; Ware, 2004) plays a role in the interpretation of this visualization, as some cultures are less inclined to crude representations, whereas others regularly use shocking visualizations to attract the attention of readers (Chan et al., 2007).
Through the above examples, we aimed to show how the classification of visual representations pitfalls can be used to systematically analyze visual representations with regard to their potential drawbacks.
Discussion/Theoretical Implications
Motivated by van Vijk’s (2006) call to action to develop articles on the limitations and pitfalls of visualization for the advancement of the field, and by the acknowledgment by the academic community of the unprecedented rise in the use of visuals (Meyer et al., 2013), we have provided a classification of visualizations pitfalls. This contribution adds to theory by aggregating the currently scattered knowledge on the pitfalls of visual representation of information and can be valuable for researchers in a number of domains from visual literacy and graphic design to information visualization and management. In particular, this work connects the different domain of visualization around the central topic of visualization negative effects.
The errors made while creating or perceiving visualizations are not only aggregated and listed but also classified into cognitive, emotional, and social negative effects: This classification can thus act as a basis for the further systematic investigation of visualizations’ effects by providing a structure to guide work in visualization quality assessment.
It is also relevant to differentiate theoretically between mistakes induced by the designer and the reader: It seems particularly interesting to consider the mistakes in reading or decoding visuals made by users to understand the boundaries of visual representations’ effectiveness.
The classification can be useful also for scholars in a variety of related disciplines including marketing, advertising, film studies, photography, multimodal communication, and journalism, among others.
Conclusion and Outlook
In this article, we have aimed to provide a first classification of visualization pitfalls. We believe that an analytic and comprehensive compilation of visualization pitfalls is crucial, especially in the modern day context of the rising use of visualization by non-experts, and because of the emergent use of visualization in social media, the availability of new graphic technologies, and new ways of generating and sharing pictures. We have introduced a new classification of visualization problems that can be used by visualization producers (e.g., designers, analysts, software companies, statisticians, consultancy companies, researchers, etc.) and in education for increasing students’ visual literacy, for both the production and the critical interpretation of visualizations (Eppler, 2006).
The limitations of our work include the lack of scientific testing for its comprehensiveness and usability. The next step in this research is the testing of the schema, for instance, through field experiments, comparing the performances of designers and users in two conditions: participants who use and participants who do not use the classification. We foresee that the current form of the classification can be subject to ongoing revisions and additions. Furthermore, it would be theoretically and pragmatically relevant to rank the pitfalls according to how common or how severe they are: Scholars could survey a sample of images to determine the occurrence and severity of the pitfalls here identified. Many challenges remain regarding the appropriate level of granularity of the disadvantages, as well as how this can be taken into consideration without excessively increasing the complexity of the classification. Nevertheless, we believe that our categorization is a first step toward a comprehensive formalization of visualization risks, and that such work is needed to support the information design, information visualization, and visual communication community in developing valuable visualizations, and for the analytic assessment and measurement of visualization quality. As Edward Tufte (1986, 1990, 1997) has shown in his books, the world is filled with misleading, unattractive, and confusing visualizations of information. Strategies to avoid these pitfalls have not yet been comprehensively defined, and we hope that our first and provisional classification is an initial step toward a more complete and instructive analysis of the pitfalls of visualization.
Footnotes
Appendix
A Pragmatic Guide of Questions to Ask Regarding Visual Representation Pitfalls
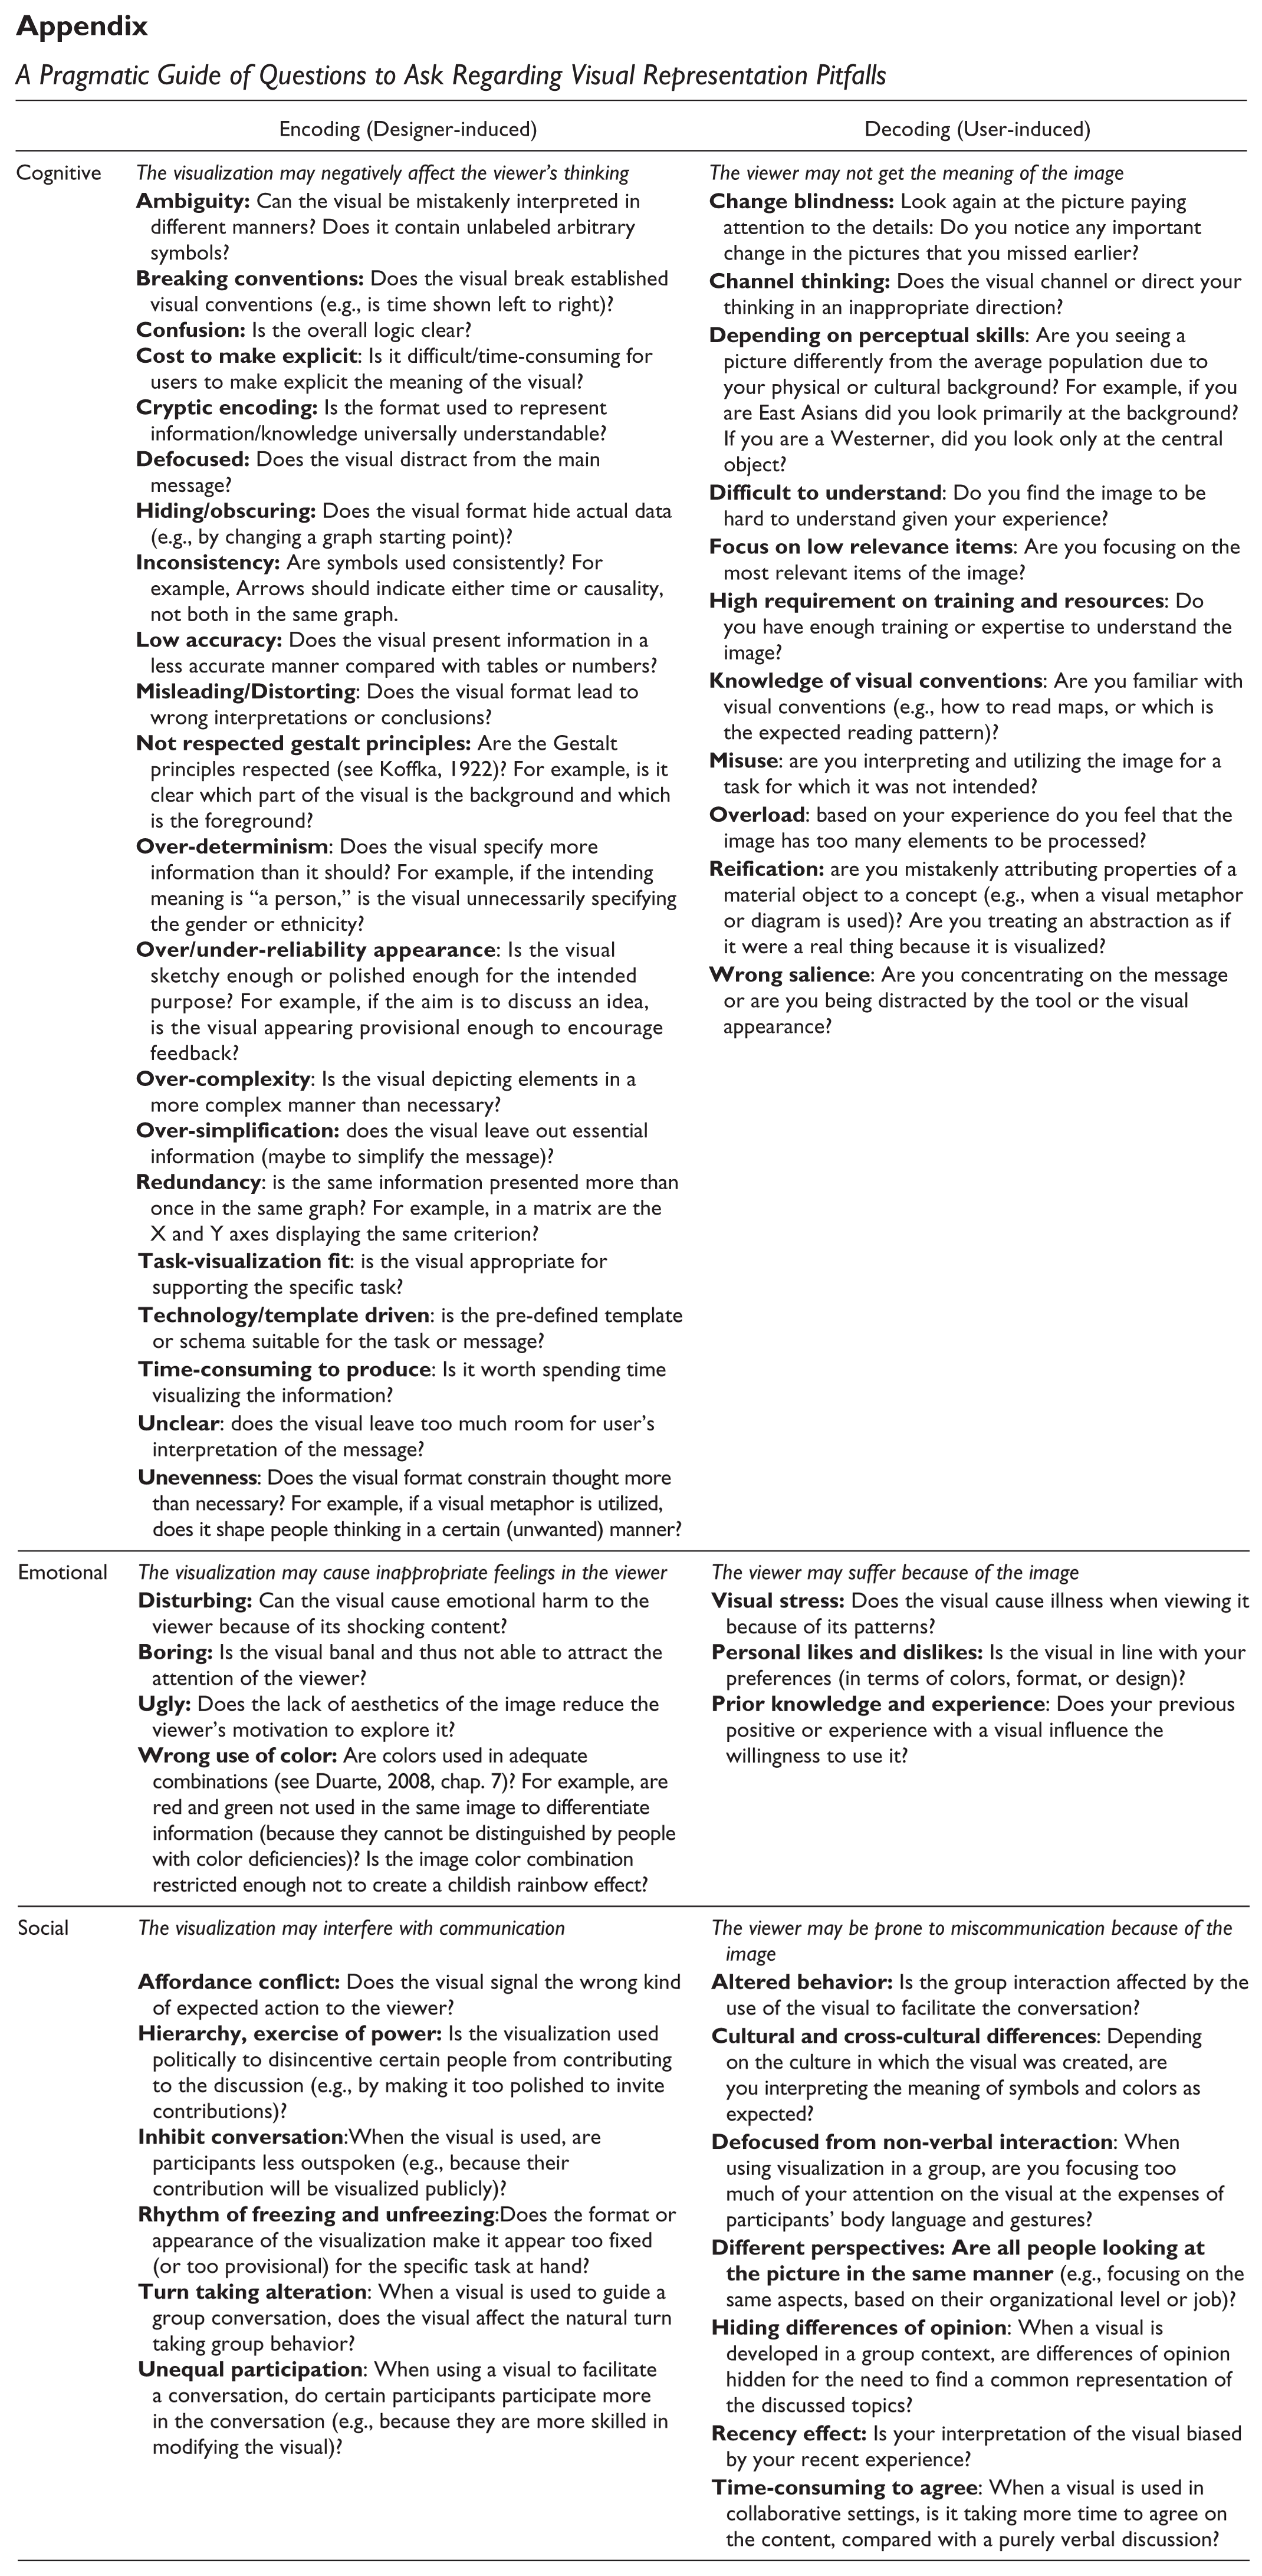
| Encoding (Designer-induced) | Decoding (User-induced) | |
|---|---|---|
| Cognitive | The visualization may negatively affect the viewer’s thinking | The viewer may not get the meaning of the image |
| Emotional | The visualization may cause inappropriate feelings in the viewer | The viewer may suffer because of the image |
| Social | The visualization may interfere with communication | The viewer may be prone to miscommunication because of the image |
Declaration of Conflicting Interests
The author(s) declared no potential conflicts of interest with respect to the research, authorship, and/or publication of this article.
Funding
The author(s) received no financial support for the research and/or authorship of this article.