
Abstract
This study compares rural educational disadvantage across Australia, Canada, and New Zealand using data from the Organisation for Economic Co-operation and Development’s Programme for International Student Assessment (PISA). Across the three countries, student reading literacy and school learning environments are less positive in rural communities than in urban. Furthermore, rural disadvantage in educational outcomes (reading) and opportunities is greater in Australia than Canada or New Zealand. This could be seen as surprising as student socioeconomic status (SES), typically a strong predictor of educational outcomes, is similar for rural communities in Australia and Canada, but lower in New Zealand. Rural school principals in Australia are most likely among the three countries to report that shortages of teaching personnel hinder learning. This could suggest that policies and structures can play a role in ameliorating or exacerbating rural educational disadvantage. We conclude with questions and recommendations for future research.
Introduction
International large-scale assessments and comparative studies are useful for examining cross-national variations in educational outcomes and experiences. More generally, they are useful for broadening perspectives and generating theory about the contexts and conditions that mediate educational phenomena. As such, they are useful for illuminating new lines of thinking that can inform both policy and practice. As described by a founding member of the International Association for the Evaluation of Educational Achievement (IEA), established in 1958 by the United Nations Educational, Scientific and Cultural Organization (UNESCO), “If custom and law define what is educationally allowable within a nation, the educational systems beyond one’s national boundaries suggest what is educationally possible” (Foshay, 1962, p. 5). In this spirit, the current study examines education systems in three countries to gain a better understanding of long-standing disparities in outcomes between rural and urban school communities.
Rural educational disadvantage exists in many countries. It includes inequalities in educational outcomes, such as test scores and high school graduation rates, as well as inequalities related to educational opportunities and experiences in schools. Data from the Programme for International Student Assessment (PISA) have shown that among economically developed countries, the academic performance of 15-year-old students in cities with 100,000 or more residents is, on average, about one-half year of schooling greater than their peers in smaller towns and communities (Organisation for Economic Co-operation and Development [OECD], 2013). Analysis of individual countries has shown, however, that urban/rural achievement differences do not exist in almost half of the developed countries that participate in PISA. This suggests the possibility that national education policies and school practices may play a role in ameliorating or exacerbating rural disadvantage.
Nearly 2 decades ago in Australia, the Human Rights and Equal Opportunity Commission (2000) found that rural schooling was inferior on every indicator included in its study. Indeed, among developed countries, Australia has one of the largest urban/rural achievement gaps in PISA (OECD, 2013), and students in rural Australia have long been identified as educationally disadvantaged (De Bortoli & Thomson, 2010; Lokan, Greenwood, & Cresswell, 2001). Students in rural communities in Australia are less likely than their urban peers to complete secondary education (Alston & Kent, 2006) or attend university (James, 2001).
Although some studies from the United States (Reeves, 2011) and Australia (Cresswell & Underwood, 2004; Young, 1998) suggest that rural disadvantage in educational achievement is strongly associated with student socioeconomic status (SES), cross-national research from the OECD (2013) found that rural/urban achievement differences are not fully explained by student SES, and that school characteristics can account for some of the rural/urban differences in academic achievement. Mapping how schools differ across rural/urban settings can, therefore, provide insight about ways to ameliorate rural disadvantage and reduce inequalities in educational opportunities, experiences, and outcomes. Academic achievement is important, but so are experiences in school. Regardless of the degree to which school and classroom experiences are associated with student learning, all students should have the opportunity to enjoy safe classroom environments and positive relations with their teachers.
This article builds on previous research by K. Sullivan, Perry, and McConney (2013, 2014) that describes how schools differ across rural/urban communities in Australia. These studies found that students in urban Australian communities tend to have substantially higher achievement on PISA than their peers in rural settings, and that the achievement advantage is associated with inequitable distributions of school resources and teachers, and, to a lesser extent, unevenness in school learning environments.
In the current study, we compare rural disadvantage in educational outcomes and resources across three countries, namely, Australia, Canada, and New Zealand. We purposively chose these three countries because they share broadly similar systems of comprehensive secondary schooling, and similar sociocultural histories of English colonization and postcolonial development. Furthermore, the three share similar levels of economic development (all are considered highly developed), and all are among the top 15 countries on the United Nations Development Programme (UNDP) 2016 Human Development Report’s (released in March 2017) list of countries with very high human development (Australia is ranked second, Canada is tied 10th, and New Zealand is 13th). All three are members of the Five Eyes (FVEY), a multilateral intelligence alliance between Australia, Canada, New Zealand, the United Kingdom, and the United States that grew out of common security interests and values.
Our aim is to meaningfully contribute to the development of knowledge and understanding of the nature and extent of rural educational disadvantage and possible solutions for remedying it. Although cross-national comparisons of rural educational disadvantage are somewhat rare, they nevertheless offer a potential to deepen our understanding of conditions and contexts that underlie it. Our research questions include:
To what extent does student academic performance differ across rural/urban locations within and between the three countries?
To what extent do school resources and learning environments differ across rural/urban locations within and between the three countries?
Are rural inequalities of educational outcomes, experiences, and opportunities greater in one country than another, and if so, what are some possible reasons why?
Context
Rural educational disadvantage exists in many economically developed countries, including Australia, Canada, and New Zealand. High school completion rates, for example, are lower in rural areas than urban areas in Australia (Alston & Kent, 2006; Marks, Fleming, Long, & McMillan, 2000) and Canada (Bowlby, 2005). Academic performance as measured by PISA is lower in rural and regional areas than in larger cities in all three countries (OECD, 2013). The reasons underlying these inequalities of outcomes are likely multiple and varied across contexts.
As previously noted, SES is one of the strongest and most stable predictors of academic performance (OECD, 2010; Reardon, 2011; Sirin, 2005). Student SES is positively associated with educational resources, experiences, and opportunities, both at home and at school, and these in turn are related to academic achievement (Bourdieu & Passeron, 1990). For example, students with higher SES backgrounds typically have more books, computers, and other educational materials in their homes than do peers with lower SES (Orr, 2003). They are also more likely to have parents who read to/with them regularly (Coley, 2002) and to enjoy a stimulating learning environment at home (Nash & Harker, 2006; Yeung, Linver, & Brooks-Gunn, 2002). Educational advantage related to SES also manifests in schools. Students with higher SES backgrounds are more likely than their peers with lower SES to attend well-resourced schools (Chiu & Khoo, 2005; OECD, 2005; Vignoles, Levacic, Walker, Machin, & Reynolds, 2000) and more likely to have experienced and qualified teachers (Akiba, LeTendre, & Scribner, 2007; Hanushek & Rivkin, 2006) with high expectations (Rumberger & Palardy, 2005). Higher SES students also experience more time spent on instruction (Camburn & Han, 2011), and are more likely to have access to a rigorous academic curriculum (Lamb, Hogan, & Johnson, 2001; Oakes, 2000).
SES is also the strongest predictor of rural educational disadvantage in many countries (Williams, 2005). On average, rural students have lower SES than their urban peers, and this is associated with the latter typically having higher academic outcomes. It is not clear, however, whether SES is associated with poorer outcomes because of rural/urban differences in student and family characteristics, rural/urban differences in schools, or a combination of these factors. It is difficult to disentangle these variables. It seems most likely that SES status is associated with academic achievement via both family/home and school factors.
PISA includes several school variables that are demonstrably related to students’ educational outcomes. School resources, for example, including educational resources and instructional materials as well as qualified and experienced teachers, are associated with student learning and achievement (Chiu & Khoo, 2005; Haycock, 2001; Wenglinsky, 2002). Positive, supportive, and caring relationships between teachers and students have been shown to improve students’ outcomes because they increase motivation and engagement with learning (Aultman, Williams-Johnson, & Schutz, 2009; McHugh, Horner, Colditz, & Wallace, 2013; National Research Council, 2003; Newberry, 2010; Spilt, Hughes, Wu, & Kwok, 2012). Disciplinary climate is also a strong predictor of student outcomes (Schleicher, 2009). Classrooms that have fewer distractions promote more opportunities for teaching and learning (Frempong, Ma, & Mensah, 2012; OECD, 2005; Shin, Lee, & Kim, 2009). Moreover, high-quality instructional practices can promote positive student outcomes (Akiba et al., 2007; Hanushek, 2007; Hogrebe & Tate, 2010; Winheller, Hattie, & Brown, 2013).
As noted earlier, Australia, Canada, and New Zealand were purposively chosen as the comparator countries for this analysis. The three countries share many historical and sociocultural experiences and values. All three enjoy highly developed economies tied to primary resources (agriculture and natural resources). Nevertheless, we also acknowledge that the similarities among the three countries are far from perfect. In physical geography, the distances between rural, remote, and urban settings are clearly much larger in Australia and Canada than in New Zealand. In addition, and importantly, the proportion of indigenous First Nations peoples in the population are notably different—14% for New Zealand compared with 4% for Canada and 2.5% for Australia. Also, New Zealand’s GDP is substantially smaller than Australia’s or Canada’s but New Zealand nevertheless boasts the highest public spending on education as a proportion of its GDP (7.4% compared with 5.6% for Australia and 5.4% for Canada).
Method
To answer our research questions, we conducted secondary analysis of the OECD’s PISA 2009 data for Australia, Canada, and New Zealand. Starting in 2000, the OECD has administered PISA every 3 years. Each cycle assesses 15-year-old students’ literacies in reading, mathematics, and science. We intentionally chose the 2009 dataset for two reasons. First, we had used the 2009 data in our previous research, and this allowed us to build on our earlier analyses of rural/urban educational disparities for Australia (K. Sullivan et al., 2013, 2014). Second, PISA 2009 is the most recent publicly available dataset for which Reading was the discipline examined in depth (one of the three subjects is the focus of each round); our use of reading as students’ foundational literacy allowed us a high degree of confidence in the cross-national comparability of PISA data. We used descriptive statistics to uncover patterns in the distribution of educational outcomes and experiences across the rural-urban continuum, within and between the three countries. This approach is common when comparing national educational systems and outcomes (see, for example, Carnoy, Khavenson, & Ivanova’s, 2015, study of Russia, Estonia, and Latvia using PISA).
PISA 2009 comprised 470,000 students across 65 countries. The numbers of students and schools participating in PISA 2009 from Australia, Canada, and New Zealand is shown in Table 1. The sample for each country is nationally representative in terms of student and school characteristics (Knighton, Brochu, & Gluszynski, 2010; Telford & May, 2010; Thomson, De Bortoli, Nicholas, Hillman, & Buckley, 2010). Most countries sample between 2,000 and 5,000 students, but some including Australia and Canada sample larger numbers of students so that state or provincial comparisons can also be made. The Canadian sample is particularly large because organizers wanted to “. . . produce reliable estimates representative of each province and for both French and English language school systems . . .” (Knighton et al., 2010, p. 10).
Number and Proportion of Participating Schools and Students.

Note. Percentages may exceed 100 due to rounding. AUS = Australia; CAN = Canada; NZL = New Zealand.
Each school selected to participate in PISA is identified according to the size of the community in which it is located. This variable School Community comprises the following five categories:
Village, hamlet, or rural area: A population less than 3,000 people;
Small Town: A population between 3,000 to about 15,000 people;
Town: A population between 15,000 to about 100,000 people;
City: A population between 100,000 to about 1,000,000 people;
Large City: A city with more than 1,000,000 people.
Table 1 also shows the number and proportion of students and schools in each school community, for each of the three countries.
As seen in Table 1, the proportion of students in rural areas is greater in Canada than either Australia or New Zealand. In general, students are more evenly distributed across the five types of school community in Canada than in the other two countries, and the distribution of students across the five school communities is roughly comparable in Australia and New Zealand.
The PISA 2009 dataset includes student achievement data across three subject domains, plus a large array of contextual information about schools, students, and their home environments. Data were also collected from school principals (or their deputies) about a range of school characteristics, and from students about their perceptions of their school as well as background information about their parents and home environment. In this investigation, we compared educational outcomes among the five school communities within each country as well as across the three countries. Student reading performance in PISA 2009 was analyzed to identify patterns of rural disadvantage or inequity in educational outcomes. We also used school and student background questionnaire data to gain a deeper understanding of rural disadvantage. For example, we analyzed the following variables: principals’ perceptions of shortages of teaching personnel and quality of educational resources, students’ perceptions of classroom disciplinary climate, students’ perceptions of their teachers’ instructional strategies, and students’ perceptions about their relationships with teachers.
We also examined how student SES varies across rural/urban locations. We calculated the SES of each school community by averaging the SES status of all participating students in each school community type, for each of the three countries. PISA’s measure of SES is known as “economic, social and cultural status” (ESCS) and is an index that comprises three variables: parental educational attainment; parental occupational status; and family material, educational, and cultural resources. The family resources variable is particularly comprehensive and includes information from students about the number of books, musical instruments, computers, and artwork in the home, the number of bedrooms and other material items, as well as the frequency of cultural activities such as attending theatrical performances or visiting museums. The proportion of students in each school community that has a parent with a bachelor’s degree or higher was also incorporated into this study. We provided these data because SES, which includes parental education, is a strong predictor of educational opportunities and outcomes.
We compared rural-urban achievement gaps within and across the three countries to assess rural disadvantage reflected in students’ reading literacy. Reading and other literacy performance scores are scaled to a mean of 500 and a standard deviation of 100 score points. We used the International Data Explorer (IDE), available from the U.S. National Center for Education Statistics (NCES), to calculate mean reading performance for each school community category across Australia, Canada, and New Zealand.
PISA uses a two-stage sampling process in which schools are first sampled and then students sampled within participating schools. This approach has the potential to increase the standard errors of population estimates. In this study, therefore, and consistent with PISA’s recommendation, all statistics have been generated using the NCES’s IDE, via a Balanced Repeated Replication (BRR) procedure to generate unbiased standard errors that take account of clustering in the samples (OECD, 2009). Furthermore, the NCES’s IDE uses t tests to calculate whether differences between means are statistically significant, and we report the results of these tests in our analyses. While t tests are generally not used to compare means from more than two groups because they increase the probability of Type I errors, they are used by the NCES and the OECD for large-scale assessment data including PISA, consistent with these organizations’ standards and practice (see the NCES IDE help manual at https://nces.ed.gov/surveys/international/ide/HelpFiles/PISAIDEHelpGuide508_063014.pdf for more information).
In summary, we calculated means for six composite variables (indexes) in PISA related to school resources and learning environments, for the five school community categories in each country. Four of these index variables are derived from student responses, and the other two are from school principal responses. The four student index variables are “classroom disciplinary climate,” “student-teacher relations,” “teacher use of structuring and scaffolding strategies,” and “teacher stimulation of reading engagement.” The two indexes derived from principal questionnaire responses are “quality of educational resources” and “teacher shortage.” PISA uses item response theory (IRT) to scale index variables to have a mean of “0” (zero) and a standard deviation of “1” (one; OECD, 2009). We then compared the means across school community types within and between the three countries. We calculated the size of the gap between the highest and lowest scoring community type to measure the extent of rural disadvantage (if any) within each country, in reading literacy. Based on Slavin and Fashola (1998), we considered an effect size of 0.25 standard deviations or greater as educationally significant.
Findings
We examined how school communities vary by student SES and parental education. Following this, we calculated the average reading literacy performance for students in each school community type. These findings are shown in Table 2 below and also graphically in Figure 1. We combined these context and performance findings into one table to highlight the degree to which they are related. Table 2 also shows whether between-country differences in reading performance for each school community type are statistically significant as measured by independent t tests conducted using the IDE.
Mean Student Reading Performance, Socioeconomic Status, and Parental Education, by School Community Type.
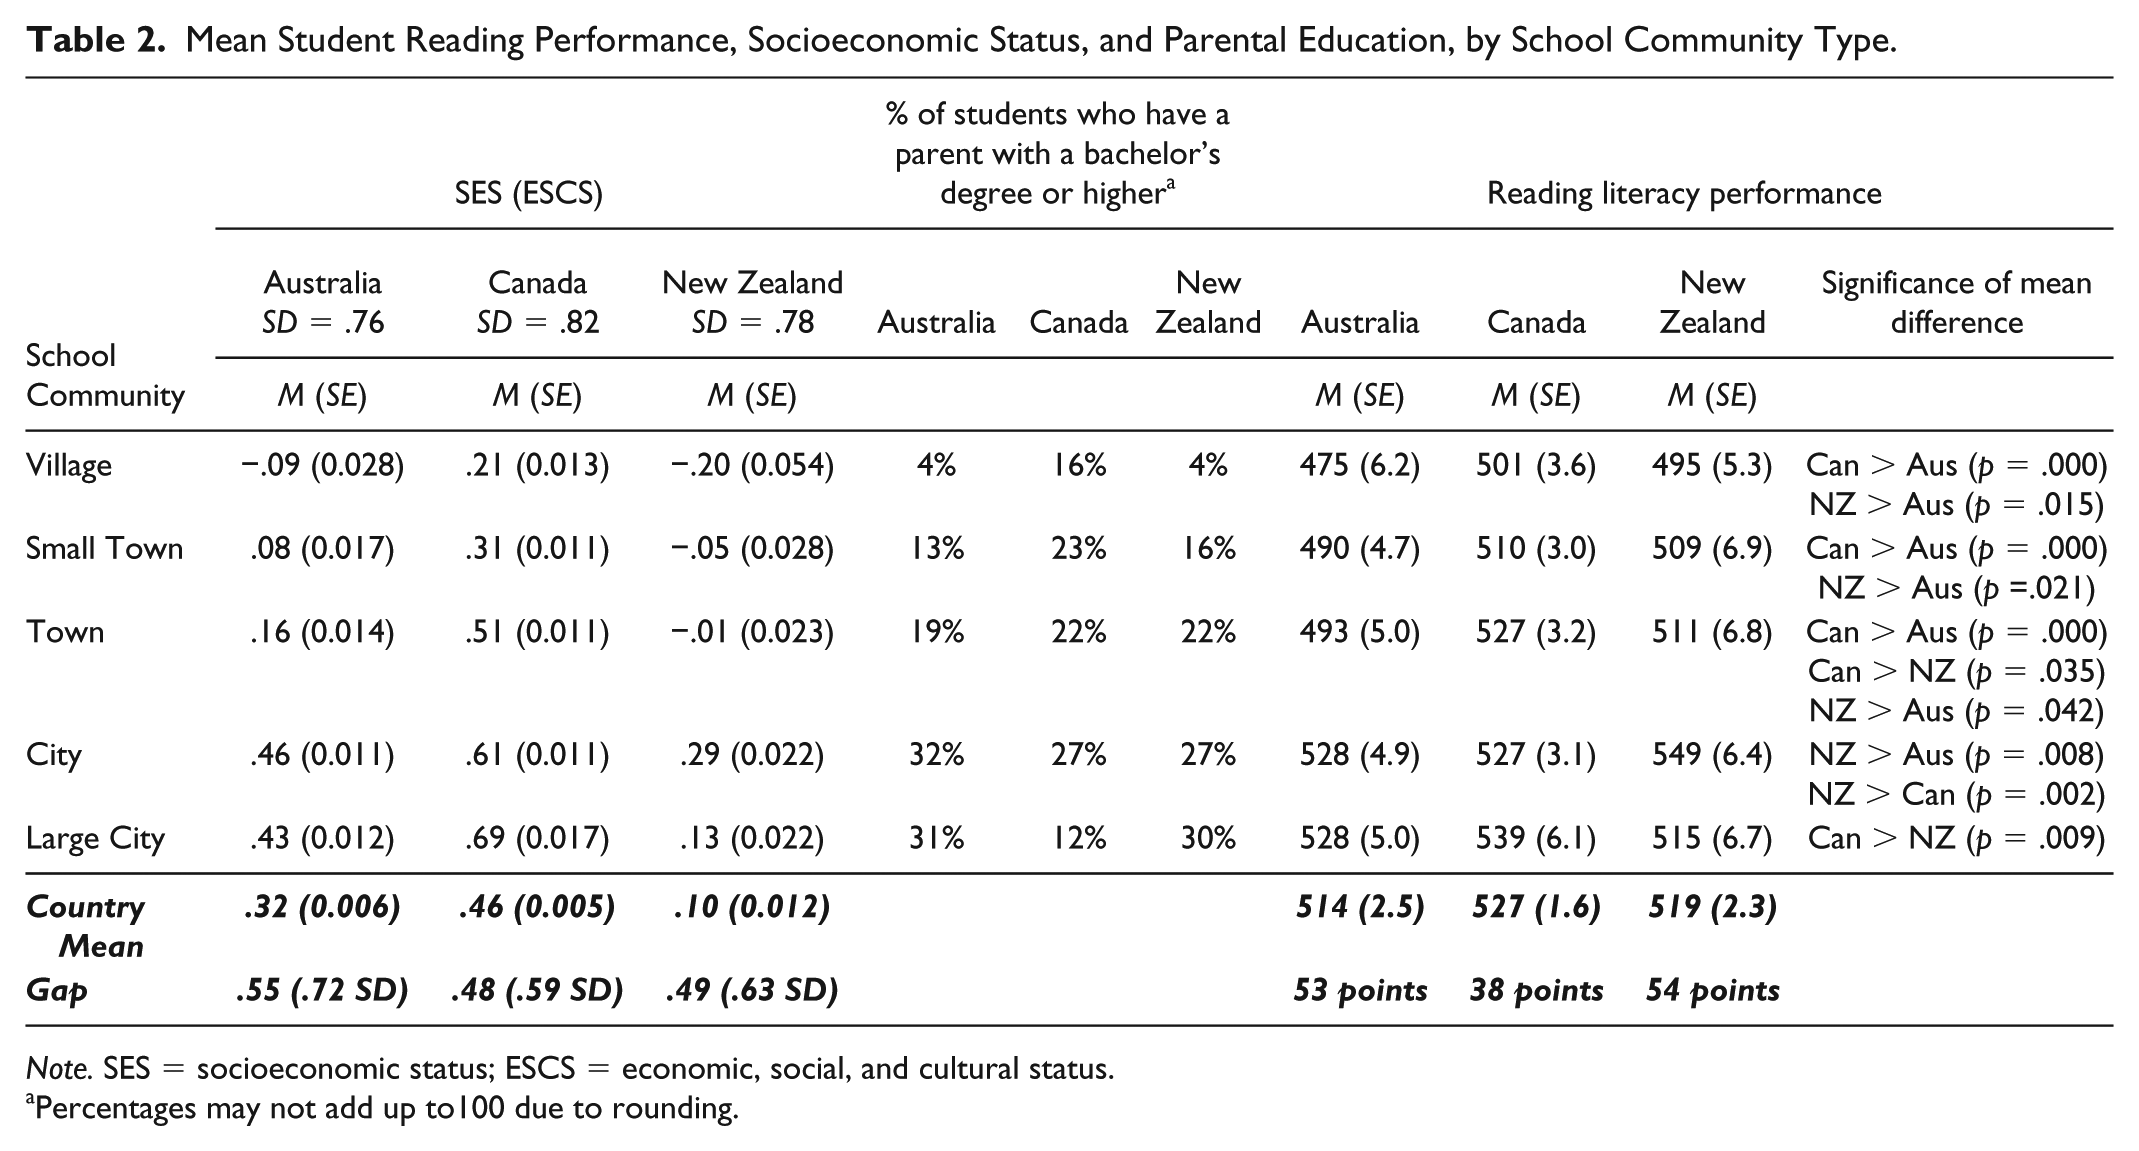
Note. SES = socioeconomic status; ESCS = economic, social, and cultural status.
Percentages may not add up to100 due to rounding.

Mean SES and reading performance, disaggregated by school community type in Australia, Canada, and New Zealand.
As can be seen in Table 2 and graphically in Figure 1, both context variables (mean student SES and proportion of students with a university-educated parent) are generally positively related to school community size in all three countries, notwithstanding the dip in the proportion of parents with bachelor’s degrees in “Large City” school communities in Canada and the decline in SES for “Large Cities” in New Zealand. The values for these variables are typically higher in urban settings (cities) and lower in rural areas, and the differences within countries are substantial, especially in Australia and New Zealand. For example, only 4% of Australian and New Zealand students in villages have a university-educated parent, compared with 30% to 31% in large cities in these two countries. Comparison of the two context variables across the three countries shows that mean student SES at the country level is lowest in New Zealand and highest in Canada; this pattern is consistent for all five school community types across the three countries.
Table 2 also shows mean reading literacy performance for each school community. In each of the three countries, reading performance is positively related with community size/type, with villages showing the lowest reading performance, on average, and cities (New Zealand) and large cities (Australia and Canada) showing the highest. In New Zealand, mean reading literacy is the same in large cities as it is in smaller urban communities with 3,000 to 100,000 residents. The gap between the highest and lowest scoring school community is substantially larger in Australia and New Zealand (53 and 54 points, respectively) than in Canada (38 points). A score of 50 points is roughly equal to 1 year of schooling (Thomson et al., 2010). Student performance in the two smallest (most rural) communities (villages and small towns) is substantially lower in Australia than in Canada or New Zealand. In other words, rural disadvantage is sharper in Australia than in Canada or New Zealand. This can be seen more clearly in Table 3, which shows the score-point gap in reading performance between each country’s mean and the means for each of its five school community types.
Score Point Differences Between Country Mean and School Community Mean in Reading Literacy Using PISA (2009).

Note. PISA = Programme for International Student Assessment.
Cross-nationally, students in the most rural school communities performed substantially worse in Australia than in Canada or New Zealand. New Zealand’s reading literacy performance is greater than Australia’s in all school communities except large cities. Figure 1 shows very clearly the strong positive relationship between mean SES and reading performance across the school communities within each country. It it also the case, however, that mean reading performance is 20 points higher in rural settings (i.e., villages) in New Zealand compared with Australia despite the fact that average SES and parental educational attainment is similar (in fact, lower for New Zealand). A difference of 20 score points is substantial, representing roughly one-half year of school (Thomson et al., 2010). As can be seen in Figure 1, New Zealand school communities in general show substantially higher reading performance than might be predicted by their mean student SES. The context variables, however, do not explain why rural (and regional) disadvantage is greater in Australia than in New Zealand or Canada. While the observed difference between New Zealand and Australia in rural settings could be seen as a perplexing finding, it may also suggest that educational performance, and underlying opportunity, can be mediated by education policies and practices.
To shed further light on these cross-national differences in reading performance, disaggregated by school community types (urban vs. rural), we compared differences in school learning resources and learning environments across school community types, as perceived by students and principals. Table 4 shows school principals’ perceptions of the degree to which shortages of teaching personnel and educational resources hinder learning in their school. We report the means for these two indexes for each school community type, in each country. We also calculated the difference between the highest and lowest scoring school community for each country, expressed in standard deviation units to show the magnitude of the difference (effect size).
School Principals’ Perceptions About Their School’s Resources and Teacher Shortages.

Note. The “teacher shortage” index is reversed, that is, higher values mean more shortages. The “educational resources” index is inverted for scaling, and positive values indicate better quality educational resources.
As can been seen from Table 4, school community size is associated with teacher shortages in all three countries, with school principals in smaller (more rural) communities generally reporting more shortages than principals in larger communities (with a few exceptions, such as large cities in New Zealand and towns in Canada). Shortages of teaching personnel vary to a large degree across the three countries. Principals in Australia are the most likely to report that shortages of teaching personnel hinder learning in their school, and principals in Canada are the least likely. School principals in Australian villages report by a large margin the highest shortages (M = .67); this mean is substantially larger than in New Zealand villages (M = .32), which in turn is much larger than in Canadian villages (M = –.04). Principals in villages and small towns in Canada report shortages that are less than the OECD average, whereas shortages are on average considerably more than the OECD average in Australia and New Zealand. Across all school communities except large cities, principals report higher shortages of teaching personnel in Australia than in New Zealand, which may help explain why reading performance is higher in the latter. As suggested by this finding, teacher shortages are not only a problem for rural schools. In New Zealand, principals in the large city community reported the second highest mean on this index (after villages).
The quality of educational resources is generally positively related to community size in all three countries, with school principals in villages and small towns generally reporting that shortages of educational resources hinder learning to a greater extent than principals in larger (more urban) communities. Principals in cities have the most favorable responses regarding the quality of their educational resources in all three countries. Between-community inequalities on this measure are substantial and the size of the observed differences is educationally significant for all three countries. Across the three, New Zealand school principals report the highest shortages of educational materials, while the averages for Canada and Australia are similar. As shown in Table 4, differences in quality of school educational resources between communities with less than 100,000 residents in Australia and New Zealand are minimal. It is not likely, therefore, that this measure explains why New Zealand students in communities with less than 100,000 residents have higher reading achievement than their peers in Australia.
In contrast, Table 5 compares the school community means for the four student-derived indexes about teachers and classroom disciplinary climate. Classroom disciplinary climate is, on average, slightly lower in all three countries than the OECD average. The country means for Canada and Australia are very similar and slightly more positive than in New Zealand. Across all three nations, the lowest values are reported in small towns (3-15,000 residents) and towns (15-100,000), not villages (less than 3,000). In Australia, the difference in the reported disciplinary climate between regional communities (village, small town, and town) and urban communities (city and large city) is large, favoring larger (more urban) communities. In Canada and to a lesser extent New Zealand, variations across communities are more evenly distributed. Differences in disciplinary climate across the five school communities are not educationally significant in New Zealand or Canada, as they are in Australia. Among the three countries, Australian students in the three smallest school communities report the least positive disciplinary climates, and Australian students in the two largest school communities report the most positive climates.
Student Perceptions of Classroom Disciplinary Climate, Teacher-Student Relations, and Teacher Instructional Strategies.
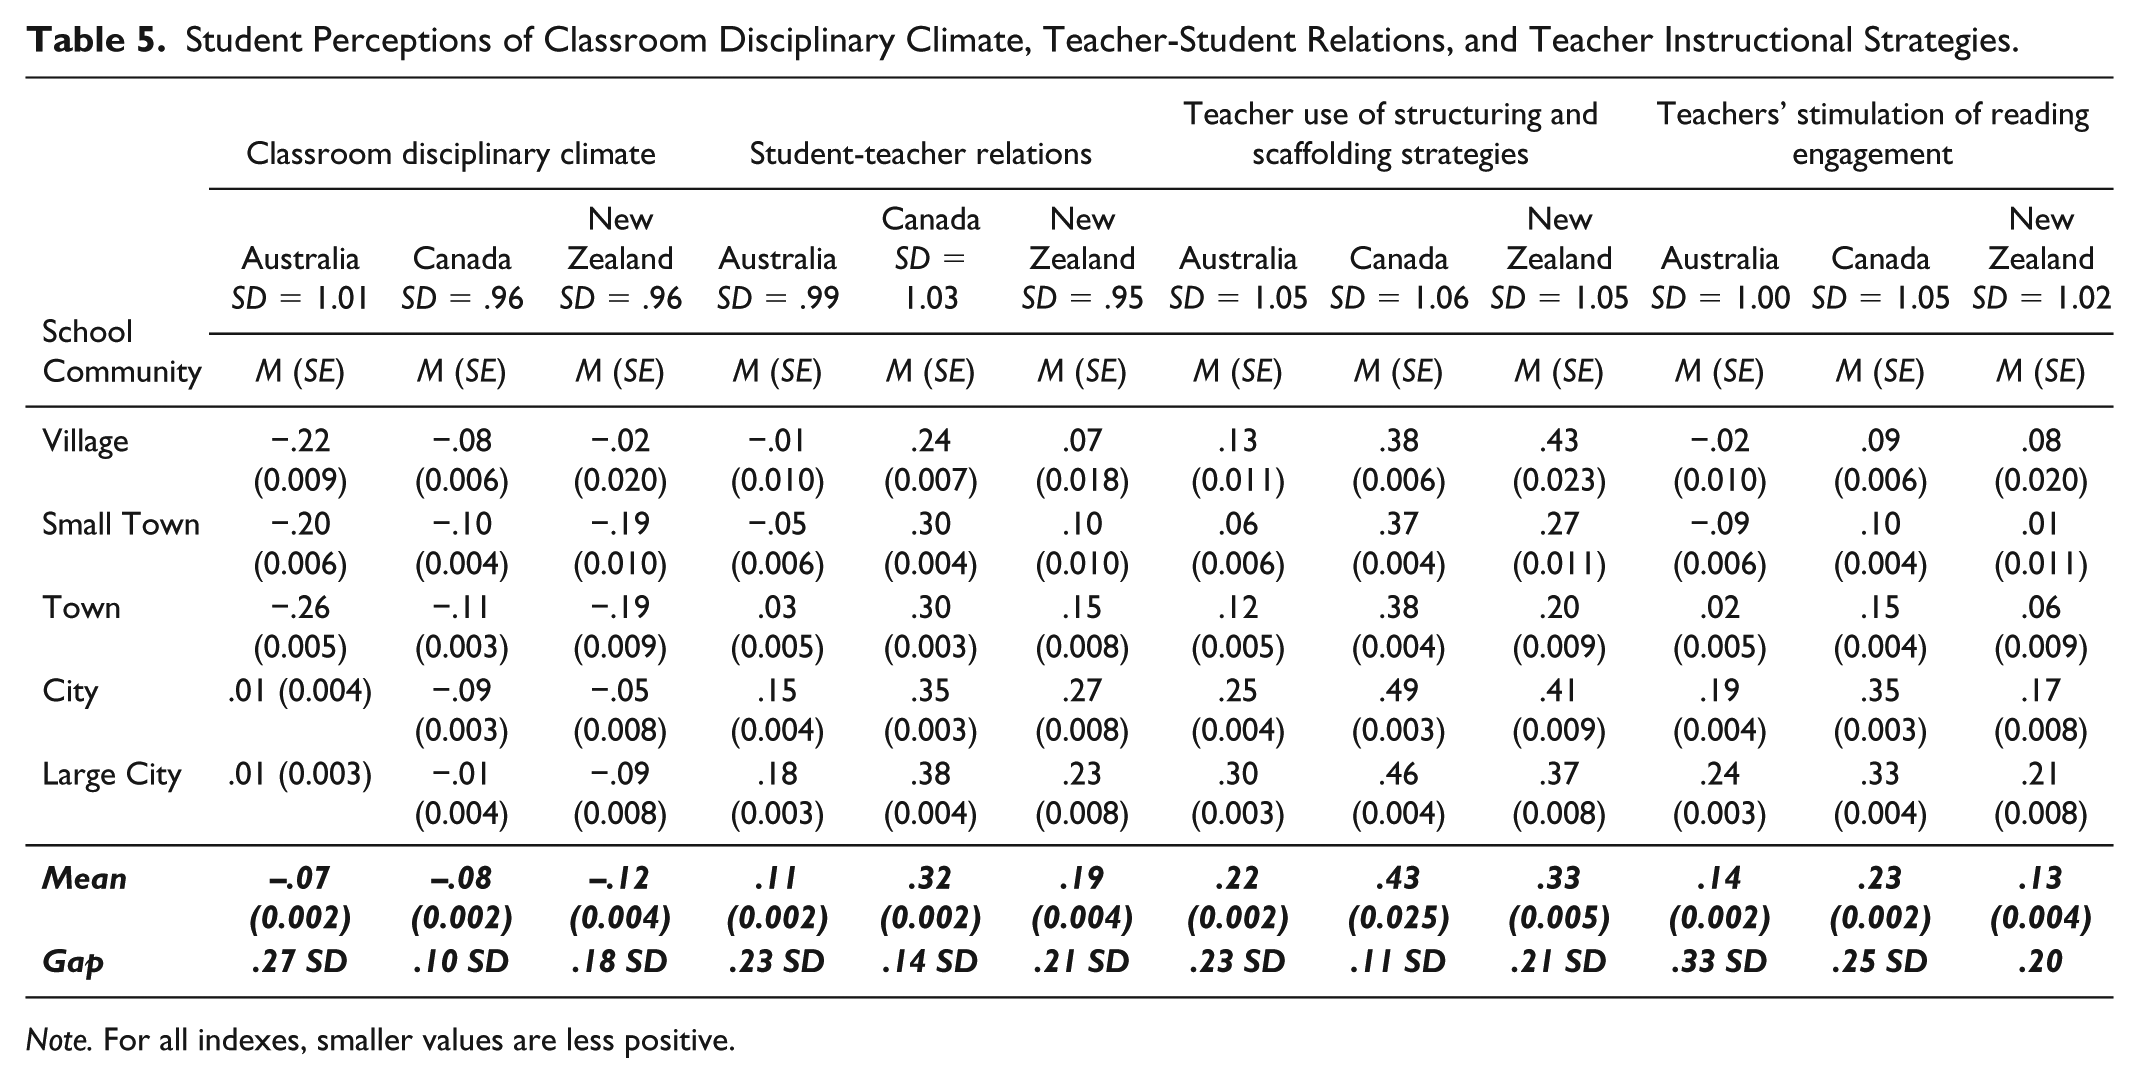
Note. For all indexes, smaller values are less positive.
Table 5 also shows how students’ perceptions of their relations with teachers in their schools vary by school community type and country. Within each country, this relationship is positively associated with community size, with the least positive values found in rural settings (villages or small towns), and the most positive in cities and large cities. The difference between the highest and lowest school community means, as expressed in SD units, is greatest in Australia and smallest in Canada, although none of these gaps is large enough to be considered educationally significant. Among the three countries, Canada has the highest (most positive) country mean and Australia the lowest. Across all five school community types, Australian students report substantially less positive relationships with their teachers than do their peers in Canada and New Zealand.
The last two indexes presented in Table 5 capture students’ perceptions of their teachers’ instructional strategies. For teacher use of structuring and scaffolding strategies, students in all five school communities in all three countries report higher values than the OECD average. The use of structuring and scaffolding strategies is positively associated with community size in Australia and Canada. Differences across the school communities are the largest in Australia and the smallest in Canada, although they are less than .25 SD in all three countries and are, therefore, not educationally significant by standard benchmarks. Across the three countries, Australian students in all five school communities are the least likely to report that their teachers use structuring and scaffolding strategies, whereas Canadian teachers are the most likely.
The final instructional index we examined is students’ perceptions of teachers’ stimulation of students’ engagement in reading. Students in all three countries report more positive responses than the OECD average in all school community types except villages and small towns in Australia. In all three countries, this index is positively related to community size, with the most favorable responses occurring in the largest (most urban) school communities, and the least favorable responses occurring in the smallest (most rural) school communities. Differences among school communities are the largest in Australia and the smallest in New Zealand and are educationally significant in Australia and Canada. Among the three countries, Canadian students report the most favorable reading engagement in all five school community types. Student responses in the three smallest, most rural school communities are the least favorable in Australia.
Discussion and Conclusion
Australian, Canadian, and New Zealander school systems share several organizational features and sociocultural traditions. Examining educational inequity associated with rural-urban differences for these three culturally alike systems provides the prospect of better understanding variables that could potentially reduce the disadvantages in educational opportunities and outcomes for rural communities. As researchers based in Australia, we are, of course, concerned with identifying trends in student and school variables to inform efforts that reduce rural educational disadvantage in Australia. The insights uncovered via large-scale international data, however, may also be useful for other countries. The findings presented here may be beneficial for informing theory about the contexts and conditions that potentially mediate rural educational disadvantage in other national contexts.
Our analysis of PISA data shows that rural educational disadvantage is more pronounced in Australia than in Canada or New Zealand. This can be seen in two ways, both within and across the three countries. First, the magnitude of the gap in educational outcomes (specifically, reading literacy performance) between rural and urban students is larger on average in Australia than in Canada or New Zealand. Second, students in rural communities in Australia enjoy less positive educational experiences than their peers in Canada or New Zealand. These findings are intriguing and somewhat surprising given that average SES (e.g., parent educational attainment) in rural school communities is similar in Australia and New Zealand.
Explanations by researchers such as Williams (2005) suggest that students living in villages and small towns, who typically have lower reading performance compared with their urban peers, often have lower SES as well. Furthermore, the perception that SES and academic achievement are closely linked resonates with the broader education community throughout Australia and reflects similar findings in international education research (Reardon, 2011). The current analysis, however, shows that rural students in New Zealand, with similar SES on average to their peers in Australia, have better reading literacy performance at 15 years old, as measured by PISA.
The reason behind New Zealand’s rural success compared with similar school communities in Australia is not clear. This analysis may, however, provide some insight. On the four learning environment measures reported by students, Australian students consistently report the least favourable responses among the three countries. Principals in rural communities in Australia were also the most likely to report that shortages of teaching personnel hinder learning in their schools, a finding supported by Harris, Jensz, and Baldwin’s (2005) research. Some researchers, such as Downes and Roberts (2018), question why teacher shortage remains an ongoing issue given our well-developed knowledge in this area. One could argue that there have been many studies about rural school staffing, but few linked to policy or tracked across time. Perhaps one answer lies in geography. For example, one could reasonably hypothesize that significantly smaller geographic distances between rural and urban communities in New Zealand, contrasted against enormous and challenging distances in Australia, reduce the level of shortages of teaching personnel for rural communities in New Zealand, and, therefore, weaken the relationship between rurality and educational disadvantage. Given greater distances between urban and rural or regional centers in Australia, it is not difficult to envisage greater staffing difficulties. The impact on attracting and retaining staff and implementing staff development would be great. For example, with regard to staff professional learning, there would likely be reduced opportunities for skill development in rural communities, and that could have direct impact on career development and skills, and, by extension, teacher recruitment and retention. Perhaps, therefore, future research could examine the apparent differences in these relationships. It would seem quite plausible that rurality (the distinction between larger and smaller school community types) impacts more negatively when geographic distances between school communities are large, with many rural settings classified as “remote,” as in the case of Australia, than when distances separating communities are smaller and less challenging, such as in New Zealand.
Whether or not a hypothesis about the differential effects of distance on rural disadvantage via (for example) the differential recruitment, retention, or professional learning of teachers ultimately is supported, this study nevertheless has limitations. Perhaps most important, school-level variables used in the analysis are based on principals’ and students’ reported perceptions and experiences rather than independent observations. In addition, PISA samples 15-year-old students, typically in their last year of compulsory schooling, and the associations observed among rurality, SES, and educational outcomes, which typically manifest as rural educational disadvantage, may not hold at other levels of schooling (e.g., primary).
As an exploratory study that documents differences between school communities and education systems, this study lays a foundation for several future lines of enquiry. Future research could explore how schools in rural communities and small towns differ among Australia, Canada, and New Zealand, for example. Observational studies of classrooms and ethnographic studies of schools could help explain why educational outcomes are weaker in rural Australia than in comparable communities in New Zealand. Another line of research could examine how teachers are allocated to rural schools in the three countries. Future studies that examine the nature and degree of support and professional development provided to rural school teachers in the three countries could illuminate how best to support teachers in Australia, as well as contribute to a larger theoretical framework about the role of schools and school systems in mediating rural educational disadvantage.
We believe that it is vital for education systems to understand the significance of “gaps” in educational outcomes among school communities within a country. Since PISA 2009 and despite efforts to close urban-rural disparities in Australia’s literacy performance, unequal outcomes persist between Australia’s urban (metropolitan) and rural (provincial and remote) communities, and these differences remain large (Thomson, De Bortoli, & Underwood, 2016). For example, this study indicates that fewer Australian rural students report that their teachers foster supportive relationships with their students, promote a productive classroom climate, or use teaching strategies that are generally thought effective for teaching reading, in comparison to rural school teachers in New Zealand or Canada. Wallace (2008, p. 6) states, “The disparity between learners’ interpretations of life and knowledge, and educational institutions’ interpretations of learners’ lives and knowledge in regional Australia, can impact on learners’ engagement with education and training.” It is evident that teachers need to be culturally assimilated into a community and cannot relate to, or teach, what they do not know or understand. This message is reinforced by several researchers committed to exploring rural education issues in the context of the values and motivations of the people who live in rural and remote communities, and who argue that social justice should frame our education programs (Cuervo, 2016; Pini & Bhopal, 2017; Roberts & Cuervo, 2015; White, 2015).
Considering the notably higher level of government expenditure on public education, as a percent of GDP, provided by New Zealand, it would be interesting to examine how the distribution of education funding varies between Australia, Canada, and New Zealand. Researchers such as Kline, White, and Lock (2013) have suggested that teachers in Australian rural school communities could be better supported and trained, and Schleicher (2009) has used PISA data to foreground aspects of educational policy associated with high-quality learning outcomes and equitable distribution of learning opportunities. Perhaps a finer grained examination of the distribution of educational funding for Australia could apply an urban-rural lens, as well as lessons from Canadian and New Zealander systems, to more effectively address the persistent challenge of rural disadvantage. We hope that, like our predecessors, this study contributes in a positive way to improving rural educational disparities in Australia. We hope community awareness of rural education inequity is thereby increased and policies promoted that influence educational systems to make changes that support equal opportunities and equitable outcomes for rural and remote students across Australia.
Footnotes
Declaration of Conflicting Interests
The author(s) declared no potential conflicts of interest with respect to the research, authorship, and/or publication of this article.
Funding
The author(s) received no financial support for the research, authorship, and/or publication of this article.