
Abstract
This research examines the behavior of youth club basketball coaches after a shot in real-competition situations. Six licensed coaches of the Spanish Basketball Federation took part in this study; all the teams competed in the Galician league (Spain) in the 2010/2011 and 2011/2012 seasons. There were five men’s teams and one women’s team, with players between 11 and 17 years old. To record the behavior, a new instrument was used based mainly on the Coach Behaviour Assessment System (CBAS), which also incorporates some of the adjustments made in the SOCE (Sistema Observación Conductas Entrenador developed by Montero). The instrument was designed to analyze the behavior of coaches after their players have taken shots. In total, 38 official matches were analyzed. Registered behaviors were compared with auto-perceived data in the same situation. From the results obtained, significant differences between the registered behavior and the auto-perception of the coaches are evident.
Introduction
Sport coaches are a group of professionals widely discussed in the field of sport psychology (Gallimore & Tharp, 2004; Gilbert & Trudel, 2004; Smoll & Smith, 2009; Tharp & Gallimore, 1976; Walters, 2011). In this article, we focus on analyzing their interventions during training sessions and games, which are essential in the performance of athletes (Calpe-Gómez, Guzmán, & Grijalbo, 2013; Mouchet, Harvey, & Light, 2014; Stein, Bloom, & Sabiston, 2012; Trudel, Côté, & Bernard, 1996; Zetou, Amprasi, Michalopoulou, & Aggelousis, 2011). The behaviors of coaches determine their effectiveness (Duda, 2001; Gomes & Resende, 2014; McArdle & Duda, 2002; D. L. Sánchez & Viciana, 2002; Stein et al., 2012), influencing in turn the efficiency and cohesion of the team (Alzate, Lázaro, Ramírez, & Valencia, 1997; Carron & Hausenblas, 1998; Feltz & Lirgg, 1998, 2001; Turman, 2003; Vargas-Tonsing, Warners, & Feltz, 2003), as well as the athletic performance of the players. It is essential, therefore, that coaches understand the type and frequency of their behavior as well as their influence on athletes (R. E. Smith & Smoll, 1990).
To analyze such interventions, several instruments have been used (Miller, 1992; More, Mcgarry, Partridge, & Franks, 1996; R. E. Smith, 1993; R. E. Smith & Smoll, 1990, 1997; R. E. Smith, Smoll, & Curtis, 1979) with both psychological and pedagogical objectives and a priority focus on team sports (Guzmán & Calpe-Gómez, 2012; Lacy & Goldston, 1990; Mouchet et al., 2014; Rutten et al., 2008; M. Smith & Cushion, 2006). These are characterized by the combination of effort and ability of different athletes to achieve a common objective, by achieving goals or points, which will determine the outcome of the competition.
Several studies stress the relevance of the shot in basketball as a predictor of the outcome of matches (Claramount & Balagué, 2010; Ibáñez, Lozano, & Martinez, 2001; Wissel, 2010). Furthermore, the importance that basketball players give to the shot should be considered (Buñuel, Sánchez, Fuentes-Guerra, & Godoy, 2007; Montero, Ezquerro, & Saavedra, 2009; Ortega, Palao, Sainz de Baranda, & García, 2009). Based on the concepts of Chelladurai (1990), “preferred coaching behavior” is the behavior exhibited by coaches that is consistent with players’ expectations and standards, while “coach perceived data” are what coaches think they did. In our research, we compare “coach perceived data” (what coaches think they did) with the “actual behavior” (exhibited by coaches and registered by the observers). Therefore, it was considered that the study of coaches’ reactions during competition after a shot has been taken by any team player could be an interesting line of research.
Aims
The aim of this study is to compare the actual reactions coaches have after a shot by both their players and rival players in competitive situations with how they believed they reacted.
Materials and Method
Participants
Six licensed coaches of the Spanish Basketball Federation (M = 28.08, SD = 3.09 years) took part in this study; all the teams competed in the Galician league (Spain) in the 2010/2011 and 2011/2012 seasons. In total, 38 official matches were analyzed.
Five of the analyzed teams were male, and one team was female. Players were between 11 and 17 years old. The required written consent to participate in the study was obtained from all the participants. All procedures used in this research, including surveys, image and voice recording, further analysis, and conclusions were approved by the Ethics Committee of the University of A Coruña (EC 05/2014).
Instrument for Observing the Behavior of a Coach
The new instrument used for recording behavior was based mainly on Coach Behaviour Assessment System (CBAS by Cruz, 1989; R. E. Smith, Smoll, & Hunt, 1977) and also incorporated some of the adjustments made in the SOCE (Sistema Observación Conductas Entrenador developed by Montero, 2004). This adaptation consisted of recording the coach’s behavior, associating it with the different shooting options, their outcome, and which athlete made the shot. A shot was described as a “hit,” following Montero (2004), when points could be scored by the observed coach’s team (e.g., the player receives a personal foul in the act of shooting), or in case the opposite team fails a shot. Conversely, a “mistake” meant a shot was missed or the opposing team scored.
Instruments Used for the Control of Coach’s Behavior
a. Video cameras, videotapes, and sound
Two digital video cameras (Samsung SMX-F30BP and Hitachi DZ-HS500E/E) and synchronized lapel microphone (Acoustic control-Mu-1002) were used for the recording of the matches, so that one followed the gameplay while the other focused on the coach. The sound was recorded with a receptor and specific software Audacity® (Mazzoni & Dannenberg, 1999). After each game, the video and sound were synchronized in the Pinnacle Studio 10.0® (2005) software, and later the coach’s behaviors were analyzed from one unique synchronized video of each game. Initially, two games of each coach were recorded to reduce the potential impact of our presence and equipment (microphone and cameras) on the behaviors of coaches and players. These two games for each coach were only used to reduce Hawthorne effect and also to estimate the reliability of the observers, not for further analysis in our study.
b. Log sheets
With the aim of coding the data, a log sheet was designed with the following variables: type of shot, shirt number of the shooter, coach’s behavior, coach’s conduct moment (instantaneous or delayed), person who is subject to this conduct, and score at the time of the throw.
Survey for the Coach
After each game, the coaches completed a self-assessment questionnaire designed to identify the conduct they considered to have made after the shots of both teams. The head investigator was present while coaches completed questionnaires, in case any questions arose. In this way, we could compare actual (observed) with preferred behavior (Chelladurai, 1990, 1993; Crespo, Balaguer, & Atienza, 1994; F. Sánchez, 1996). This scale has three versions: (a) Leadership Scale for Sports (LSS)-1 referring to “the preferences of athletes,” (b) LSS-2 referring to “version of perceptions athletes,” and (c) LSS-3 referring to the “trainer version,” with special implications for our study, which evaluates the perception of the coach himself. The behaviors analyzed were “Positive Reinforcement After Hit (PRAH),” “Mistake-Contingent Encouragement (MCE),” “Mistake-Contingent Technical Instruction (MCTI)” (positives), “Punishment (P)” (negative), and “Ignoring a Mistake (IM)” (inhibition). We included these categories in the coach analysis because it was not possible to ask coaches about all behaviors immediately after their games. Following the recommendations of Lorenz, Melby, Conger, and Xu (2007) to avoid confusions in the methodological process and to improve the correlations between the data perceived and registered, the coaches completed the questionnaires immediately after the analyzed situation (match) and in the same context where the behaviors were recorded (basketball gym).
Training and Reliability of Observers
Two graduates in Science of Physical Activity and Sport, experts in basketball, completed the training tasks. The training procedures of observers were conducted in three phases of 11 sessions each, with a total of 33 sessions (49.5 hr). First, during the observation (in DVD format), the two observers registered the categories. In case there was any incongruence in either register, it was reviewed by the main researcher. Second, the training of observers was performed during live games in the city basketball gyms. Finally, observer training was done using one unique video including the match video, the video of the coach’s behaviors, and the sound (all synchronized). This was the final format used to conduct the observation and recording of the official games analyzed in the present study. To check the degree of agreement between different observers (inter-observers) and the degree of agreement among ratters (intra-observers), Cohen’s kappa coefficient was used (Cohen, 1960). The training procedure was used to achieve a minimum degree of reliability of .80 of this statistic. The results are presented in Table 1.
Values of Agreement Inter- and Intra-Observers.
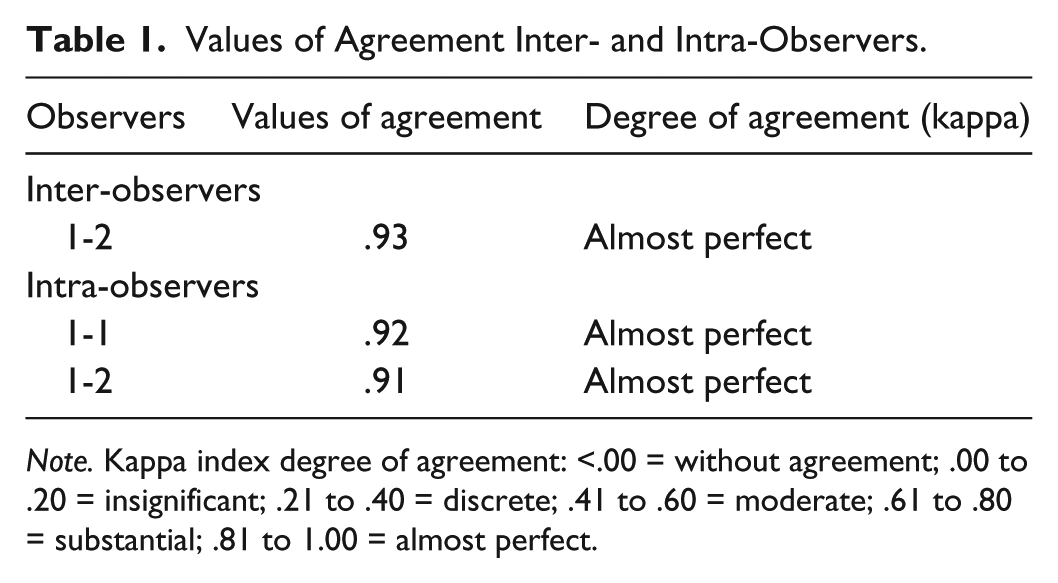
Note. Kappa index degree of agreement: <.00 = without agreement; .00 to .20 = insignificant; .21 to .40 = discrete; .41 to .60 = moderate; .61 to .80 = substantial; .81 to 1.00 = almost perfect.
Statistical Procedure
The statistical package used for all the analysis was R (R Core Team, 2014). The type of probability distribution of the analyzed data was studied using the Shapiro–Wilk test (Shapiro & Wilk, 1965, 1968). This test showed that the distribution data of several behaviors did not fit the theoretical normal distribution (Table 2). Therefore, data were assumed to be non-normal, and the non-parametric Kruskal–Wallis one-way ANOVA by ranks (Kruskal, 1952; Kruskal & Wallis, 1952) was used to compare auto-perceived and registered behavior. According to this test, p values equal to or below .05 suggest the presence of significant differences in the medians of at least two populations at 95% confidence level. Furthermore, a visual inspection of the data was performed using box plots (Figure 1).
Summarized Data (n = 38 Records), Normality Analysis (Shapiro–Wilk Test), and Comparison Between the Registered and the Perceived Behavior of the Coaches (Kruskal–Wallis Test).

Note. Av. = average; SD = standard deviation; M.R. = mean rank; >M = >median; ≤M = ≤median; Sig. S.W = Shapiro–Wilk test; Sig K.W = Kruskal–Wallis test; PRAH = Positive Reinforcement After Hit; MCE = Mistake-Contingent Encouragement; MCTI = Mistake-Contingent Technical Instruction; P = Punishment; IM = Ignoring a Mistake.
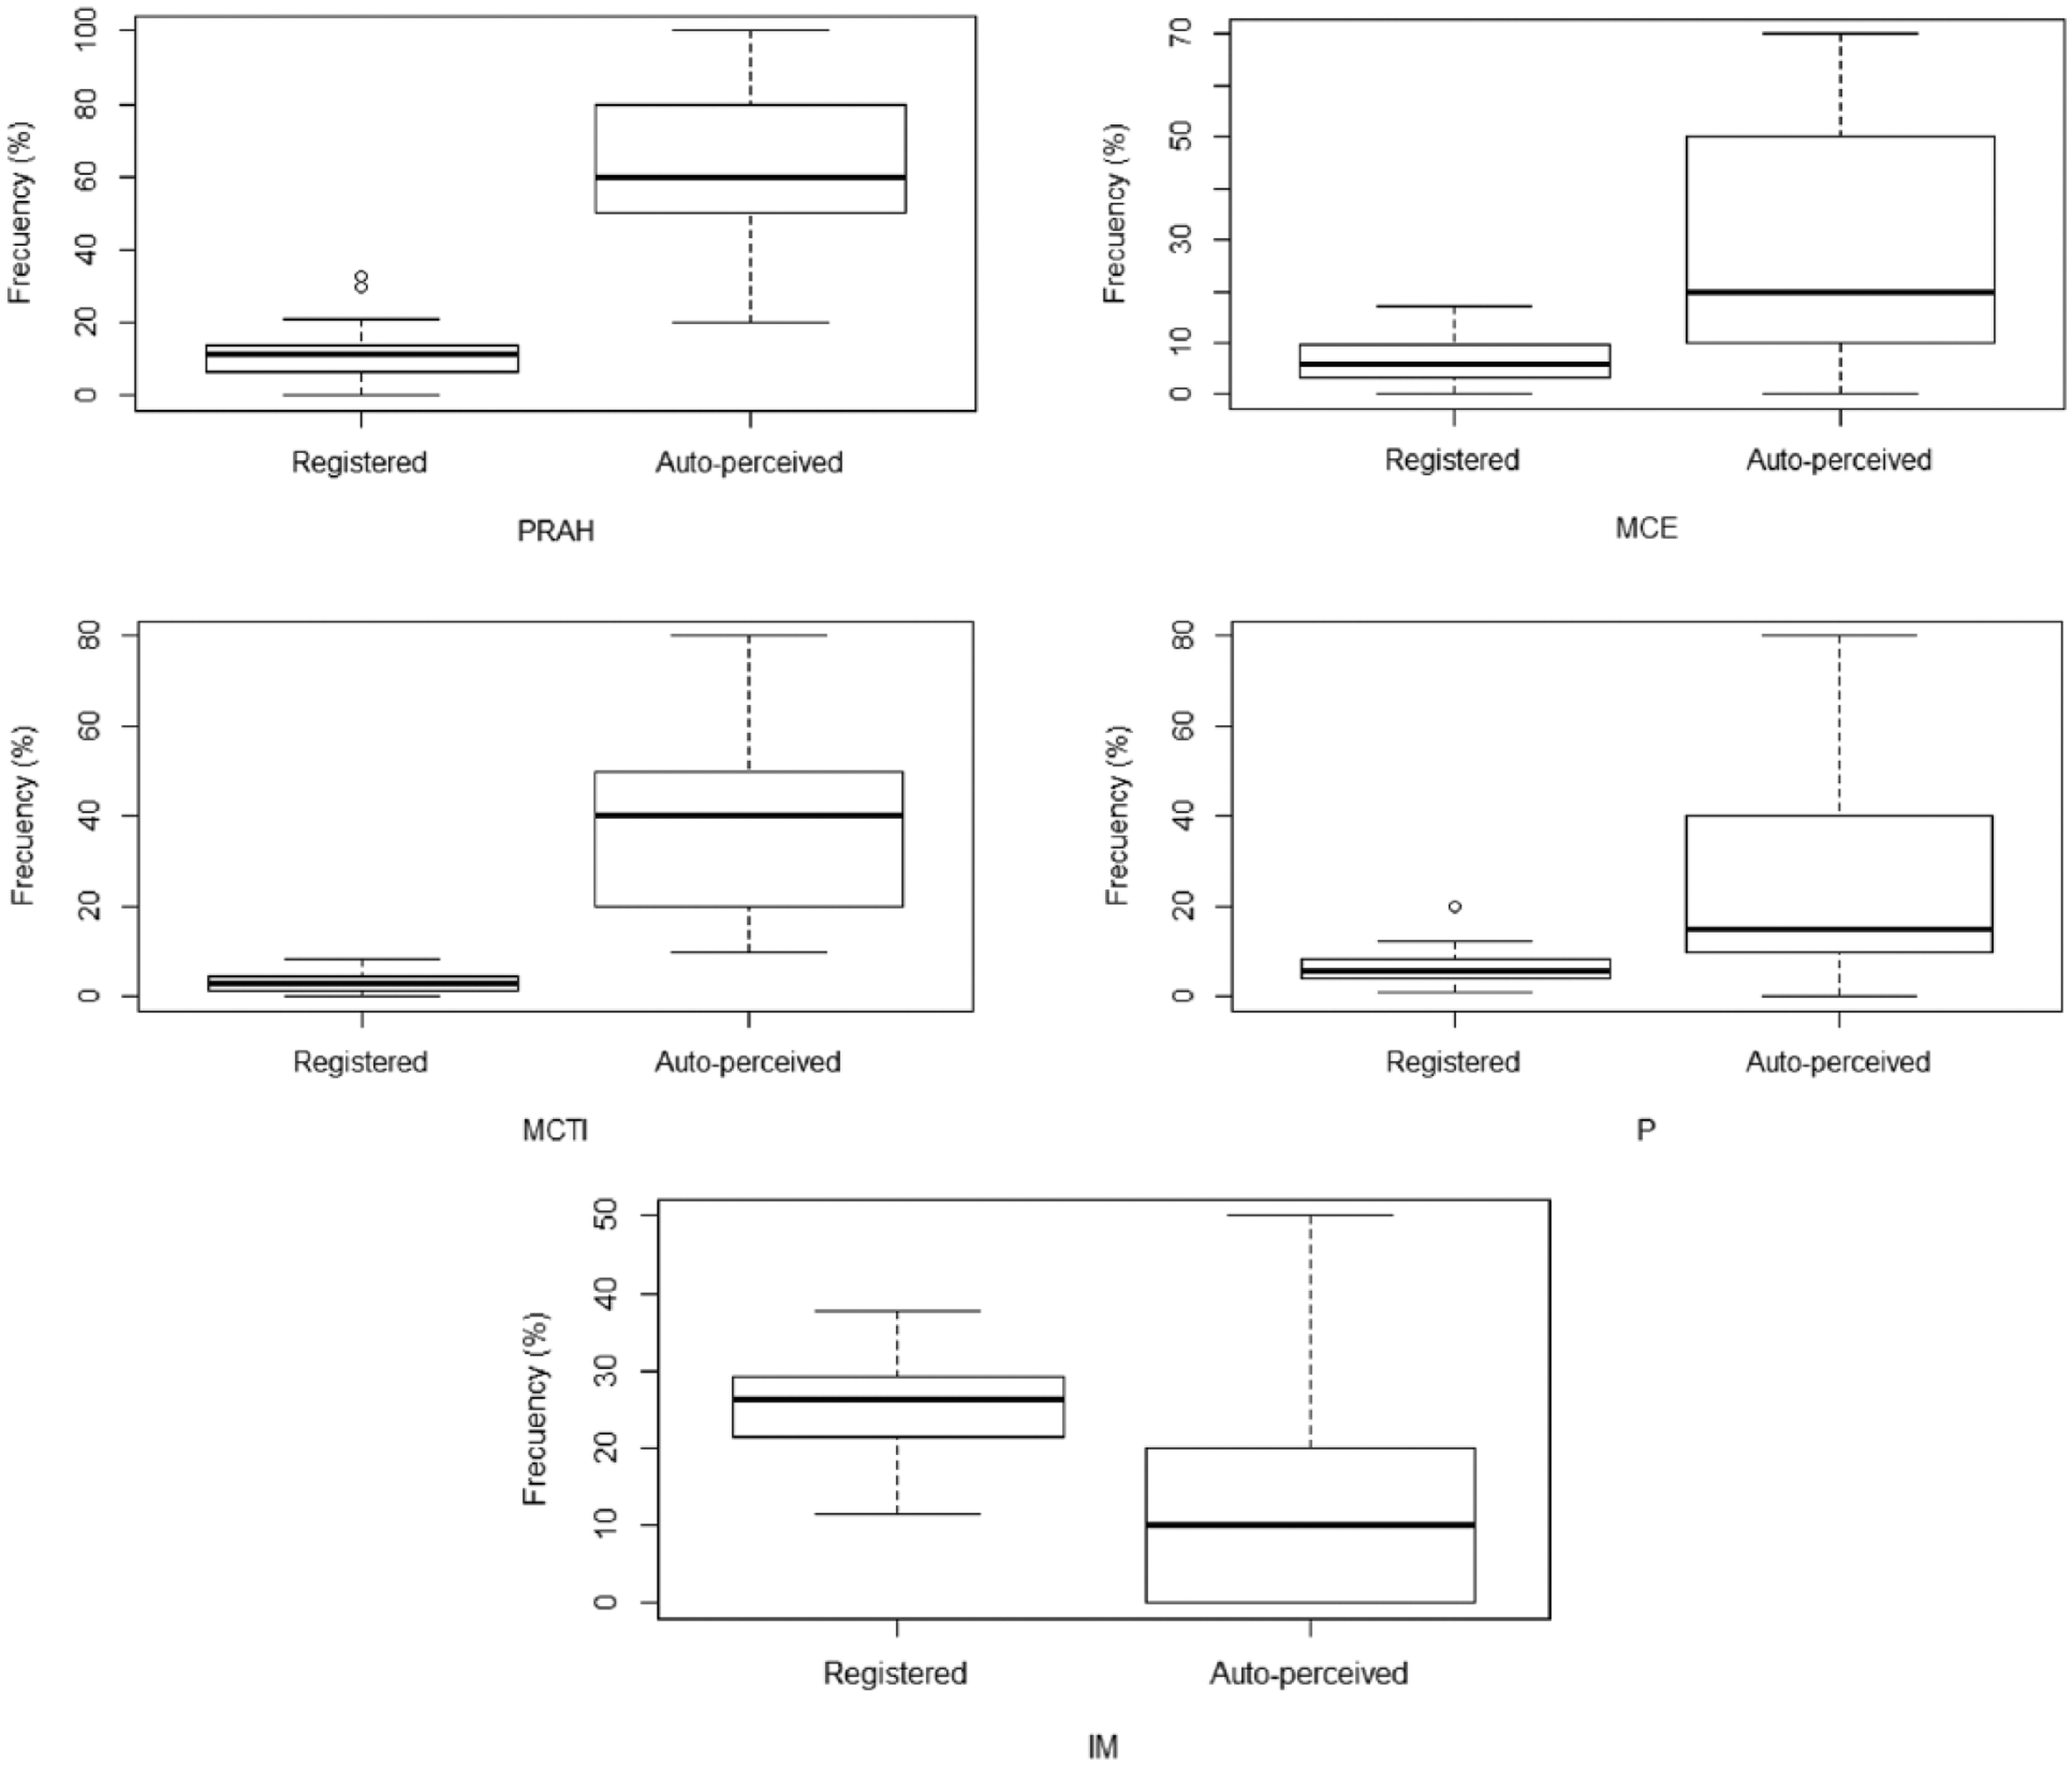
Box plot graphics to compare registered and auto-perceived data for all the behaviors.
Results
The analysis of the 38 official matches produced the following results, which can be seen in Table 2 below, whereby the registered behavior was compared with the perceived behavior through the behavior of the coaches.
Comparisons to analyze differences between registered and auto-perceived for each of the behaviors were performed using Kruskal–Wallis Test. The alternative hypothesis—not equality of medians—was supported at the .05 level, which revealed significant differences for the median values of registered and auto-perceived data at 95% confidence level (Table 2). Box plot representation also confirms that there are significant differences between registered and auto-perceived data for all the analyzed behaviors (Figure 1).
A more detailed analysis of the coaches shows that the behavior they consider the most common is PRAH with a 59.47%, followed by MCTI with a 38.15% (positive behaviors); however, the recorded data show that the most common attitude is the IM (inhibition) with a 25.39%. In addition, all the behaviors are less frequent than the coaches believe, except the IM conduct, which shows a higher frequency in the registered data (Figure 1).
Discussion
The results of this study show significant statistical differences between the registered behavior of the coaches and how they thought they had behaved; that is, the coaches in this study remembered inaccurately what they had said to their players, in a trend similar to the data obtained by Cruz et al., (1987) and Millard, Oldham, and Donovan (2011).
The coaches of this survey believe that their most frequent behaviors are PRAH and MCTI (positive behaviors), a trend similar to that recorded by Serpa (1993), Costa (2003), Vilani (2004), Lopes (2006), Costa and Samulski (2006), and Noce, Teixeira, Calábria, Martin, and Coelho de Souza (2013), who agree that the coaches feel that the behaviors of “Positive Reinforcement” and “Instructional Coaching” are the most common.
The self-evaluation of coaches differs from the data we recorded, as in the study of Serpa (1999), who states that coaches evaluate themselves more favorably in terms of social desirability, adding that coaches tend to consider those behaviors most important in the environment in which they work. However, this finding contradicts the data by Wandzilak, Ansorge, and Potter (1988), who in their study on football point out that coaches were effective in estimating their own behavior, although they also found significant differences between the categories “Encouragement” and “Instruction and Organization,” as the recorded values were higher than the perceived ones.
It is necessary to investigate further the behavior of coaches in various areas (training and competition), as well as other contextual variables (age, gender, competitive level, sport, etc.). This is to determine which variables play a decisive role in explaining changes in the behavior of the coaches and the consequences these have for satisfaction and the desire to stay in the sport of their young athletes.
The coaches of the present study perceive themselves in a positive way, and with a communication style based on reinforcement. A similar trend was found on the sport field by Horne and Carron (1985) and Liukkonen, Salminen, and Telama (1989), and even on the school field, by Antunes, Serpa, and Carita (1998).
The differences between the recorded data and the perceptions that coaches have of their behavior may be due to lack of understanding of their own performance in competitive situations, where, besides the specific performance of the team in that game, other variables such as the performance of the opposing team or even the match referees have to be added. In short, the level of uncertainty faced by the coach in the competition is high; therefore, he must not only analyze and prepare his team to face this but also add the training of his own performance, taking into account emotional, physical, and tactical levels, all of them from a global perspective.
In our opinion, the analysis as a whole of the registered behavior of coach and players, the assessment of their behavior, and the results will contribute to the development of coaches and help optimize the satisfaction of all sports competitors generally.
It would be interesting in future to conduct surveys comparing training and competition situations within a team, as well as their development over a season. This would allow seeing changes in behavior with regard to other relevant variables in the sporting context.
Conclusion
The self-perception of coaches in this study is inaccurate; they reinforce, encourage, give directions, or discipline much less than they think. Conversely, the same coaches ignore mistakes much more often than they recall.
In our opinion, the present study offers an interesting contribution to the scientific literature. There are hardly any studies that compare coaches’ perceptions with their registered behaviors, immediately after games, and explicitly related to the most important action in basketball, the shot. As regards the significance of our research, for coaches, the need to know, and possibly to modify, the style of communication represents a fundamental aspect. It should be an essential part of their training. The present study highlights the need to consider coaches’ perceptions of their behaviors to improve their education as trainers. It is also important to know one’s style of communication and its consequences on youth categories.
Finally, coaches’ behaviors have a direct consequence on the main elements of the basketball training process: teams, players, coaches, and parents. The training received by the players will provide for better intervention and also improve their athletic performance. Therefore, it is necessary that coaches have knowledge of how to approach them and how to modify certain behaviors. The information provided in our study to coaches allows making changes in their behavior. The coach should control his own behaviors during the competition. This is essential in the initial and continued training of coaches and is expected to contribute to increased performance and satisfaction of young athletes, which would result in higher levels of adherence to the sport.
Footnotes
Declaration of Conflicting Interests
The author(s) declared no potential conflicts of interest with respect to the research, authorship, and/or publication of this article.
Funding
The author(s) received no financial support for the research and/or authorship of this article.