
Abstract
Noncognitive characteristics are gaining importance in addressing the persistent challenges facing youth in diverse settings. Measurement invariance of two youth developmental assets, Support and Positive Identity, is evaluated across grade levels and English language learner (ELL) subgroups of Latino students in 6th through 12th grade. Explanatory item response modeling is used to evaluate measurement invariance. The measurement of Latino students’ sense of support and positive identity varies depending on their developmental stage and language status. Students at later grade levels tend to require higher levels of Support to endorse items in the Support measure. There is a nonlinear relation between students’ grade level and item functioning for Positive Identity; students’ transition from middle to high school may influence the way they respond to Positive Identity items. This has implications for the measurement of assets with diverse Latino youth and for Latino youth development.
Introduction
Social-emotional learning, developmental assets, and other so-called noncognitive characteristics are gaining presence in national dialogues addressing the persistent challenges facing youth. These are important components of 21st-century skills (Griffin, McGaw, & Care, 2012). The National Research Council (NRC; 2012) prominently identified noncognitive characteristics (interpersonal and intrapersonal skills) as core developmental characteristics to be successful in life and work. The NRC argued that cognitive, intrapersonal, and interpersonal skills can be taught and learned and contribute to successful adult outcomes. These skills also are found in the Common Core State Standards (Kyllonen, 2012) and include factors that shape school performance (Farrington et al., 2012), college and career readiness and success (Dymnicki, Sambolt, & Kidron, 2013), and more generally, positive youth development and resilience (Benson, Scales, Hamilton, & Sesma, 2006).
There exist many attempts to develop measures of such skills in diverse populations and at different ages or developmental stages, with significant measurement challenges (Griffin et al., 2012; Kyllonen, 2012). As a relatively new arena for measurement, rigorous measurement quality evaluation addressing the validity of score interpretations has been limited. “Validity refers to the degree to which evidence and theory support the interpretations of test scores for proposed uses of tests” (American Educational Research Association [AERA], American Psychological Association [APA], & National Council on Measurement in Education [NCME], 2014, p. 11). In diverse settings, consistent interpretations must be permissible across groups to prevent misuse with marginalized populations and, more generally, with students facing persistent academic challenges. To establish a common interpretation framework in diverse settings, measurement invariance (MI; consistent score quality and meaning) should be confirmed across relevant subgroups. If invariance holds, score differences can be assumed to reflect the differences in the construct being measured rather than irrelevant group differences due to measurement misspecifications (Millsap, 2010) or construct-irrelevant features (Haladyna & Downing, 2004). The investigation of MI is now a standard component of test development for most large-scale tests, particularly those with high stakes (AERA, APA, & NCME, 2014).
There is increasing interest in the assessment of noncognitive characteristics, 21st-century skills, and developmental assets among youth. These measures should be held to the same standards as educational and psychological tests if we are to defend their use to inform practice and policy. Developers of such measures must provide evidence of invariance across relevant subgroups, including race and ethnicity, language status, gender identity, and developmental stages—those groups for which the assessments are intended to be used (Millsap, 2010; Widaman, Ferrer, & Conger, 2010). The point is to identify subgroups that may have characteristics that potentially influence responses in construct-irrelevant ways. This is consistent with the standard approach to validation, based on a well-articulated interpretation and use argument (Kane, 2013).
In this article, MI is evaluated in a relatively new and flexible approach, through explanatory item response models (EIRMs). The study employs a measure of developmental assets administered to a large sample of middle and high schools’ Latino students with different English language proficiencies. This provides a rich context for the evaluation of MI and the exposition of these principles in the growing arena of social-emotional measurement.
The purpose of this study is to evaluate MI in measures of Support and Positive Identity. To present a coherent model of the process, the contexts of research in Latino youth development is presented in terms of the role of culture and language status; a review of positive youth development and developmental assets places the target measures in perspective; the evaluation of MI is reviewed; EIRMs to support this work are described; the methods and results of the study are summarized; and implications for measuring Support and Positive Identity are discussed. This serves two purposes, the study of MI of measures of Support and Positive Identity and the exposition of the evaluation of MI for measures of social-emotional characteristics for instructional purposes. In addition, as we have discovered, the evaluation of MI across developmental stages provides us with a deeper look into the developmental nature of developmental assets.
Latinos and Youth Development
U.S. Latinos are not only the largest ethnic minority group in the United States, 17% of the U.S. population in 2014, they are disproportionately young with 36% younger than the age of 20 (U.S. Census Bureau, 2014). Latino youth are more likely to face higher levels of developmental challenges including high poverty levels, residing in disadvantaged neighborhoods, attending low-quality schools, involvement in risky behaviors, and being raised by parents with low academic attainment and limited English skills (Eamon & Mulder, 2005; Kuperminc, Wilkins, Roche, & Alvarez-Jimenez, 2009). Latinos are diverse, based on generational status, country of origin, English language proficiency, age of immigration, residency status, and race (A. K. Fuligni & Perreira, 2009). Measures that assess development among Latino youth must consider the broad diversity of Latino youth populations to yield meaningful interpretations (Knight, Roosa, Calderón-Tena, & Gonzales, 2009). In addition, Latinos have been underrepresented and not equitably treated in developmental research, where studies that included Latino youth were deficit oriented and often unguided by a theoretical framework (Rodriguez & Morrobel, 2004). The need to address positive Latino youth development remains.
One of the core characteristics of Latino youth relevant to developmental considerations, particularly for school-age youth, is language and English language status (Rodriguez & Morrobel, 2004). In this study, the psychosocial role that English language acquisition plays among Latino youth is examined regarding its potential influence on the measurement of developmental assets. This recognizes an important characteristic contributing to the diversity of Latino youth, and one that may influence measurement in construct-irrelevant ways. English language fluency plays an integral part in the identity formation of Latino youth. Language skills determine how effectively they can interact within the spheres of English-speaking peers, teachers, and communities. Similarly, the amount of time in which Latino youth have contact with mainstream American culture affects how Latino youth develop identity and experience support in multiple contexts (Fuligni & Perreira, 2009). This multicontext influence on Latino youth is also recognized as a source of cultural resilience, as youth traverse and manage the multilingual and multicultural spheres of family, peers, teachers and school, and community (Taylor & Want, 2000).
The Role of Language
Second language acquisition has traditionally been studied in terms of cognitive development and educational contexts, but to a lesser extent regarding how it relates to social-emotional development. Language development plays an integral part in Latino youth development in the United States. In 2012, 74% of the Latino population reported to speak Spanish at home (U.S. Census Bureau, 2014). Maintaining a native language has been associated with retention of family values and cultural traditions as well as a protective factor against involvement in risky behaviors (i.e., an asset) among Latino youth (Kuperminc et al., 2009; Perez, Espinoza, Ramos, Coronado, & Cortes, 2009).
Limited English fluency has been associated with developmental risk factors including low socioeconomic status, residing in disadvantaged neighborhoods, low educational attainment by parents, and a perceived sense of stigmatization for not speaking English (Dawson & Williams, 2008; Garcia & Scribner, 2009). As Latino youth become more fluent in English, they also begin to interact more with the mainstream American culture and therefore be influenced by it (South, Crowder, & Chavez, 2005). Similarly, family responsibilities often increase for Latino youth as they begin to serve as mediators between their home culture and the surrounding communities when they act as family interpreters and translators (Morales, & Hanson, 2005; Weisskirch, 2005). The context facing recent immigrants is also challenging as it takes on average between 3 and 5 years to develop English-speaking fluency (Hakuta, Butler, & Witt, 2000). This makes English language status relevant in the study of Latino youth development and thus important in the evaluation of MI of developmental asset measures. However, language is just one component of culture and identity.
Latino Cultural Context
Not only are Latino youth underrepresented in developmental research, but also researchers who study Latino youth often treat Latinos as a homogeneous group, employ exploratory methods without theoretical grounding, and are largely deficit oriented (Rodriguez & Morrobel, 2004). A deficit orientation puts an emphasis on negative attributes and focuses on interventions addressing developmental risk factors. It is from the imbalance of assets and deficits that many of the problems faced by Latino youths originate (Peck, Roeser, Zarrett, & Eccles, 2008; Rodriguez, & Morrobel, 2004). A call to refocus the orientation of Latino youth development research to a positive youth development approach has been raised by researchers (Kuperminc et al., 2009; Rodriguez, Morrobel, & Villarruel, 2003; Sesma, & Roehlkepartain, 2003). A positive youth development approach (Benson et al., 2006; Lerner, Almerigi, Theokas, & Lerner, 2005) aims to identify more appropriate environments where Latino youth can embrace their qualities and have a greater opportunity to enhance their abilities to thrive and succeed (Rodriguez et al., 2003).
Two developmental assets are of particular interest, Support and Positive Identity, because of the critical role they play in Latino youth development. Also, both constructs have strong developmental characteristics. Support is an external (interpersonal) asset as it characterizes engagement with others, whereas positive identity is an internal (intrapersonal) asset as it is manifested within the individual (Benson et al., 2006).
Support
The benefits of support received from family, community, and school among Latino youth have been well documented. Parental support has been associated with academic educational outcomes (Eamon & Mulder, 2005; Green, Rhodes, Hirsch, Suarez-Orozco, & Camic, 2008; Hill & Tyson, 2009; Ong, Phinney, & Dennis, 2006), as a protective factor against involvement in risky behaviors (Costello, Swendsen, Rose, & Dierker, 2008; Perez et al., 2009) and overall adjustment (Alvan, Belgrave, & Zea, 1996; Antrop-Gonzales, Velez, & Garrett, 2008). Similar benefits have been found when experiencing a supporting environment in the community (Faircloth, & Hamm, 2005; Urban, Lewin-Bizan, & Lerner, 2009), school (Alfaro, Umaña-Taylor, & Bamaca, 2006), and peers and other unrelated adults (Scales, Benson, & Mannes, 2006). However, research on the dynamics of Latino youth perceptions of support across developmental stages, particularly during adolescence, has been scarce (Grau, Azmitia, & Quattlebaum, 2009). There is some evidence that family support, community support, and school climate affect academic performance differently for 6th-, 9th-, and 12th-grade Mexican American students, indicating a potential interaction with developmental stage (Cabrera, Rodriguez, Palma, & Stanke, 2014). Support plays an important role in Latino youth development, but little is known about the role development plays in the perception of support.
Positive Identity
Identity development is a core milestone during adolescence (Erikson, 1968). For Latino youth, identity development must be considered with respect to ethnic identity development and consideration to the cultural and environmental contexts that influence identity formation. Ethnic identity has been considered part of the overall concept of personal identity (Phinney, 1996) and, for Latino youth, it is regarded with more centrality (Quintana & Scull, 2009). Identity development is complex. U.S. Latino youth must navigate between their culture of origin and the dominant or new culture where they reside as they work to form their identity (Quintana & Scull, 2009). At the same time, ethnic identity is highly influenced by language skills (often, unbalanced bilingual skills), age, interpersonal relationships with parents and peers (Phinney, Romero, Nava, & Huang, 2001; Quintana & Scull, 2009), and the broader society where youth develop their identity in the context of stigmatization and numerous adversities (Quintana & Scull, 2009), not to mention racism and anti-immigrant sentiments.
Positive ethnic identity has been associated with factors of well-being in Latino youth, including self-esteem (Umaña-Taylor, Gonzales-Backen, & Guimond, 2009), academic achievement (A. J. Fuligni, Witkow, & Garcia, 2005; Ong et al., 2006), and positive attitudes toward one’s social/cultural group and other groups (Whitehead, Ainsworth, Wittig, & Gadino, 2009). However, Latino youth are more likely to live in disadvantaged neighborhoods with greater exposure to poverty, gangs, and crime, with limited support for developing a positive identity (Santrock, 2011). Like support, the role development plays in one’s sense of positive identity is less understood, compared with the role positive identity plays in youth development.
Evaluation of MI
MI can be examined in many different ways. The challenge is to identify potential sources of measurement interference or differential functioning and hopefully address them. In this context, MI is based on evidence that a measure can be consistently interpreted across relevant subgroups, that there is no distortion in scores that is construct irrelevant and interferes with score interpretation. Score distortion can be caused by construct-irrelevant responses to items in a measure or test, including person characteristics that are associated with experiences or opportunities to learn (which may result in differential item functioning [DIF]; see, for example, Albano & Rodriguez, 2013), or shifts in item performance over time possibly due to changes in local culture or demographics, changes in curriculum or teaching methods, or major local or world tragedies or relevant events (which may result in item parameter drift [IPD]; Goldstein, 1983).
MI analysis is a class of methods appropriate for assessing invariance, which addresses the question of whether the instrument is measuring the same trait across all subgroups in a population or over measurement conditions. MI analysis is often implemented at the scale level via factor analytic methods (e.g., multigroup confirmatory factor analysis). Although a multigroup confirmatory factor analysis of subgroups may reveal equivalent factorial structures, item-level distortions can still be present (Zumbo, & Koh, 2005). Therefore, it is essential to conduct item-level analyses for evaluating item-level invariance among subgroups and to identify items that may affect score interpretation (Zumbo, 2007). In the context of Latino youth development with diverse Latino communities in terms of language status, we face multiple potential sources of measurement inconsistency, including differences in language status (DIF based on ELL status) and differences in developmental stages (IPD based on grade in school).
The IPD (Goldstein, 1983) is one approach to detecting measurement inconsistency at the item level. This study demonstrates IPD as an item-level method for investigating MI of youth development measures with a large Latino student sample, given English language learner (ELL) status, as currently receiving ELL services, received but exited ELL services, or never received ELL services, and grade levels as an indicator of developmental stages. EIRM (De Boeck & Wilson, 2004) was used to define various IPD models for detecting item-functioning variance as a result of ELL status and grade level. The findings of the study are discussed regarding invariance of youth development measures and possible implications for the substantive study of youth development itself.
Consistent score interpretation is a potential challenge given the nature of development and changes in response patterns to items in measures of youth characteristics. In standard measurement literature, violations of MI are thought of as construct irrelevant. As a concrete example, consider the measurement of school violence as perceived by students. We may measure perceptions of school violence through a number of items addressing various aspects of direct, indirect, physical, and relational violent behavior and incidents occurring in schools. Over time, because of the increasing level of attention to high-profile weapon use in a few cases across the United States and the dominance of zero-tolerance school policies, an item about the presence of weapons in school may function differently over time (i.e., IPD). As students are exposed to extreme examples of weapon use in schools, minor weapon infractions (e.g., carrying pocket knives or box cutters, etc.) appear to be less important or relevant or severe. If responses to the items in a measure of school violence should be a function of perceived school violence (the trait being measured), then we should be able to predict an individual’s responses to each item given his or her overall level of perceived school violence. Technically speaking, once we condition on overall level of perceived school violence, we might find that the item about the presence of weapons in schools functions differently over time. Even under the same level of perceived school violence, students would be less likely to indicate that the presence of weapons in schools is a problem. If the presence of weapons is an important indicator of school violence, and this aspect shifts in its functioning over time, the construct definition of school violence is changing, whether we change our interpretation of the scores or not—and unless we assess the presence of IPD, we have no reason to consider changes in score interpretation.
Goldstein (1983) introduced IPD as a way to measure changes over time in academic achievement exams. Item response theory (IRT) models are commonly used to investigate IPD under various contexts. An example includes a linear drift model of item location parameters (a measure of item difficulty) using a time-dependent item response model, where researchers argued that IPD can occur because of changes in curricular emphasis and be described as a function of time, that time-dependent item response models can describe data to maintain scales over long periods of assessment reporting (Bock, Muraki, & Pfeiffenberger, 1988).
There are many examples in the literature of IPD analyses. Researchers have investigated such tests as the Armed Services Vocational Aptitude Battery (ASVAB) and found little evidence of IPD, perhaps because aptitude is less variable than achievement over time (Chan, Drasgow, & Sawin, 1999). In an examination of measures of information literacy and global issues, items on the information literacy measure showed a greater magnitude of IPD, possibly resulting from rapid changes in the field (DeMars, 2004). In a recent examination of IPD in a measure of school climate, a few items became easier to endorse over time conditioned on overall school climate, suggesting that students may have become desensitized on some issues related to school climate as time passed, potentially changing the interpretation of school climate (Albano & Rodriguez, 2012).
From the body of research on IPD and exploratory studies investigating sources of IPD, we find potentially useful results. First, the construct being measured actually may change over time. Changes in the construct can indicate unintentional shifts in content over time (as items in a measure are replaced, reworded, or eliminated). Similarly, the construct as perceived by an individual may change due to real changes in cognitive abilities or social/emotional development. In addition, a construct as generally understood and defined by relevant populations may change over time because of the impact of individual-life or world events.
Assessing MI
In this study, MI is evaluated using EIRM. EIRM is a special case of IRT in the context of generalized linear mixed models (GLMMs) where it is possible to specify between-group differences in the latent constructs being measured (De Boeck & Wilson, 2004). EIRM extends the Rasch (1960) model, which describes the probability of responding in a particular way to an item as a function of the difference between the ability or trait level of person j and the location of item i on the trait continuum (commonly called item difficulty for achievement test items). This EIRM extension of the model can be written as a GLMM. The notation for this is a modified version of the hierarchical generalized linear modeling framework (Kamata, 2001). The Level-1 portion of the Rasch model, the item response level, can be written as a logistic regression model in terms of the log-odds of a correct response:
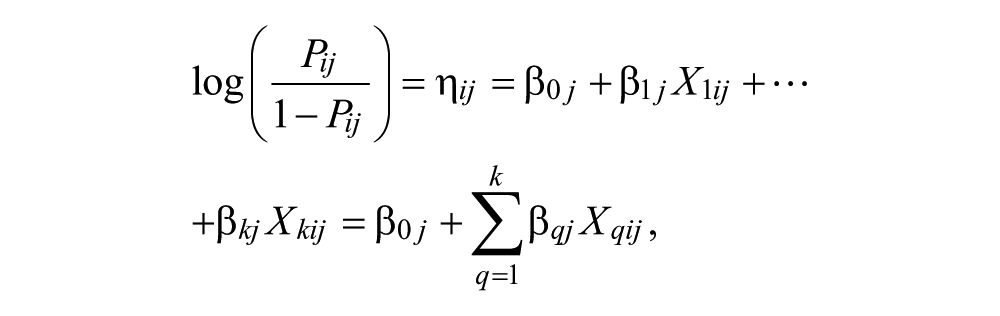
where η ij is the log-odds (probability of correct response divided by probability of incorrect response) of person j endorsing the dichotomous item i; β0j is an intercept term and β1j through β kj are coefficients associated with indicators X1ij through Xkij that indicate items. The indicators X qij represent the qth dummy variable for person j, and are coded as negative one when q = i and zero when q ≠ i. Because indicator coding uses negative one and zero, the item parameters can be interpreted as item location, the trait level associated with a 50% chance of endorsing the item. Level 2 of the model, the person-level, is
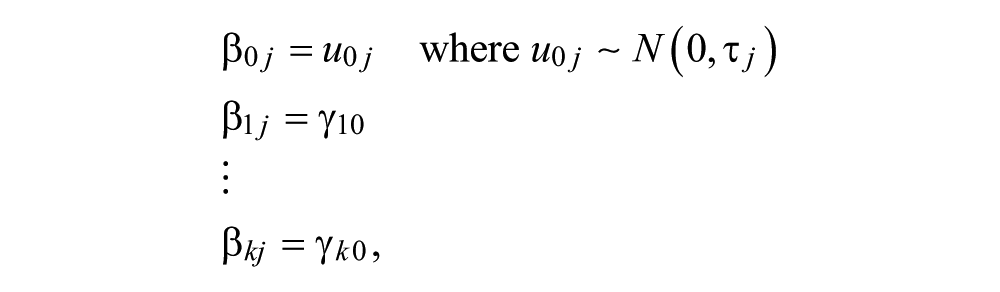
where the intercept term, u0j, is a random effect for persons. Coefficients β1j through β kj are the fixed item locations (difficulties) γ10 through γk0. Note that there is no fixed effect, γ00, included in the intercept term because the model does not consider a reference item when estimating the remaining items. When Level 1 and Level 2 are combined, the log-odds model is then

Because the indicator variables are coded as negative one when the response is associated with a particular item and zeros for all other items, the linear portion of the model can be simplified to η ij = u0j − γq0, the difference between the person effect and the item location; another representation of the Rasch model. The Rasch model assumes that items possess the characteristic of local independence, meaning that after taking into account the parameters of the items and the persons, the responses to items are independent of one another. This implies that a single trait is responsible for each item response. In addition, MI is essential for ensuring generalizability across populations and test occasions (Rupp & Zumbo, 2006), supporting score interpretation and use; when MI does not hold, something other than the intended single trait is responsible for item responses.
EIRM and Study Design
As described earlier, we evaluated the role of two student characteristics, ELL status conceptualized as a potential source of DIF and grade level conceptualized as a potential source of parameter drift across developmental stages. This design employed student characteristics as features of the measurement model.
This study was conducted based on data gathered in an urban district in the state of Texas. Latino students who participated in the assessment are included in this secondary data analysis, including students in 6th through 12th grade. In addition, students were classified as (a) receiving ELL services, (b) received but exited ELL services, or (c) never received and/or never were eligible for ELL services. To receive ELL services, students report a home language other than English, are evaluated to determine their level of English proficiency, and receive a Broad English Ability score of 4 or lower on the Woodcock–Muñoz Language Survey–Revised. Latino students who have exited ELL services have satisfied their ELL learning goals, performed at the advanced level (or lower with additional evidence of proficiency) on the Oregon English Language Proficiency Assessment, and have the ability to participate meaningfully in the general education program. Latino students who are not ELL students are those for whom English is their primary language.
The full explanatory model, including ELL status (two dummy variables to capture the three groups), grade level, and their interaction, is as follows:

In this model, u0j is the trait level for person j; γq0 is the location for item q (1 to k) for a student belonging to the non-ELL group (the reference group) in sixth grade (Grade 6 is coded as zero, Grade 7 as 1, Grade 8 as 2, etc.); γq1 is the item location difference for exited-ELL students; γq2 is the item location difference for ELL students; γq3 is the linear deviation in item location across grades for non-ELL students; γq4 is the linear deviation difference in item location across grades for exited-ELL students; and γq5 is the linear deviation difference in item location across grades for ELL students.
Variations in EIRM Specification
The EIRM, as a form of a GLMM, allows for a more flexible specification of the student characteristics in the model. As described above, ELL status is a factor (a categorical variable as in an ANOVA) and grade is a continuous linear predictor (a continuous variable as in regression). In the EIRM, grade is evaluated to the extent that its effect is linear across Grades 6 to 12, conditioned on other variables in the model. In other words, holding overall level of the trait constant (e.g., level of perceived Support), it evaluates the extent to which items shift in location across grades in a linear manner. This is referred to as the multigroup linear IPD model, where parameter drift may occur over grade or conceptually, developmental stages.
Alternatively, grade can be specified as a categorical variable, where the effect of each grade on item location is estimated independently. This is referred to here as the Grade × Group factor model, where ELL status and grade are both considered factors (as in ANOVA) with interaction terms between each ELL status group and each grade level. The main advantage of the EIRM compared with other popular methods for testing MI (e.g., multigroup confirmatory factor analysis) is that the EIRM allows for the evaluation of IPD over grade levels not only linearly but also independently for each grade level (i.e., nonlinear drift).
Method
Measures
A questionnaire measuring developmental assets was administered to students in 6th through 12th grade in an English form and a bilingual form presenting English and Spanish versions on opposite pages. Students receiving ELL services were given the bilingual form and other students were given the option of which form to use. The Spanish version of the questions on the bilingual form were initially translated by one of the authors of this article and reviewed by a second author. The bilingual form was also reviewed by school personnel in the participating district with Spanish language backgrounds and a small number of issues were resolved through consensus. In part, the use of a bilingual form (presenting English and Spanish on opposite pages) was intended to avoid the influence of inappropriate translation. The translating authors and the school personnel reviewing these forms were of Mexican descent, similar to the vast majority of Latino students in the district.
The questionnaire included the Developmental Assets Profile (DAP; Search Institute, 2005), which measures eight assets based on students’ experiences at the self, family, peer, school, and community levels. Data from two assets of interest, Positive Identity and Support, were used for the analysis. The Positive Identity measure consists of six rating-scale items, including issues related to feeling good about one’s self and future, dealing with disappointment, and having a sense of purpose. The Support measure consists of seven rating-scale items, including issues related to having parents who are encouraging and available to talk, having others in the community who are supportive, and being in a school that is supportive and encouraging.
Although the original items are on a 4-point scale, they were dichotomized to reduce the complexity of linear drift analysis in the EIRM, for illustration purposes only. Options “not at all or rarely” and “somewhat or sometimes” were coded as 0, and “very often” and “extremely or almost always” were coded as 1. In this way, item responses were then on a scale indicating more (1) or less (0) of the construct, as represented by each item. However, this is not recommended for general practice, but is indicated to simply facilitate ease of analysis and interpretation for our purposes here. Using the 4-point rating scale in the factor model evaluating nonlinear MI, for example, would produce more than 500 coefficients for the Support measure alone (three threshold coefficients are needed to describe the locations of the 4 rating-scale points, across 168 coefficients from the factor model as described below). This would be cumbersome for the interpretation purposes here.
To use the EIRM framework in estimating person and item parameters (as in the Rasch model), the measures should meet the general assumptions of IRT, such as unidimensionality. Confirmatory factor analysis (CFA) was conducted in Mplus 6 (Muthén & Muthén, 2010) to confirm the unidimensional latent structure of the Positive Identity and Support measures. One challenge is that if MI does not hold, the CFA will indicate problems regarding the fit of a unidimensional model. Goodness-of-fit criteria, including root mean square error of approximation (RMSEA), Tucker–Lewis index (TLI), and comparative fit index (CFI), were used to evaluate model-data fit of the unidimensional CFA model for the two measures. CFI and TLI are incremental fit indices that range between 0.0 and 1.0 with values closer to 1.0 indicating good fit. RMSEA is an absolute fit index that is independent of sample size and thus performs well as an indicator of practical fit. For CFA models, Hu and Bentler (1999) suggested that for categorical data, RMSEA < .06, TLI > .90, and CFI > .90 indicate good fit. The CFA results indicated that Positive Identity (CFI = .94, TLI = .90, RMSEA = .095) and Support (CFI = .97, TLI = .95, RMSEA = .066) had acceptable levels of model-data fit on at least one criterion each; however, the RMSEA results were problematic. This is mostly an indicator that the simple unidimensional Rasch model may not be an appropriate approach to model item responses—which is consistent with the findings of measurement inconsistency reported below. The correlation between the two assets was .65, indicating a moderate relation between the two constructs (42% shared variance).
Sample Characteristics
As the focus of interest, the responses from 24,322 Latino students were analyzed. The counts of Latino students by grade and ELL status are reported in Table 1. The sample consisted of 36% ELL students, 53% exited-ELL students, and 11% non-ELL students. Approximately 50% were female, 5.9% were receiving special education services, 87.5% were identified by the district with a low socioeconomic status indicator, and 89% participated in free or reduced lunch.
Counts and Percentages of Latino Students by Grade Level and ELL Status.

Note. ELL = English language learner.
Research Questions
We investigated one primary research question regarding MI: Does item functioning vary by grade, English language proficiency (language status), or their interaction? If drift does occur across grades as a function of ELL status, the interactions will be significant, requiring consideration of parameter variability across grade by ELL status. Other possibilities include the presence of drift that is constant across ELL status and the presence of DIF between ELL status groups. We simultaneously investigated MI as a function of both DIF by language status and IPD across grade level.
This led to substantive issues regarding the role of language status and developmental stage in the measurement of these two developmental assets. Important questions are addressed in the “Discussion” section regarding the impact of measurement variance on score interpretation for different subgroups of Latino students and regarding the developmental aspects of the measures themselves.
Data Analysis
In an exploratory study preceding this analysis (Stanke, Palma, Bulut, & Rodriguez, 2013), four models were fit to the data for Positive Identity and Support: (a) the Rasch model assuming MI, (b) a model to detect IPD treating ELL groups as invariant (no DIF), (c) a model to detect multiple-group IPD allowing for separate linear drift parameters for the three ELL groups (DIF × IPD), and (d) a model treating grade as a factor that interacts with ELL status that allows parameter drift across grades to be nonlinear and differ by subgroup (Grade × Group factor model). The models were fit to the Positive Identity and Support measures using the glmer function from the package lme4 (Bates, Maechler, & Bolker, 2012) in R (R Core Team, 2012). The final model, the Grade × Group factor model, appeared to fit best on a number of dimensions and resulted in item parameter estimates for each grade-by-group combination (Stanke et al., 2013). In any case, it was clear that MI was not a tenable assumption.
Based on these preliminary results, consistency of score interpretation of Positive Identity and Support is in part a function of Latino subgroup defined by language status, and development may not be represented on these two constructs in ways that are invariant; the measurement of Positive Identity and Support may vary in some items as a function of both grade level and language status. The results of the multiple-group linear IPD model are briefly presented and the linearity of the IPD is evaluated based on a graphical review of the Grade × Group factor model. The R code for estimating the Rasch and the multiple-group linear IPD models are provided in Appendix A.
Results
To begin with, the Rasch model item locations and item fit statistics for Support and Positive Identity are reported in Tables 2 and 3. In the EIRM, the person parameter is normally distributed with a mean of zero; items are then located relative to the scale defined by person location. The infit and outfit fit indices indicate the extent to which the data matched the Rasch model (Bond & Fox, 2001), where values between 0.75 and 1.3 indicate adequate item fit (Smith, Schumacker, & Bush, 1998). Based on these suggested cutoff values, there is lack of adequate item fit for some items in both Support and Positive Identity, signaling that item difficulties may not be similar across ELL status and grade level. In the subsequent models, the items with adequate item fit were considered as anchor items in testing MI for Support and Positive Identity.
Positive Identity Rasch Model Item Locations (Parameter Estimates), Standard Errors, and Item Fit Statistics.
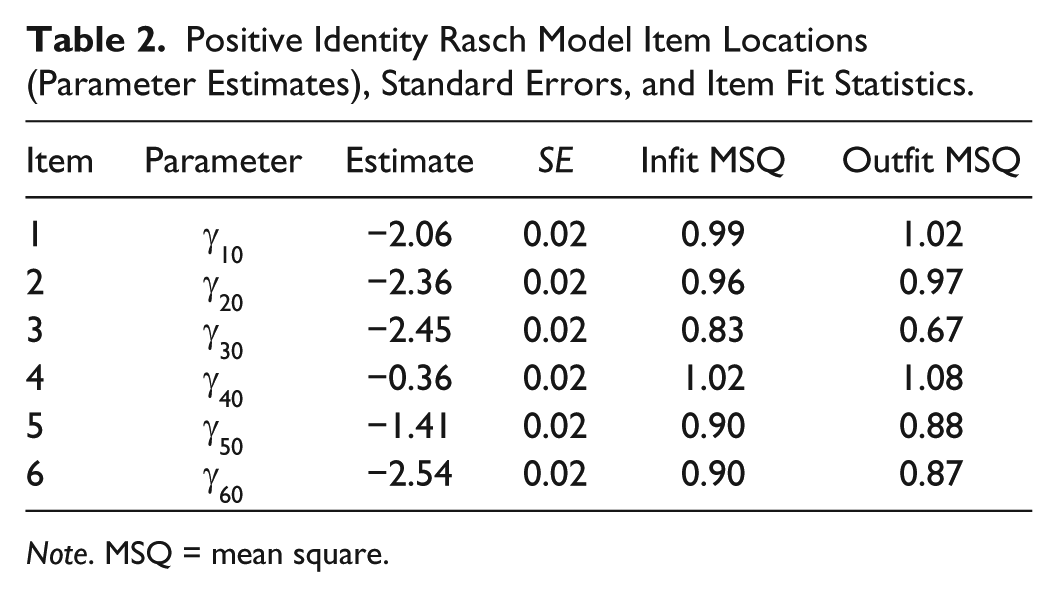
Note. MSQ = mean square.
Support Rasch Model Item Locations (Parameter Estimates), Standard Errors, and Item Fit Statistics.

Note. MSQ = mean square.
It is challenging to review a large number of coefficients; however, the results for the multiple-group linear IPD model are presented as the basis for evaluating MI. For Positive Identity, there are the person parameters (person trait level) and six items each with six coefficients; similarly for Support, there are seven items each with six coefficients. All coefficients are in the logit metric, due to the Rasch parameterization of the model.
Table 4 contains the 36-item coefficients for the multiple-group linear IPD model for the Positive Identity measure. Similarly, Table 5 contains the 42-item coefficients for the multiple-group linear IPD model for the Support measure. A Wald test assessed the statistical significance of each parameter being different from zero. The item locations, γq0 through γq2, were not tested relative to a null hypothesis; their locations are a function of the trait level required to be likely to endorse an item (whether that is different than zero is not of interest).
Positive Identity Group and Linear Drift Model Item Locations (Parameter Estimates) and Standard Errors.
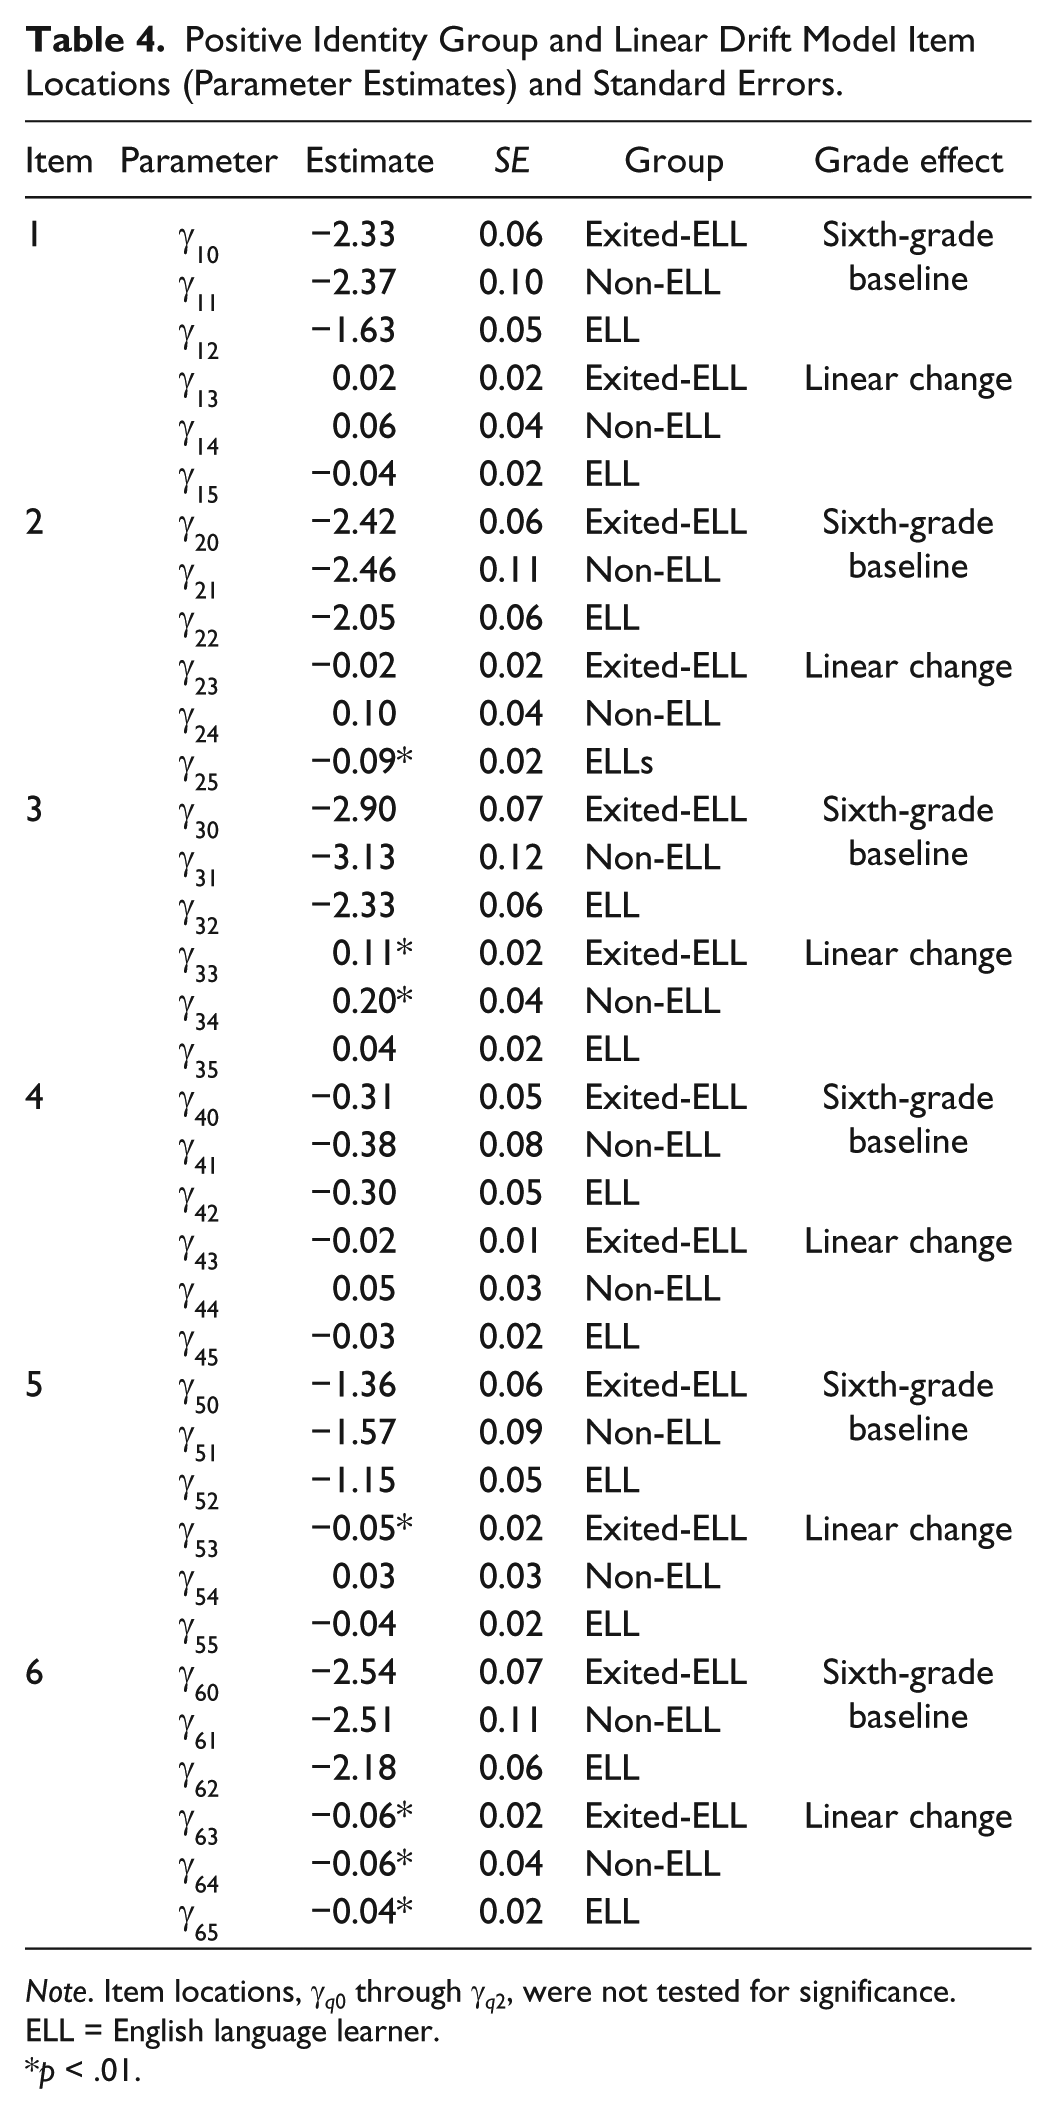
Note. Item locations, γq0 through γq2, were not tested for significance. ELL = English language learner.
p < .01.
Support Group and Linear Drift Model Item Locations (Parameter Estimates) and Standard Errors.

Note. Item locations, γq0 through γq2, were not tested for significance. ELL = English language learner.
p < .01.
Positive Identity Multiple-Group Linear Drift
Regarding the Positive Identity measure, 5 of the 18 drift parameters from the multiple-groups IPD model, γq3 through γq5, had p values less than .01; 3 of 6 drift parameters for exited-ELL students, 1 of 6 for ELL students, and 1 of 6 for non-ELL (Table 4). These coefficients represent linear change in item locations across grades. If MI held, they would be zero. As only five coefficients were significant, the MI is not overwhelming—These effects will be reviewed item by item below. However, as will be noted below, important differences were observed among Latino ELL subgroups, indicating the presence of DIF.
Support Multiple-Group Linear Drift
Regarding the Support measure, 18 of the 21 drift parameters from the multiple-groups IPD model had p values less than .01. The significant drift estimates on the Support measure showed an interesting phenomenon: as grade increased, the likelihood of endorsing an item became more difficult—Positive coefficients indicate that endorsement requires higher trait levels across grade level. For five of the seven items, this effect was significant for all three ELL groups. This phenomenon that occurs to some extent across all seven items on the Support measure suggests that when item location parameters are treated as measurement invariant, 12th-grade students’ perceived level of Support is being underestimated and 6th-grade students’ perceived level of Support is being overestimated. In addition, DIF was observed as a function of Latino ELL subgroup.
To investigate the extent to which IPD is linear, the parameters for each item were plotted across grade level and a visual analysis of the linear drift parameters was compared with the grade-by-group factor model. Recall that the factor model employs dummy variables for each grade, considering grade to be categorical, and thus involves a much larger number of parameters. Because there are eight main effects (intercept, two ELL status dummy variables for the three ELL groups, and five grade dummy variables for the six grades) and 15 interaction effects (3 × 5) for each item, the number of coefficients is too large to report in tables (138 for Positive Identity and 161 for Support). To facilitate interpretation of the results, graphic displays are presented for each item, illustrating the linear and factor model results. Figures 1 to 6 display the item parameters for Positive Identity; Figures 7 to 13 display the item parameters for Support.

Display of the parameter estimates for the Positive Identity item regarding sense of control of one’s life and future, by grade level for the linear IPD and Grade × Group factor models.

Display of the parameter estimates for the Positive Identity item regarding feeling good about one’s self, by grade level for the linear IPD and Grade × Group factor models.
Display of the parameter estimates for the Positive Identity item regarding feeling good about one’s future, by grade level for the linear IPD and Grade × Group factor models.
Display of the parameter estimates for the Positive Identity item regarding dealing appropriately with disappointment, by grade level for the linear IPD and Grade × Group factor models.

Display of the parameter estimates for the Positive Identity item regarding dealing with life’s challenges, by grade level for the linear IPD and Grade × Group factor models.

Display of the parameter estimates for the Positive Identity item regarding having purpose in life, by grade level for the linear IPD and Grade × Group factor models.

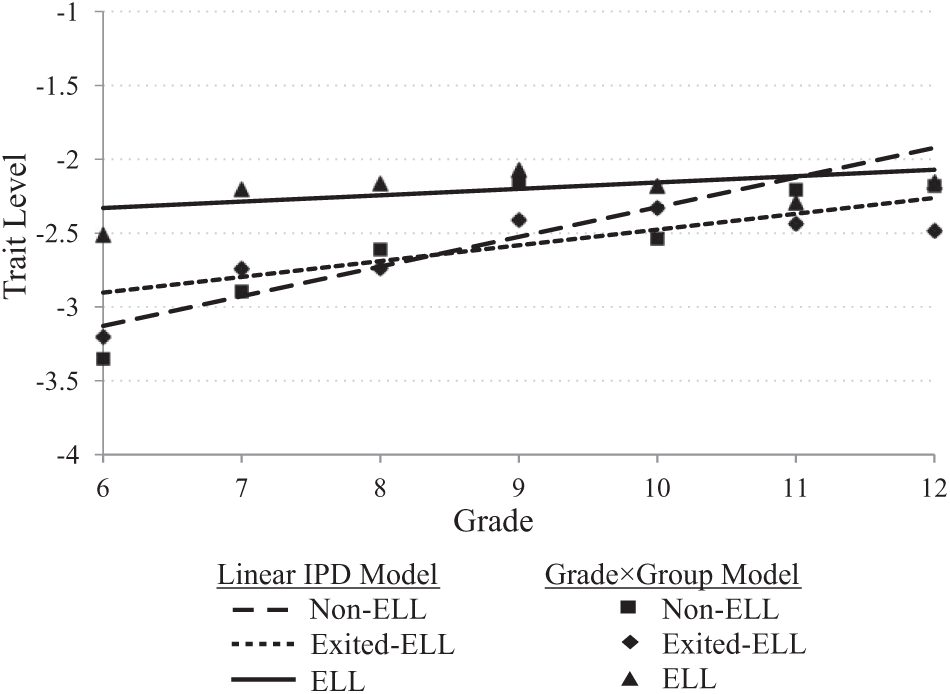
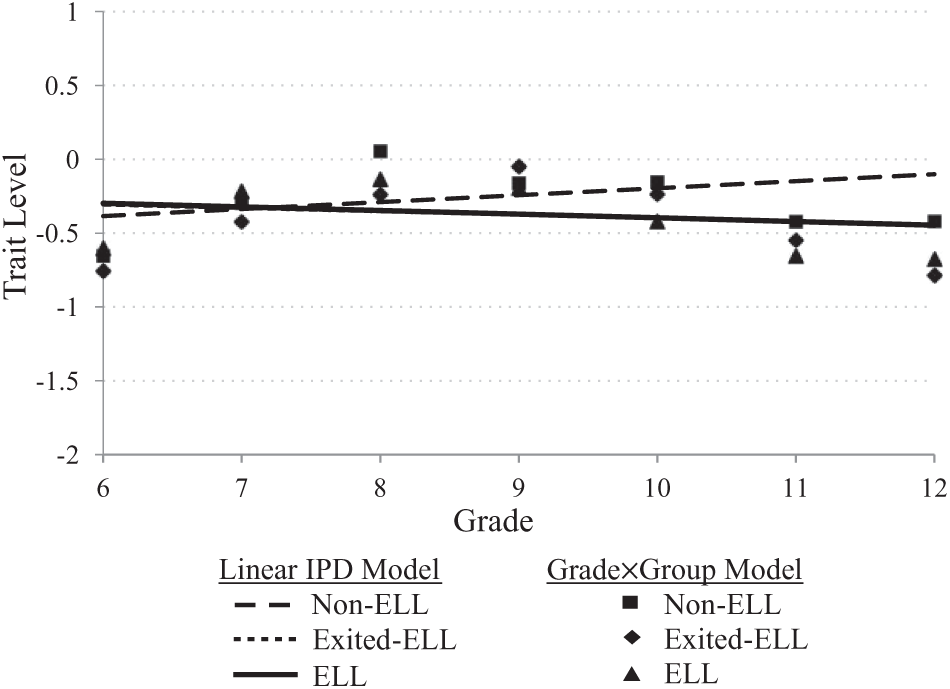
Display of the parameter estimates for the Support item regarding asking for parental advice, by grade level for the linear IPD and Grade × Group factor models.

Display of the parameter estimates for the Support item regarding parental support to succeed, by grade level for the linear IPD and Grade × Group factor models.

Display of the parameter estimates for the Support item regarding caring neighbors, by grade level for the linear IPD and Grade × Group factor models.

Display of the parameter estimates for the Support item regarding caring school, by grade level for the linear IPD and Grade × Group factor models.

Display of the parameter estimates for the Support item regarding other adult support, by grade level for the linear IPD and Grade × Group factor models.

Display of the parameter estimates for the Support item regarding loving supporting family, by grade level for the linear IPD and Grade × Group factor models.

Display of the parameter estimates for the Support item regarding talking with parents, by grade level for the linear IPD and Grade × Group factor models.
Positive Identity Item Functioning
Based on the review of the graphic displays, three of the six Positive Identity items (Figures 1 to 3) illustrated linear drift parameters. Visual misfit (nonlinearity) occurred on three of the six Positive Identity items (Figures 4 to 6). The items illustrating nonlinear drift were about dealing with disappointments (Figure 4), dealing with things that are hard in life (Figure 5), and thinking about one’s purpose in life (Figure 6). Each graphic display is briefly interpreted to provide more concrete meaning regarding the results.
The first Positive Identity item (Figure 1) concerns having a sense of control in one’s life. The drift parameters were nonsignificant for this item, as seen in Table 4 (γ13 to γ15). Notice in Figure 1, the lines are relatively flat. The top solid line is for students receiving ELL services, the middle dashed line is for non-ELL students, and the bottom dotted line is for exited-ELL students. Also notice that the lines are relatively aligned with the location of the markers, indicating the item location independently for each group across grades from the factor model. The triangles (ELL) closely align to the top solid line, the squares (non-ELL) closely align to the middle dashed line, and the diamonds (exited-ELL) closely align to the bottom dotted line. There appears to be no systematic drift in item location (level of Positive Identity required to have a sense of control) across grades.
However, notice there are differences in the location of these lines on the trait scale. This indicates significant DIF given ELL status. From Grade 6 to 12, the ELL student line is above those of the other two groups although the lines converge closer to Grade 12. To endorse this item regarding a sense of control in one’s life, students receiving ELL services must have a higher level of Positive Identity, indicated by the higher location of the ELL line on the trait level (Figure 1) and the higher item location estimate (γ12, Table 4). If a constant item location was used to estimate students’ level of Positive Identity on this item, −2.06 as estimated by the Rasch model (Table 2), ELL students’ level of Positive Identity would be underestimated and that of exited-ELL and non-ELL students would be overestimated. Because endorsing this item requires a higher trait level for ELL students, endorsing the item should indicate a higher level of the trait for those students. The person estimation (scoring) model estimates a trait level that is commensurate with the location of the item for those individuals endorsing the item and reporting to have a sense of control in their life (and similarly for those who do not endorse the item, reporting to not have a sense of control). If the model does not correctly locate the item or uses the wrong item location, the person trait level is incorrectly estimated. Moreover, developmental profiles of differences in students across grades will be distorted (more on the meaning of this in the “Discussion” section).
The second and third Positive Identity items (Figures 2 and 3) follow similar linear drift patterns. Item 2 (feeling good about one’s self) is characterized by significant linear parameter drift for ELL students (the solid line in Figure 2 and the significant coefficient γ25 in Table 4), where the trait level required to be likely to endorse the item (item location) decreases across Grades 6 to 12. Item 3 (feeling good about one’s future) is characterized by positive drift for exited-ELL and non-ELL students (Figure 3), where the item location increases across grades.
The fourth, fifth, and sixth Positive Identity items (Figures 4 to 6) are characterized by a common characteristic. First, the items function similarly for the three ELL groups, but the IPD across grades does not appear to be linear. For all three items, the item location increases from Grade 6 to 8, then decreases to Grade 12. This suggests that for all three groups, to endorse an item requires an increasingly higher level of Positive Identity to Grade 8, then a decreasing level of Positive Identity to Grade 12. This means that if a constant item location was used to estimate student Positive Identity, students in Grade 8 would be underestimated and students in Grades 6 and 12 would be overestimated.
Support Item Functioning
The visual fit for the multiple-groups linear IPD model is better for the Support measure, as nearly all drift effects appear to be relatively linear. The visual analysis showed that the drift parameters for all three groups either followed linear drift for an item or the absence of drift (only 3 of the 21 parameters). Overall, linear parameter drift occurs in at least one group for every item, and all three groups for five of the seven items.
The first Support item (Figure 7) concerns asking parents for advice. The drift parameters were significant for exited-ELL and non-ELL students for this item, and nonsignificant for ELL students, as seen in Table 5 (γ13 to γ15). Notice in Figure 7 that there is some variation around the linear drift parameters (as can be seen by the markers), but the solid line (ELL) is flat, the dotted line (exited-ELL) is slightly increasing, and the dashed line (non-ELL) is more steeply increasing. There is another more subtle pattern that is similar to the pattern observed with the Positive Identity items: There is a slight increase for all groups from Grade 6 to 8 (or 9), then either a leveling off or slight decline to Grade 12. Again, this suggests that to be willing to endorse the item about asking parents for advice (that the student does ask parents for advice), it requires a higher level of Support overall for students in Grade 8 or 9 than other grades (more on the meaning of this in the “Discussion” section). However, the overall trend appears more linear than not, particularly for the remaining items.
Items 2, 3, and 4 (Figures 8 to 10) illustrate linear drift across grade, where all three ELL groups exhibit similar patterns, indicating no DIF across ELL subgroups. Item 5, regarding other adult support (Figure 11), illustrates linear drift for non-ELL students only. For Items 6 and 7 (Figures 12 and 13), all three groups are characterized by linear parameter drift, where the increase in item location is more pronounced from Grades 6 to 8 and levels off to Grade 12.
Overall, on the Support measure, there is much less DIF across ELL subgroups, with the exception of Item 1 (Figure 7; asking parents for advice), where ELL students are more willing to endorse the item, holding overall Support constant. However, there is systematic, mostly linear, parameter drift across Grades 6 to 12. This occurs at some level with every item. The empirical item locations increase across grades, suggesting that the construct as a whole shifts across grades; students must have higher levels of Support overall to endorse each item (items are becoming more difficult to endorse across grades).
Discussion
Despite the importance of MI in terms of the validity of score interpretation and use, and the increasing attention to subgroup DIF (typically regarding gender or race), there is often a lack of concern for MI when an assessment is administered across different age groups or developmental stages, particularly with social/emotional domains. With increasing attention to meeting the developmental needs of diverse youth, closing achievement gaps, reducing school suspensions, and increasing graduation rates, assessments informing educators and policy makers on social/emotional characteristics of youth must be carefully examined to ensure appropriate, meaningful, and useful score interpretation across subgroups and developmental stages.
This study illustrates the use of EIRM to explore the evaluation of MI in the form of DIF (between ELL subgroups) and IPD (employing grade level as an indicator of developmental stage). DIF analysis has a long history and is a routine component in achievement test design and analysis (Livingston, 2006). IPD is typically used for evaluating MI across multiple administrations of a test over time. In this study, MI is evaluated by accounting for DIF and IPD. A questionnaire measuring developmental assets was administered to 6th- to 12th-grade students in an urban school district with a large Latino student population, including students receiving ELL services, students who had exited ELL services, and students who never received ELL services. Two assets, Positive Identity and Support, were evaluated for MI across ELL status and grade level.
The results of the MI evaluation indicated that some items function differently across ELL status and grade. For Positive Identity, the functioning of some items was influenced by grade level differentially based on language status. For Support, the functioning of nearly every item was influenced by grade level and, much less so, by language status. This has implications for interpretation consistency.
Implications for the Measurement of Positive Identity
The Positive Identity measure shows some DIF and IPD overall. However, this varied across items and language groups. Regarding DIF, for most items, ELL students needed a higher level of Positive Identity to have a likelihood of endorsing each item, and for some items, this was particularly true for 6th-grade ELL students, and less so for 12th-grade ELL students. For ELL students to be likely to agree with the components of Positive Identity (e.g., feeling in control of their life, feeling good about their future, dealing with life’s challenges and having purpose in life), they needed to have a higher level of Positive Identity overall. These items, based on a constant item location (assuming the same item parameter for everyone), are underestimating the Positive Identity of ELL students. This occurs when ELL students tend to endorse such items when they have higher levels of Positive Identity than non-ELL or exited-ELL students who endorse the items with lower levels of Positive Identity.
For three items, the parameter drift was nonlinear. For items about dealing with disappointments, dealing with hard things in life, and thinking about one’s purpose in life, the drift appears to be systematic where the item location increases from 6th to 8th grade and decreases from 9th to 12th grades. This suggests that something triggers a shift in the increasing item location in 9th grade, causing the item location to then decrease. A potential reason could be that this is the time when students transition from middle to high school toward more independence. Students who endorse the items in later grades tend to have lower levels of Positive Identity overall; it becomes easier to agree with items in later grades and is most difficult to agree with items in 8th grade, controlling for overall Positive Identity.
Implications for the Measurement of Support
With the measure of Support, parameter drift was uniformly positive, where item locations increased from Grade 6 to 12 and mostly in a consistent way across ELL subgroups. All groups require lower levels of perceived Support to agree with items in the Support measure in earlier grades and higher levels of perceived Support at later grades. Because of parameter drift, estimates of perceived Support levels of students across grades are biased, where Support for students in younger grades is overestimated and Support in older grades is underestimated.
The questions remaining have to do with the impact of development on the measurement of developmental assets like Positive Identity and Support, and the variation that is found across Latino ELL subgroups. For Support (including family, school, and community support), it is more difficult to agree with statements about being supported for older students (requires an overall higher level of Support). So, interpretation of perceived Support across grade levels is distorted. When a 6th-grade student agrees with Support statements, his or her overall level of Support is estimated based on the location of the items in the measure. Because the item locations are lower on the trait scale in the linear drift model than in the constant-location (Rasch) model, their level of Support is overestimated. Similarly, because the item locations are higher on the trait scale for 12th-grade students, using a constant-location model underestimates Support for them. As students move from middle school grades to high school grades, Support becomes a slightly different construct (even with the same items), as the items become more difficult to endorse, indicating that if the same items are being endorsed in older grades, this should indicate a higher level of perceived Support than when endorsed in younger grades.
Implications for the Evaluation of MI
MI can be evaluated at the item level through DIF and IPD analyses. In this study, both DIF and a form of IPD (in cross-sectional data across grades) were applied in a single EIRM that allows the detection of both linear and nonlinear drift in item locations. Most items on the Positive Identity and Support measures examined here appeared to follow linear drift, but there were some items where drift was not linear and depended on language status (DIF). Methodologically, the use of IPD to measure drift across grade levels is not a common approach for examining parameter drift when data collection is cross-sectional, but this concept could be applied easily to a variety of cross-sectional settings. Through the use of the EIRM approach, both DIF and IPD and their interaction (IPD across grade levels depends on ELL status) can be evaluated succinctly. In addition, the model can be made flexible enough to assess the extent to which drift is linear or nonlinear.
Limitations and Future Research Recommendations
The Latino student sample was obtained from several secondary schools in a single district. Although the proposed interpretations of IPD and DIF were not made for the purpose of generalizing across a broader Latino youth population, these specific findings may be a function of unique school district or school effects. However, a larger point of this work is to reinforce the practice of MI evaluation in noncognitive measures with diverse populations. The evaluation of MI should become common practice to defend interpretation and use of measures of social-emotional characteristics. Through wider examination of these issues, potential school effects or community-specific effects can be identified as well.
There are several areas recommended for future research. First, future studies could be completed to examine the patterns of drift across developmental stages for ELL, exited-ELL, and non-ELL students using different ethnic populations and different noncognitive measures. This also suggests that developmental stages be assessed more directly, rather than indirectly through grade level (as an indicator). This holds promise for contributing to developmental theory as well. Greater diversity in ethnic groups and measures will inform the future of this work and its implications. Second, the research could be extended to include predictors that explain the drift parameters. For instance, for items where drift varies as a function of ELL status, other information like immigrant status (especially regarding Positive Identity) or time spent interacting with adults (especially regarding Support) might serve explanatory functions. This type of study could be easily completed in the EIRM framework, as additional variables in the model. In this study, dichotomization of the items did not lead to a great deal of information loss at the scale level (see Appendix B). However, the models can be extended to the polytomous cases, taking advantage of the full information in more typical multipoint rating scales (although the researcher must be prepared to deal with hundreds of coefficients).
This study provides a unique example of examining MI of measures of developmental assets across developmental stages and language status. Although unconventional, given the typical examination of parameter drift in longitudinal contexts, the EIRM model provided a flexible and powerful approach to assessing IPD and DIF simultaneously. As the effects of IPD and DIF and their interactions were estimated simultaneously, it also provided a more direct way to evaluate MI in the target measures. This also provided for a unique opportunity to interpret developmentally relevant youth characteristics (development as a major driver across the grade levels and ELL status) and their effects on the interpretation of scores. The purpose of this study was to investigate parameter invariance using a multiple-group linear drift model, where the findings exposed implications for interpreting youth development measures among ELL, non-ELL, and exited-ELL students across developmental stages.
Footnotes
Appendix A
Appendix B
Acknowledgements
The authors thank Eugene Roehlkepartain, Peter Scales, and the data team of Search Institute for their support of this research and review of an earlier draft of the manuscript. We also greatly appreciate the feedback from Sage Open reviewers and action editor—Their comments were thoughtful and helpful.
Declaration of Conflicting Interests
The author(s) declared no potential conflicts of interest with respect to the research, authorship, and/or publication of this article.
Funding
The author(s) received no financial support for the research and/or authorship of this article.