
Abstract
This research uses variance ratio analysis to test whether Middle Eastern, North African (MENA) and Pacific Basin emerging equity markets follow a martingale behavior during the period1980-2004. The conventional Lo and MacKinlay variance ratio test, the multiple variance ratio test of Chow and Denning, rank- and sign-based test of Wright, and wild bootstrap of Kim are used for the monthly return series. The problem of thin trading was addressed using Miller, Muthuswamy, and Whaley’s adjusting procedure. Results have shown traces of a martingale behavior at high holding horizons. However, overall conclusions indicate that the null martingale hypothesis is strongly rejected for the whole sample and considered sub-periods at a 5% significance level. The pattern of the variance ratio estimates signify that the selected stock markets exhibit persistent mean-reverting and predictable behavior in their monthly adjusted returns series. The results expose the ineffectiveness of economic liberalization and privatization measures implemented in the early 1990s to improve their market efficiency. The Asian crisis did not affect the outcomes of the variance ratio analysis. Moreover, it sounds as if the perceptible development in terms of size and liquidity was not sufficient to exhibit a martingale behavior in these markets.
Introduction
Given the influential work of Fama (1970), academics believe that in an efficient market, all available information is fully incorporated and prices are instantly adjusted to their new equilibrium values. Thus, technical and fundamental analysis based on the study of the sequence of historical prices for predicting future movements is useless. This means that there are no systematic profitable arbitrage opportunities. Based on autocorrelation, spectral analysis, or runs tests, earliest studies showed that stock prices follow a random walk providing evidence in favor of the weak-form efficient market hypothesis. However, these tests did not control for time-varying volatilities. Lo and MacKinlay (1988) assessed the validity of the conventional random walk empirical tests and developed the variance ratio test based on the assumptions of homoscedasticity and heteroscedasticity. Their research gave rise to an abundant literature reviewing the behavior pattern of stock returns in several international markets. Poterba and Summers (1988) examined American and 17 other international equity markets monthly returns using variance ratio tests. The authors confirmed negative serial correlation in the long horizon and positive serial correlation in the short horizon. Their research provided evidence in support of the mean-reversion property, which contradicts the random walk hypothesis. They found that serial correlation was mainly attributed to noise trading. Their study pointed out that the outcomes of the random walk tests might be sensitive to sampling intervals. This issue was considered comprehensively by Fama and French (1988). Following the works of Poterba and Summers (1988) and Fama and French (1988), many researchers such as Chen and Deo (2006) and Smith (2009) challenged the earlier findings.
Although many academics continue to support the efficient market hypothesis, behavioral finance provides evidence in favor of the irrational investor behavior such as overreaction or overconfidence. De Bondt and Thaler (1987) recommended overreaction or underreaction of investors to the arrival of new information. Other reasons were suggested to justify market inefficiency and the predictable pattern of stock returns. Lo and MacKinlay (1988) showed that the behavior of returns and associated risk are likely to be time-dependant. Jegadeesh and Titman (1993) suggested momentum effect, which is well documented in the literature. When new information is not instantly incorporated into the current stock prices, the speculative behavior of irrational investors can lead to momentum effect.
Literature Review: Random Walk Hypothesis in Emerging Markets
A growing body of financial literature exists already on the weak-form efficiency and the random walk hypothesis of emerging markets, although the results are mixed. The random walk hypothesis has been tested for Latin American emerging markets (Urrutia, 1995), European markets (Smith & Ryoo, 2003), Asian emerging markets (Huang, 1995), Korean markets (Ayadi & Pyun, 1994), and African markets (Smith & Jefferis, 2005; Smith, Jefferis, & Ryoo, 2002). A comprehensive study by Butler and Malaikah (1992) applied serial correlation and runs tests for two Gulf markets: Saudi Arabia and Kuwait. The authors found statistically significant serial correlations and concluded that Saudi equity market showed a more prominent violation of the random walk pattern, suggesting that low trading volume may justify the predictable return behavior. Ayadi and Pyun (1994) carried out the traditional variance ratio test of Lo and MacKinlay for daily Korean prices. They supported the random walk hypothesis when the heteroscedastic stochastic disturbance term is used. In another relevant study, El-Erian and Kumar (1995) found that investors in Jordan and Turkey stock exchanges are likely to develop trading profitable strategies to earn abnormal returns. They provided evidence that random walk model did not hold for daily Jordanian and Turkish stock returns. Aloui (2005) noted that Tunisian equity market possesses strong long range dependence in daily volatility. On another front, Cajueiro and Tabak (2005) proposed that Asian equity markets are more efficient than those of Latin America. Abdmoulah (2010) showed in a comparatively recent research that the efficiency of Arab stock markets is generally time-varying. The author argued that although many Arab markets have exhibited sub-periods of efficiency improvement, their markets’ efficiency is influenced by the contemporaneous crises without any general tendency toward weak-form efficiency. Regarding the markets in Malaysia, Singapore, and Thailand, Huang (1995) rejected the random walk behavior for these three markets in the early 1990s. Magnusson and Wydick (2002) found that Indonesia and Thailand do not meet the criterion of weak-form efficiency with monthly returns that do not confirm to a random walk. Their findings are in agreement with Hoque, Kim, and Pyun (2007) who showed significant mean-reverting and predictable behavior in weekly return series during the period 1990- 2004 in Indonesia, Malaysia, Philippines, Singapore, and Thailand.
In the context of Middle Eastern, North African (MENA) stock markets, Omran and Farrar (2006) conducted run tests, augmented Dickey and Fuller tests, and spectral and variance analyses to verify whether stock market prices in Egypt, Morocco, Jordan, Israel, and Turkey follow a random walk. Their findings invalidated weak-form market efficiency. In a relatively recent study, Al-Khazali, Ding, and Pyun (2007) tested the efficiency hypothesis of the stock markets of Morocco, Tunisia, Egypt, Oman, Jordan, Kuwait, Bahrain, and Saudi Arabia. The authors conducted Wright’s (2000) version test and concluded departures from weak-form efficiency hypothesis for all the examined equity markets. Conversely, the outcomes on efficiency are inversed and the random walk hypothesis is accepted when observed data are corrected for thin trading. Hence, the latter study provided a probable justification for the indecisive results in literature regarding the efficient hypothesis of the emerging equity markets. Following this logic, Al-Ajmi and Kim (2012) performed tests based on Kim’s (2006) wild bootstrap test, Kim and Shamsuddin’s (2008) joint sign test, and the Chen and Deo’s (2006) test, which are recognized to have enviable small sample properties. The authors confirmed the findings of Al-Khazali et al. (2007) by tolerating the weak-form inefficiency of stock markets in the Gulf Cooperation Council (GCC) countries (Abu Dhabi, Bahrain, Dubai, Kuwait, Oman, Qatar, and Saudi Arabia). Moreover, the inefficiency is outstandingly stronger for daily compared with weekly return series. In an apparent inconsistency with the findings reported by Al-Khazali et al. (2007), the authors found comparable outcomes on market efficiency for both observed and corrected returns for thin trading. This finding contradicts with that reported by Al-Khazali et al. (2007). The contribution of the market liberalization and the moves toward increasing market liquidity to attract more investors and to improve the market efficiency of the GCC markets were in fact controversial. Smimou and Karabegovic (2010) argued that economic freedom has a positive and significant effect on MENA equity markets.
The main contribution of this study to this ongoing debate over the market efficiency of MENA and Asian stock markets is found in the following four aspects. First, we consider the influence of the economic reforms, the financial liberalization, and Asian crisis on return stock market indices over a long period (1980-2004). Second, by dividing the data set into four sub-periods, possible changes in non-random return behavior can be investigated. This is to explore the dynamic nature of MENA and Asian emerging equity markets and to get inferential outcomes robust to probable structural changes or influential outliers. Third, we test whether thin MENA and Pacific Basin emerging equity markets meet the martingale behavior using variance ratio analysis. We test the martingale hypothesis for emerging markets with varying degrees of development. We apply non-parametric variance ratio tests that do not rely on asymptotic approximations and have desirable small sample properties. Finally, this article conducts variance ratio tests using corrected return time series. A correction methodology for non-synchronous trading suggested by Miller, Muthuswamy, and Whaley (1994) is used.
This article is organized as follows. The next section presents the variance ratio tests used in this study. The data and methodology are described in section “Data.” The “Discussion” section reports the empirical results. The relevant findings are discussed and conclusions are drawn in section “Conclusion.”
Variance Ratio Tests
The variance ratio tests conducted in this research include the standard variance test of Lo and MacKinlay (1988), the Chow and Denning (1993) test, the Wright (2000) test, and the Kim (2006) wild bootstrap test.
Lo and MacKinlay (1988) Test
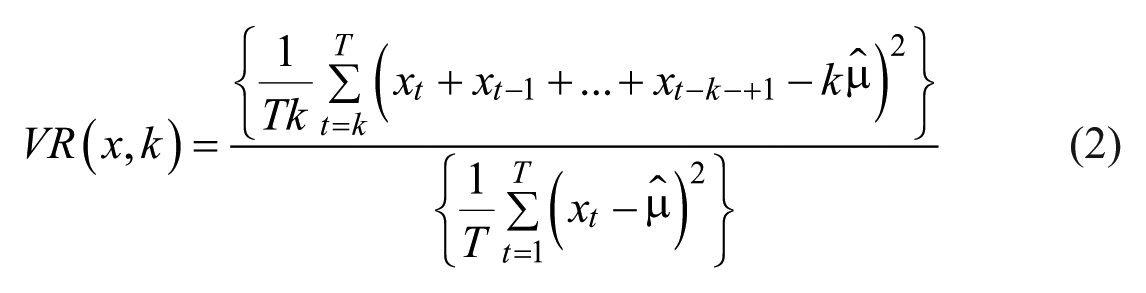
The variance ratio test developed by Lo and MacKinlay (1988) has been widely used to test for the random walk and the weak-form efficiency of equity markets. The core of the variance ratio test is that the variance of increments of a random walk is linear in all sampling intervals. Under the null hypothesis, the variance ratio statistic, VR(k), estimated should be equal to 1 for any individual lag horizon k.
More explicitly, let


where
In fact, the martingale model is a generalized version of random walk, which tolerates increments to be uncorrelated and conditionally or unconditionally heteroscedastic.
Under the assumption that xt is generated from a martingale difference sequence, the variance ratio statistic (VR) can be calculated as follows (see Wright, 2000):
where
Under the null hypothesis, the variance ratio VR(k) should approach unity,

Lo and MacKinlay (1988) proposed a standard normal statistic M1(k) to test the null hypothesis of a random walk. The resulting test statistic supposes that the disturbances are homoscedastic:

where

Note that nk + 1 is the number of observations and nk is the last observation of the return series.
To control for time-varying volatilities and non-normality, Lo and MacKinlay (1988) developed a heteroscedastic robust statistic. The test statistic M2 has asymptotic standard normal distributions and is given by

where

and

Thus, the hypothesis of martingale can be tested under the asymptotic distribution of both homoscedastic and heteroscedastic robust variance ratio estimators. Rejecting the martingale hypothesis with a variance ratio of less than 1 at long horizons implies negative serial correlations. We have indication, in this case, of mean- reversion of returns. In contrast, variance ratios greater than 1 reveal positive serial correlation (mean- aversion). Thus, variance ratio statistics present an appealing way to search for meanreversion, a deviation from the martingale hypothesis.
Chow and Denning (1993) Test
The null hypothesis of the martingale requires variance ratios to be equal to 1, VR(k) = 1, simultaneously at all levels of k, whereas the core of Lo and MacKinlay tests was to estimate individual variance ratios separately for a given holding period k.
Chow and Denning (1993) modified Lo and MacKinlay’s test to counter the limiting assumptions and form a multiple variance ratio test. They suggested a more powerful heteroscedastic multiple comparison test that controls for the joint null hypothesis,

The Chow–Denning test statistic follows the Studentized Maximum Modulus (SMM) distribution with m and T degrees of freedom, SMM (α, m, T).
Wright (2000) Test
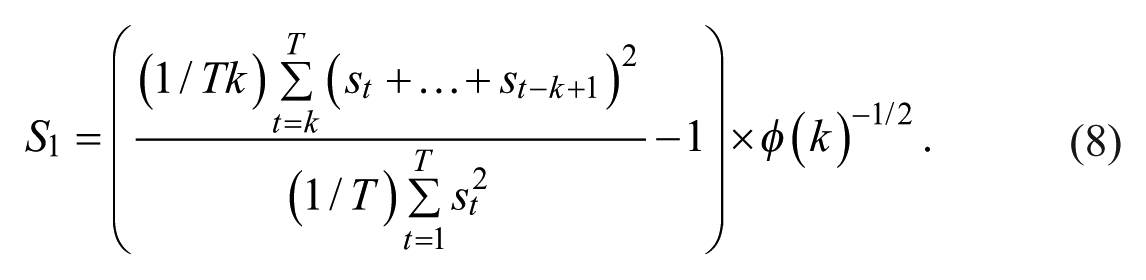
Wright (2000) proposed a non-parametric alternative to the standard asymptotic Lo and MacKinlay variance ratio tests based on ranks and signs. The author found that Lo and MacKinlay variance tests based on asymptotic approximations are biased and right-skewed in finite samples. As such, the conventional variance tests can lead to misleading statistical inference. Wright (2000) denoted two potential enhancements under the assumption that the return series follow a martingale difference sequence. First, it is possible to estimate the exact distributions of the test statistics when the sample size of the return series is quite small. Next, Wright tests may possibly have more powerful properties than other tests if the return series are decidedly non-normal.
Assuming that xt is generated from a martingale difference sequence, the null hypothesis V(k) = 1 against the alternative hypothesis
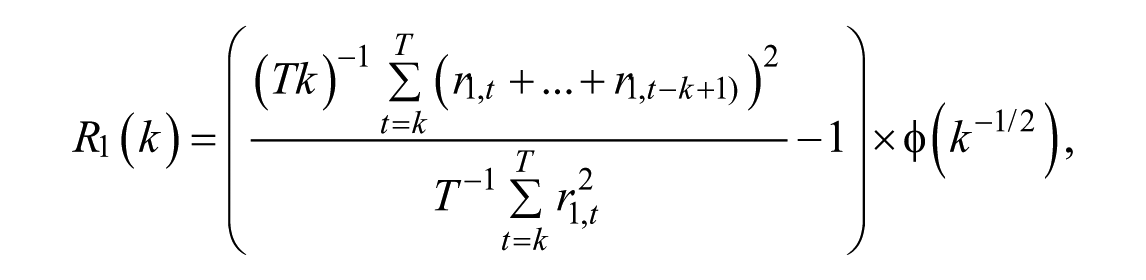

where

and the standardized ranks are defined as follows:


The variable
Kim’s (2006) Wild Bootstrap Test
Choosing long-time horizons for the computation of returns may decrease the number of observations and limit the value of asymptotic distributions. To overcome the problem of small samples, Kim (2006) suggested the wild bootstrap method, a convincing statistical substitute inference tool to the asymptotic distributions. Particularly, the author recommended using the wild bootstrap method of Mammen (1993) to estimate the sampling distribution of Chow and Denning’s test statistics, MV(x; ki). This resampling method, applied to return series with unknown forms of heteroscedasticity, is commonly carried out in the following three steps:
Form a bootstrap sample of T observations
Next, compute
Replicate the two previous stages abundantly m times to bring about the bootstrap distribution of the statistic
The explicit form of
Data
We explore the behavior of MENA equity market returns compared with emerging markets from Asia. MENA and Pacific Basin equity markets portray prospective promising emerging markets. Both markets show a visible development in terms of market capitalization, value of traded shares/GDP, and number listed (Table 1). Several probable factors have contributed to the development of those stock markets. During the 1990s, emerging nations engaged in moves toward privatization of public sectors, diversification of the economy, and implementation of the coherent structural reforms, which brought about undeniable progress of these markets. This was done by reinforcing the private sector together with strengthening the role of the financial market, authorizing foreign investors better access to their equity markets.
Characteristics and Statistical Overview.
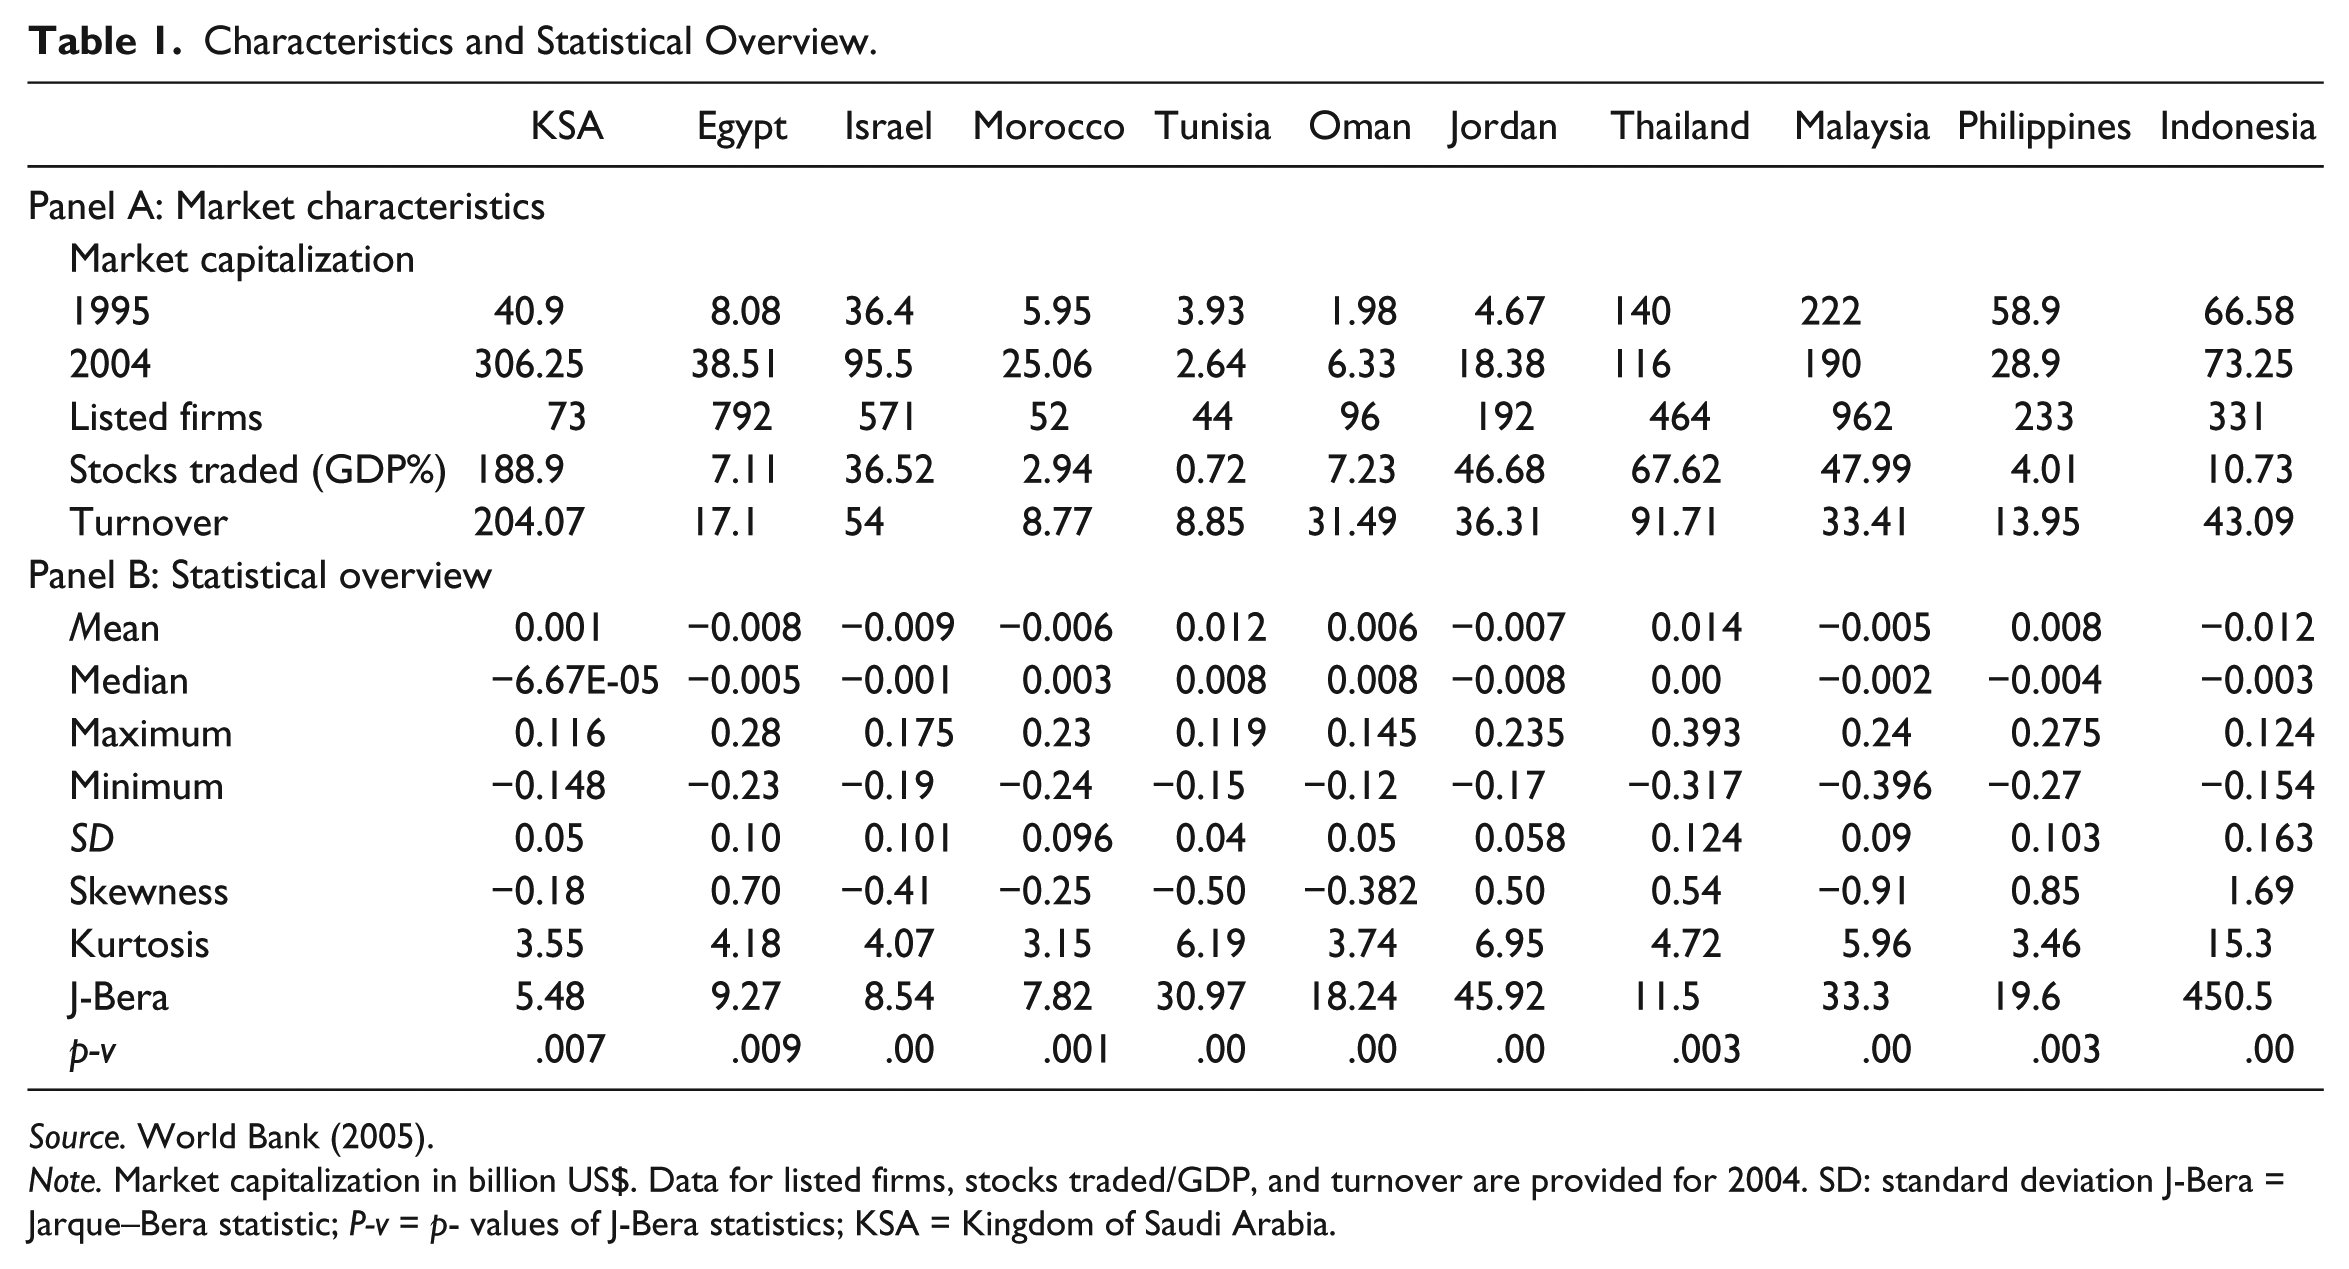
Source. World Bank (2005).
Note. Market capitalization in billion US$. Data for listed firms, stocks traded/GDP, and turnover are provided for 2004. SD: standard deviation J-Bera = Jarque–Bera statistic; P-v = p- values of J-Bera statistics; KSA = Kingdom of Saudi Arabia.
Data Sources
The sample of this study covers seven MENA and four Asian emerging markets. Data were extracted from Standard and Poor’s Emerging Markets Database to get a homogenized set of indices. We have collected monthly closing prices for seven MENA equity markets—namely, Tunisia, Oman, Morocco, Egypt, Israel, Jordan, and Saudi Arabia. For comparison purposes, we consider four Asian stock markets: Malaysia, the Philippines, Thailand, and Indonesia. We use monthly data of 11 emerging stock markets that cover a wide time period, allowing us to test for the impact of the reforms undertaken by the authorities during the last decade. The data cover the period from January 1980 to December 2004. The analysis is performed for the full period and five 4-year sub-periods. The sample period also allows us to account for the effects of Asian crisis.
Using monthly data, the index values were converted to continuously compounding returns by taking the difference in natural logarithms of the raw data series. The returns used were adjusted for stock splits, cash, and bonus issues but were unadjusted for the risk-free rate or the inflation rate.
To analyze the behavior of the stock indices, returns Rt were calculated on a monthly basis by taking the logarithmic difference of the stock market price index Pt at time t, so that,

Table 1 reports statistical characteristics and results of a number of tests to determine whether the index returns can be plausibly modeled by a normal distribution. Descriptive statistics prove that monthly returns in MENA and Asian markets do not follow a normal distribution.
Thin Trading Return Adjustment
Prior studies argue that conventional efficiency tests applied to emerging markets are considered inadequate because they do not account for infrequent trading caused by thinness (Al-Ajmi & Kim, 2012; Bley, 2011). Infrequent trading can produce statistical biases in stock returns series. As a result, the outcomes of empirical tests can be speciously influenced. To overcome the probable biases, we used data correction methodology of Miller et al. (1994) to correct index returns. 1
In all the empirical variance ratio tests that follow, we provide the results for adjusted returns for thin trading.
Results
The premise of the random walk hypothesis is that return time series have a unit root component and a martingale property assuming that the increments are uncorrelated. If both conditions are met, the return series follow a random walk. The first property is commonly checked using the unit root tests. The uncorrelated increments of the series are generally examined using the variance ratio tests. Both tests complement each other to examine whether return series behave as a random walk. The null hypothesis of a unit root is tested against the alternative hypothesis of a stationary autoregressive process. Each market return index is tested for the presence of unit roots using the Phillips and Perron (1988) and Kwiatkowski, Phillips, Schmidt, and Shin (1992) KPSS tests. The Ng and Perron (2001) test is conducted to ensure the robustness of the test results. A constant and a trend are included in the regression.
Unit Root Tests
Table 2 shows the results of the computed unit root tests of monthly MENA and Pacific Basin stock returns. Based on the Phillips–Perron test statistics, the null hypothesis of the presence of a unit root is rejected, implying that return series are stationary for all indices in levels for all significance levels. However, the results are mixed using the KPSS test. The KPSS test statistics indicate tha t null is accepted for Egypt and Jordan at 5% and 10% significance levels. Another exception is found in the monthly return data in Morocco where the null hypothesis is accepted at the 1%, 5%, and 10% significance levels. The more robust Ng and Perron (2001) test partly questions the previous findings. We notice that the estimates of the Ng and Perron statistic values are smaller than the critical values so that we reject the null at conventional test sizes for Kingdom of Saudi Arabia, Egypt, Tunisia, Israel, Morocco, Thailand, Malaysia, and the Philippines. Given the improved power and the more accurate critical values, the Ng and Perron test strongly rejects the null hypothesis of unit root in Egypt and Morocco. This represents a preliminary evidence of the refusal of the random walk hypothesis in our testing sample equity markets. Conversely, return data seem to be non-stationary in Oman, Indonesia, and Jordan, and consequently the random walk hypothesis is supported in these markets for all conventional levels. Yet, the existence of a unit root is not a sufficient condition to assert the random walk hypothesis (Lo & MacKinlay, 1988).
Unit Root Tests.

Note. This table presents results for unit root tests with a constant and a trend. PP = Phillips–Perron test statistic; KPSS = Kwiatkowski–Phillips–Schmidt–Shin test statistic; KSA = Kingdom of Saudi Arabia. MZa,
5% and 10% significance levels.
All conventional levels: 1%, 5%, and 10%.
Some empirical studies have implemented unit root tests to examine the random walk hypothesis (Magnusson & Wydick, 2002; Omran & Farrar, 2006). Undeniably, our findings have some consistency with those obtained by Bley (2011) who applied augmented Dickey and Fuller, Philips and Perron, and KPSS unit root tests. Bley asserted that null hypothesis of the existence of a unit root is rejected by the KPSS test for GCC daily, weekly, and monthly returns for the period 2000-2009. Indeed, our findings contradict those of Al Janabi, Hatemi, and Irandoust (2010) who revisited the empirical validity of the informational weak-form efficiency of six Gulf stock markets (Bahrain, Kuwait, Oman, Qatar, Saudi Arabia, and United Arab Emirates [UAE]). The results obtained from the unit root Ng–Perron test indicate that each of the six stock price indices has a unit root, suggesting therefore that GCC equity markets are efficient in the weak form if daily data are considered.
Variance Ratio Analysis
This study reports the results of an empirical assessment of whether the examined equity markets follow a martingale. The behavior of the return series is studied by first applying the conventional variance ratio test suggested by Lo and MacKinlay (1988) and then applying the non-parametric test proposed by Wright (2000) and the wild bootstrap test of Kim (2006).
To explore the non-random behavior observed in the MENA and Pacific Basin emerging markets, we consider the dynamics of the variance ratio statistics VR(k). The overall data set is divided into several sub-periods. From Table 3, it is perceptible that the estimated individual variance ratios VR(k) decrease as lag intervals k increase without any tendency to approach unity. Accordingly, the null hypothesis assuming that the variance ratio is equal to 1 is strongly rejected for the whole period and all sub-periods. Consequently, for any holding period k and any sub-period, the martingale hypothesis is apparently rejected in favor of negative autocorrelation in returns suggesting therefore a mean-reversion behavior. Decisively, the detected mean-reverting pattern seems to be structural. The emerging markets in this region have been exposed to financial liberalization since the late 1980s or early 1990s but its gradual influence on the VR(k) estimates is not apparent. Moreover, the impact of Asian crisis in 1997 is examined. Variance ratios seem to increase post 1997 in Indonesia and Thailand. In contrast, the VRs of the Philippines and Malaysia seem to react negatively to the Asian crisis.
The Variance Ratio VR(k) Statistics for the Whole Period and Sub-Periods.
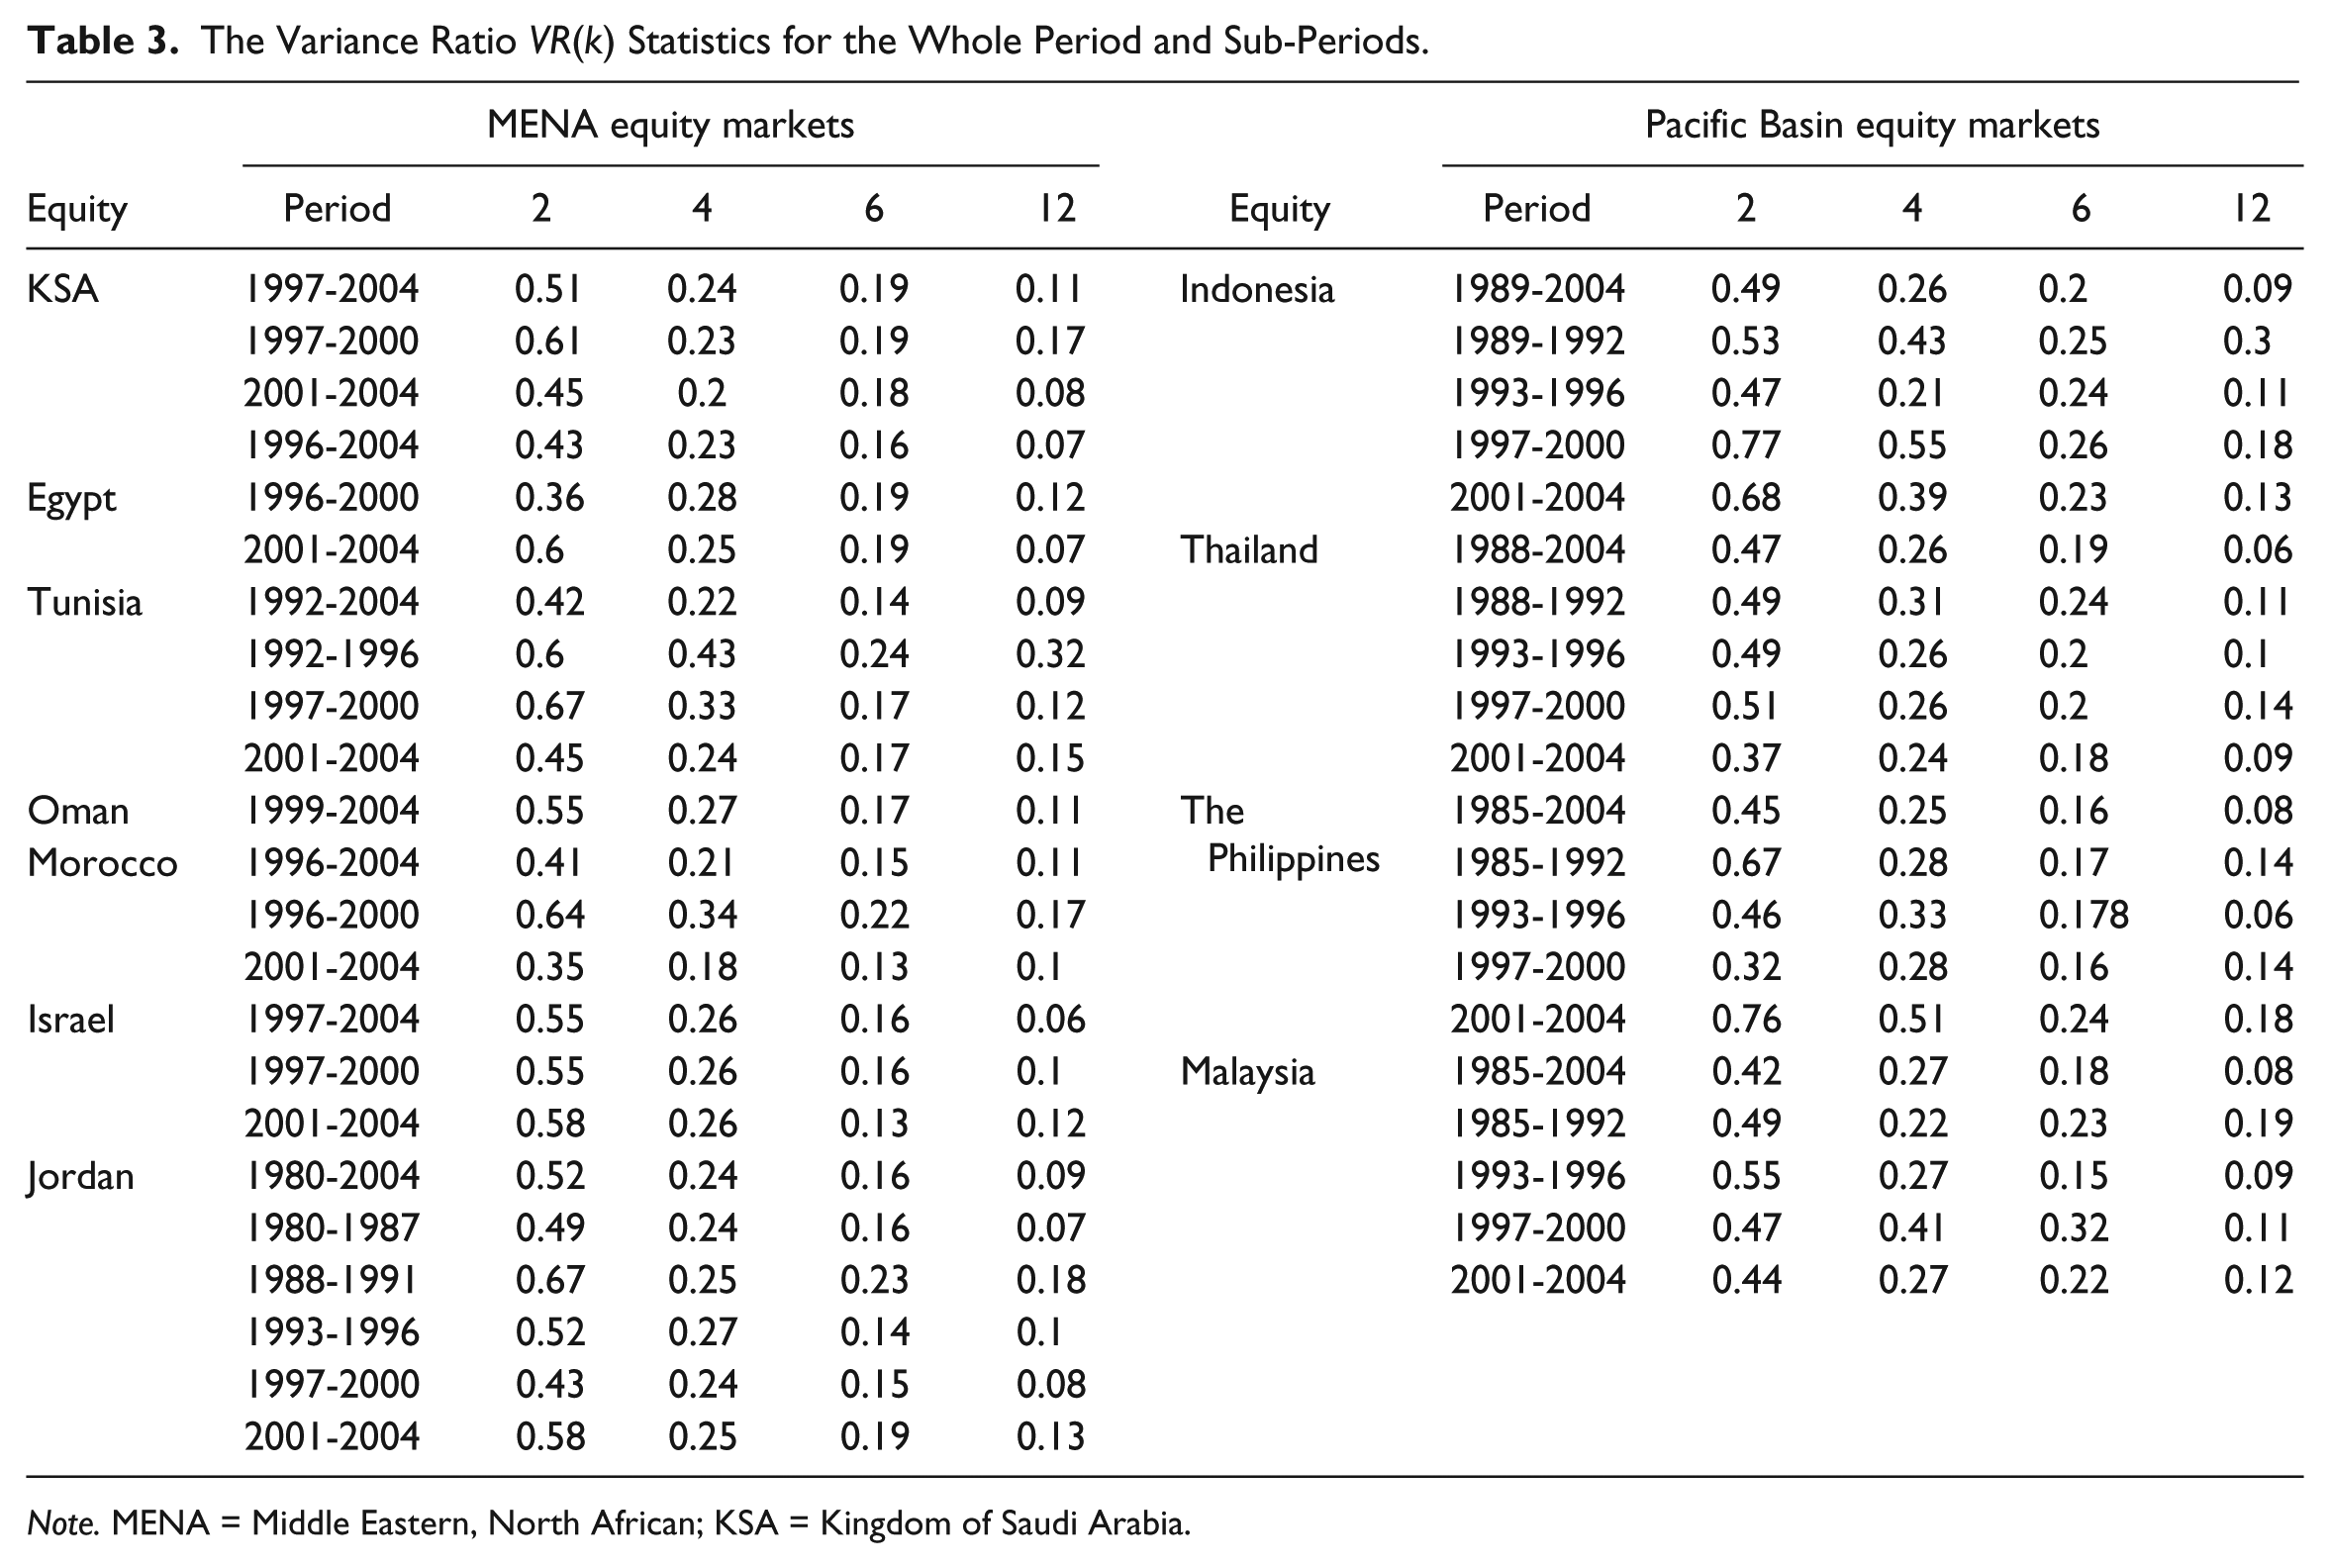
Note. MENA = Middle Eastern, North African; KSA = Kingdom of Saudi Arabia.
Table 4 details the results of individual test statistics (VR, M1, M2, R1, R2, S1, and MV*) of the selected stock return indices for sampling intervals k of 2, 4, 6, and 12 months for the whole sample. For each sampling interval k, the estimates of the test statistics M1(k) and M2(k) developed, respectively, under the conditions of homoscedastic and heteroscedastic increments are reported.
Variance Ratio Analysis for the Entire Period.
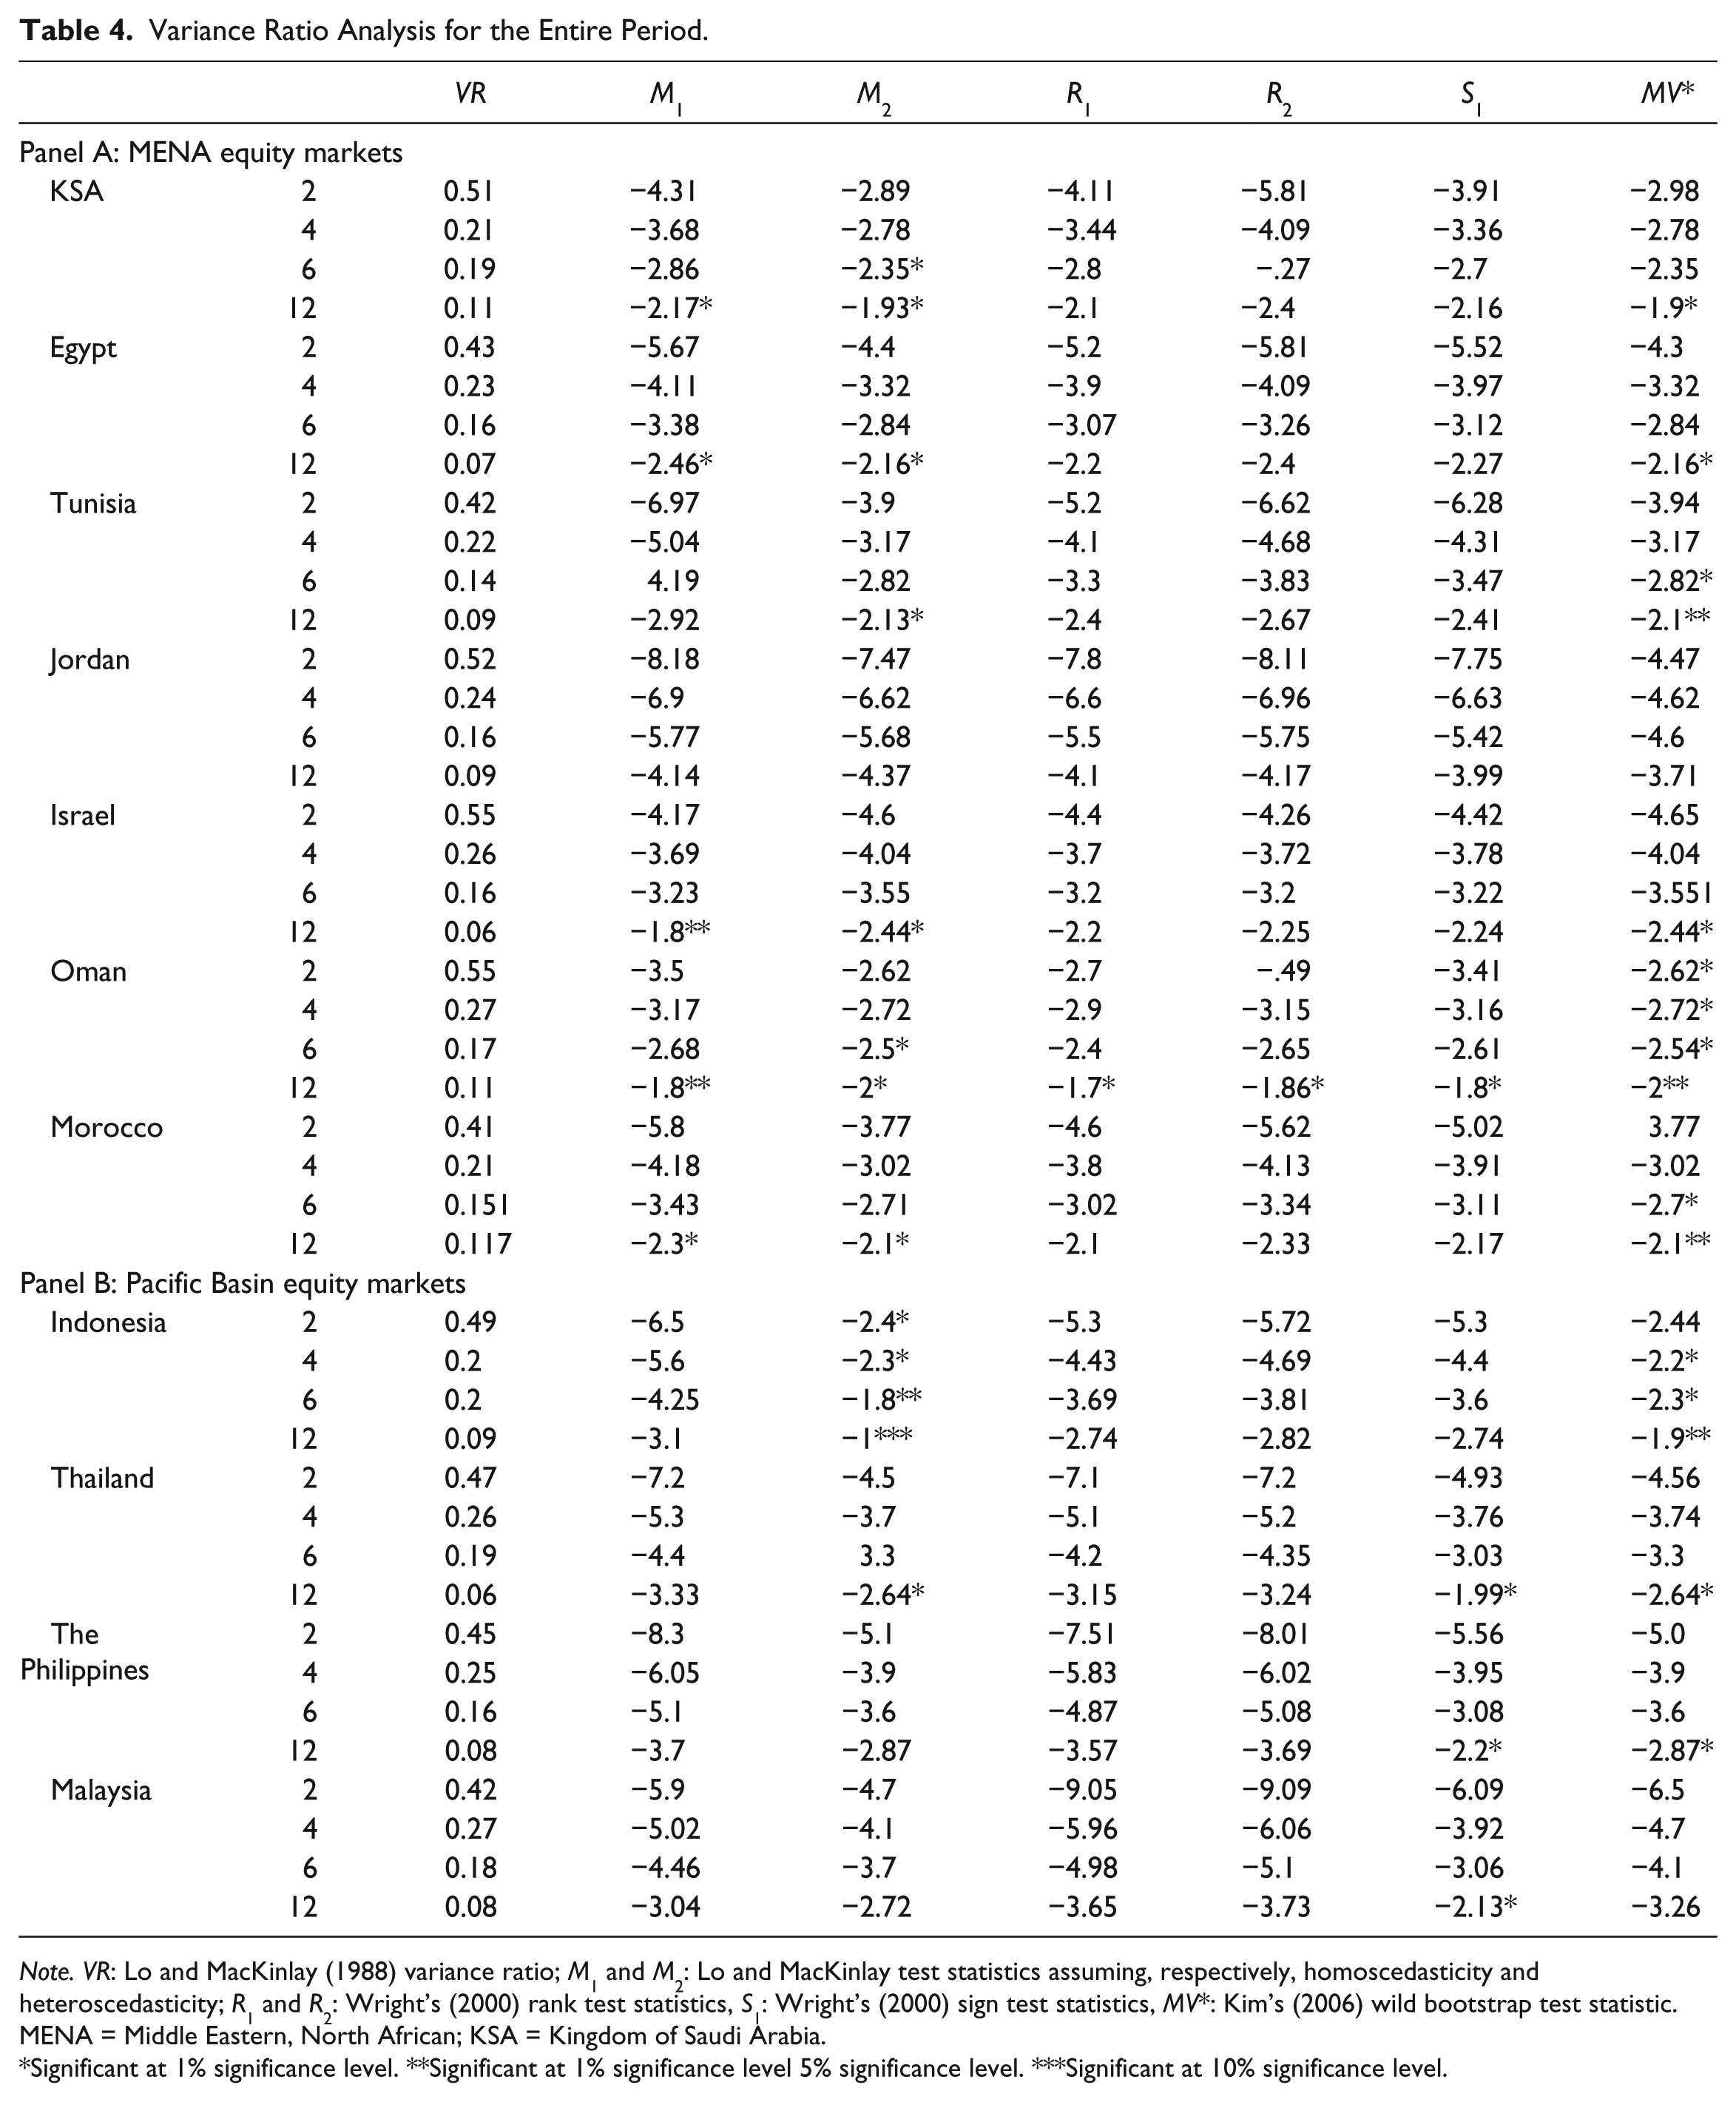
Note. VR: Lo and MacKinlay (1988) variance ratio; M1 and M2: Lo and MacKinlay test statistics assuming, respectively, homoscedasticity and heteroscedasticity; R1 and R2: Wright’s (2000) rank test statistics, S1: Wright’s (2000) sign test statistics, MV*: Kim’s (2006) wild bootstrap test statistic. MENA = Middle Eastern, North African; KSA = Kingdom of Saudi Arabia.
Significant at 1% significance level. **Significant at 1% significance level 5% significance level. ***Significant at 10% significance level.
The reported results show that the hypothesis of homoscedasticity is rejected for all indices at 5% significance level, except for Israel and Oman (k = 12). However, the negation of null hypothesis must be interpreted cautiously. The alternative statistic test M2 is robust under the assumption of heteroscedasticity. The null hypothesis is accepted in the latter stock exchange at 5% significance level starting from the lag horizon k = 6. At low values of k, results show that none of the examined series variance ratios is significantly equal to 1. However, this changes at higher lags. It is clearly seen from Table 4 that high lag interval k has much weaker rejections of the null hypothesis. With the exception of Jordan, there is some evidence of individual traces of martingale behavior at high lag intervals at 5% or 10% significance level. Interestingly, Indonesia seems to follow a martingale at 1% level of significance for all values of k displayed. Moreover, under the assumption of heteroscedasticity, the martingale hypothesis is visibly accepted at 5% significance level for a borderline holding period of k = 12 for the Indonesian return series. Besides, not only are consecutive return changes related but remote lagged changes also display some serial correlation, providing further evidence that the MENA stock markets can only be weak-form inefficient.
Next, we apply the non-parametric ranks (R1, R2)-based and sign (S1)-based variance ratio test based on the methodology of Wright. Test statistics are summarized in Table 4. It is clear that the individual statistics overwhelmingly reject the null hypothesis. The test statistic R1 indicates that the null, assuming that the variance ratios are equal to 1, is strongly rejected for Jordan, Israel, Saudi Arabia, Thailand, Malaysia, and the Philippines, with return index for all values of k displayed in Table 4. It is obviously seen from Table 4 that the latter stage periods had much weaker rejections of the null hypothesis for individual test statistics. However, Thailand, the Philippines, and Malaysia show weaker evidence against the martingale than those of the other markets when sign S1 test statistics are considered.
Another alternative approach to examine the martingale hypothesis is the wild bootstrap variance ratio test suggested by Kim (2006), which does not rely on asymptotic approximations. Table 4 displays the results of wild bootstrap Kim’s test. Assuming that heteroscedastic stochastic disturbance term is used, the strongest rejections are for Jordan and Malaysia return index at the 5% significance level. Again, the higher lags (k = 12) exhibit greatly weaker rejections of the null compared with the lower lags for Indonesia, Oman, Tunisia, and Morocco. It is apparent that the null of martingale seems to be accepted for several individual variance tests at high levels at 5% level of significance when the entire sample data set is examined.
Given that the random walk hypothesis requires that the variance ratios for all aggregation intervals selected should equal 1, an alternative approach to testing the null hypothesis is the multiple comparison of all selected variance ratio estimates with unity. To check the robustness of our results, we consider Chow–Denning’s joint tests for all sample periods and sub-periods.
Multiple variance tests for the entire sample period
We consider Chow–Denning (1993) joint tests, which assess whether the estimated values of variance ratio are equal to 1 simultaneously for all displayed lag interval k (Table 5). The Chow and Denning joint tests show that the test statistics for either assuming homoscedasticity or heteroscedasticity are not significant at 5% level, except for Oman and Indonesia. With the exception of Oman, we can assert that the null hypothesis of martingale is visibly violated in the case of MENA stock markets regardless of the nature of the increment assumption possibly because of the negative correlation of increments.
Chow–Denning (1993) Variance Ratio Joint Test Statistics.

Note. MENA = Middle Eastern, North African; KSA = Kingdom of Saudi Arabia. M1 and M2: Lo and MacKinlay test statistics assuming, respectively, homoscedasticity and heteroscedasticity; R1 and R2: Wright’s (2000) rank test statistics; S1: Wright’s (2000) sign test statistics; MV*: Kim’s (2006) wild bootstrap test statistic.
Results indicate that the rank R1 Wright version of the variance ratio test generates consistent results compared with R2 and S1 tests. Interestingly, it appears that the martingale is accepted for the Morocco market at 1% significance level by R1, but not by R2 and S1 tests. On the contrary, Wright (2000) claimed that rank R1 and R2 tests are as powerful as the sign S1 test. Moreover, the estimated p -values associated to the Chow–Denning joint test for R1, R2, and S1, obtained using the SMM, are below .05 for all indices. A multiple comparison of the set of variance ratio estimates shows that none of the indices shows a martingale on the basis of the sign S1 and rank R1 and R2 variance ratio tests at 5% significance level (Table 5). An apparent contradiction with the previous results is possibly due to the fact that the conventional variance ratio test of Lo and MacKinlay is less powerful than Wright’s (2000) rank- and sign-based test.
Table 5 reports, however, the Chow–Denning joint test and the associated p -value for the wild bootstrap test. The results partly question the previous findings. Based on the p- values of the multiple comparison test, all the examined return series diverge from the martingale behavior, given that at least one variance ratio statistic is statistically significant at a 5% significance level. It should be noted that Chow–Denning joint test applied for all test statistics (M1, M2, R1, S1, and MV*) reported for the examined equity markets gives rise in general to reasonably consistent inferences for Israel, Egypt, Jordan, Thailand, the Philippines, and Malaysia. However, an apparent divergence among the five test statistics is observed for five individual countries, namely Tunisia, Saudi Arabia, Oman, Morocco, and Indonesia, where the behavior of adjusted return indices seems to be described by a martingale difference sequence at 1% level of significance. It seems that the martingale is accepted for Omani market at 1% significance level by M1, M2, and MV* tests, but not by Wright’s R1, R2, and S1 tests. The same divergence among the five test statistics is observed for Indonesia where the martingale is accepted only by M2 and Kim’s MV* tests (Table 5). The sources for these inconsistencies are evident to determine such as those for Tunisia and Morocco, as it is likely that Wright’s version and Kim’s MV* variance ratio tests are more powerful than the asymptotic tests of Lo and MacKinlay.
Despite traces of a martingale behavior at high horizons in the context of individual variance ratio tests, the overall conclusions soundly reject the martingale hypothesis for all indices at 5% significance level. Jordanian, Omani, and Indonesian return series do not show a martingale property although they displayed a unit root component (Ng & Perron [2001] test). To summarize, given the improved power and size properties of Kim’s (2006) tests, it is apparent that the null of random walk hypothesis is rejected for the considered individual emerging markets at the 5% level significance. Our findings indicate the empirical invalidity of weak-form efficiencies of both emerging equity markets in MENA and Asia if the entire period is examined.
Multiple variance tests for sub-periods
For robustness, the same statistical tests were conducted on different data sets. To eliminate the possible distortion of the Asian financial crises of 1997, the data set was divided into several groups before and after the crises. 2 Although the variance ratio test implies a non-random behavior of the whole sample, the rejection is not as strong as it is for some examined sub-periods. To further examine this observed trend, variance ratio tests were applied at different time scales in the context of the emerging MENA and Pacific Basin equity markets. Table 5 shows the results from the multiple variance ratio tests for the overall sample and sub-periods. This result must be interpreted with caution due to the relatively small sample size.
It is clear that all the test statistics M1, M2, R1, R2, S1, and MV* of Oman, Egypt, Saudi Arabia, and Morocco are not statistically significant at 5%. We find insignificant enhancement in the market efficiency of those markets despite the efforts by regulators. Moreover, MENA markets are not apparently influenced by the Asian crisis.
For the Tunisian market, with only two exceptions, we reject the martingale hypothesis for the entire period and post 2000 sub-period. Our results suggest that there is stronger evidence of martingale behavior for the sub-period 1992-1996 compared with the later sub-period 1997-2000. This may be due to the market reorganization in 1994, the financial liberalization in 1995, and the installation of the electronic trading in 1996. It seems that BVM (Bourse des Valeurs Mobilières) return series show some signs of martingale behavior for the sub-period 1997-2000 mainly because of the privatization reforms undertaken in 1998.
Amman Stock Exchange return index does not seem to fluctuate randomly if we consider the whole period 1980-2004. The results suggest that the Jordanian return time series seem to follow a martingale post January 1988. The return behavior that tends to randomness persists until December 2000, before and after market liberalization. The test statistics M2, S1, and MV* are statistically significant at 5% and 10% between 1988 and 1995. Apparently, the financial liberalization (1995), the restructuration of the capital market (1997), along with the privatizations reforms (1996 and 2000) seem to affect the return behavior positively. However, the examined data sets show some signs of non-random behavior in the earlier period and post January 2001.
The three variance ratio tests for Israel soundly reject the martingale hypothesis if the whole data set is used and between 2001 and 2004 at 5%. It is found that the martingale hypothesis is accepted by M1, M2, and MV* but not by Wright’s test at 5% for the sub-period 1997-2000. Outliers occurred during this period in the Tel Aviv Stock Exchange may be related to the imposition of capital control and political instability.
Next, we consider the Indonesian and Thai markets. From Table 5, the martingale hypothesis is rejected for nearly the entire period for the Indonesian market. Before the Asian crisis, the efficiency of the Indonesian market is soundly rejected by all three tests at 5%. However, the martingale hypothesis seems to be accepted by the M1, M2, R1, R2, S1, and MV* after the Asian crisis and the devaluation of the Rupiah between 1997 and 2000. This is probably due to the influential outliers occurred during this period. The same conclusion is evident when the Thai data are used, as the martingale hypothesis is accepted at 5% for the sub-period 1988-1992. M2 and MV* tests show sudden changes in the martingale outcomes between 1988 and 1992. Ranks R1 and R2, and sign S1 tests do not seem affected by outliers. It seems that the Thai capital market has become efficient after the financial liberalization in 1987, implementation of a computerized trading system in 1991, and reorganization of the capital market in 1992. In contrast, the martingale hypothesis for the Thai market is clearly rejected by all the variance ratio tests for the entire period and post-1992 period. The same results are observed both before and after the Asian crisis. It appears that the outliers occurred in the Thai market between 1988 and 1992 were not influential to the outcomes of the variance tests of post 1992.
The martingale three tests of Malaysian market are rejected by the M2 and MV* test statistics before and after the Asian crisis. To test the effect of market liberalization (1988) on the martingale behavior of the Malaysian market, we split the sub-period 1985-1992 into two: 1985-1988 and 1989-1992. Bursa Malaysia seems to follow a martingale behavior before and after the financial liberalization. Surprisingly, Wright test statistics R1, R2, and S1 do not show such unexpected variation. Evidence shows that the non-martingale behavior is found post 1992.
For the Philippine market, all variance tests soundly accept the martingale hypothesis between 1985 and 1992. It seems that the Philippine banking crises (1981-1987) and the financial liberalization have positively affected the Philippine market efficiency. However, the heteroscedastic statistic M2 of Lo and MacKinlay and bootstrap test statistic MV* show unexpected changes after financial liberalization between 1993 and 1996. If the entire data are used, all three tests soundly reject the martingale hypothesis for the Philippine market. Similarly, it is obvious that the martingale hypothesis of the Philippine market is rejected by all the tests before and after the Asian crisis. It appears that the outliers occurred in the Philippine market in early 2001 related to political events were not influential to the outcomes of the test.
To conclude, the market efficiency of MENA and Pacific Basin capital markets does not visibly improve, except temporary sub-periods. Note that there is no market efficiency enhancement toward early 2001. This reveals the ineffectiveness of the reforms undertaken so far. As might be expected, the results before and after the Asian crisis are similar to those of the whole sample, overall pointing to inefficient Pacific Basin stock markets. We conclude that these markets have been inefficient since the early 1980s. Despite the market liberalization measures implemented, 3 the emerging markets of Saudi Arabia, Morocco, Egypt, and Oman have shown little sign of market efficiency as the martingale hypothesis is strongly rejected. These measures contributed to the increase in size and liquidity of these markets. However, from multivariate VR statistics, evidence suggests that emerging equity market indices do not resemble a martingale.
Discussion
We conduct a comprehensive study to explore the dynamics of the martingale behavior over a long period (1980-2004). Our results are consistent with those of prior studies of Omran and Farrar (2006), Al-Khazali et al. (2007), Lagoarde-Segot and Lucey (2008), Bley (2011)and Abdmoulah (2010), indicating that the martingale model does not hold for MENA markets. Correspondingly, our findings revealed a clear departure from the martingale behavior for the entire period and the examined sub-periods. Based on a longer sample set data, the martingale hypothesis is soundly rejected not only for GCC markets but for both MENA and Pacific Basin emerging markets. The considered markets seem to have relatively comparable non-random behavior despite their diverging degrees of development. We extend the findings of Al-Ajmi and Kim (2012) who confirmed that the martingale does not hold for the GCC stock markets at both daily and weekly frequencies. We show that the variance ratio analysis reveal market inefficiencies by largely rejecting the martingale null hypothesis for corrected monthly returns, pointing that such violations could be potentially exploited by market traders. Nevertheless, variance ratio techniques are unable to answer which trading rules can profit from the short-term return predictability. Contrary to the previous literature, we examine the effects of regulatory reforms and Asian crisis on the return martingale behavior over time. MENA and Pacific Basin nations have shown a growing concern in developing their stock markets since the early 1980s, which explains the multiple reforms undertaken to boost their size and liquidity, although the progress toward a martingale model, especially in terms of informational efficiency, remains controversial. It is possible that the reported rejection of the martingale hypothesis in the past may cause the examined emerging markets to become more efficient in recent times after 2004.
Regarding the markets in Malaysia, Indonesia, the Philippines, and Thailand, our findings are compatible with earlier studies by Huang (1995), Magnusson and Wydick (2002), and Hoque et al. (2007) who showed significant mean-reverting and predictable behavior for these four markets since the early 1990s. However, these studies focused on a precise sample period without specifying whether this mean-reverting pattern is simply occasional or structural.
Results for Saudi, Israeli, Malaysian, and Thai markets seem rather surprising. We would anticipate that the biggest and the most liquid markets may exhibit a different behavior that tends toward a martingale. The results from the other markets are so far expected. In sum, size and liquidity criteria are not sufficient conditions to display a martingale process. These results are consistent with markets where stock prices are not instantaneously adjusted to the influx of new information and often subject to pricing inefficiencies (Trabelsi, 2009). It is plausible that the outcome of return predictability is empirically validated overwhelmingly. This is probably due to the relatively low liquidity, thin trading, and asymmetric and incomplete information. The regulatory structure and business traditions implemented in the examined markets were not contributing to reinforce transparency in corporate governance, which might negatively influence the transmission of information in these markets. Additional probable justifications that may have contributed to the inefficiency of GCC markets were given in a latest study by Al-Ajmi and Kim (2012).
Conclusion
The central aim of this article is to test for the martingale property of MENA and Asian stock markets, which is of considerable interest to both finance practitioners and academics. This region includes dynamic economies with increasing stock market volumes. We consider a sample of 11 equity markets of Tunisia, Oman, Egypt, Morocco, Israel, Saudi Arabia, the Philippines, Thailand, Indonesia, and Malaysia. The sample includes stock markets with a diverging degree of development, enabling us to find out whether the acceptance of martingale hypothesis is contingent on the level of equity market development. We conduct a comprehensive research, paying attention to the effects of the regulatory reforms to develop those equity markets and the Asian crisis. This article has explored martingale behavior using standard, multiple, and non-parametric variance tests that are robust to heteroscedasticity and non-normality. The problem of thin trading that typically describes small equity markets was addressed by calculating returns with the Miller et al. (1994) correction procedure.
Our variance ratio analysis suggests that the behavior of the examined return indices tends to change over time. Many markets have experienced sub-periods of efficiency enhancement except Moroccan, Saudi, Omani, and Egyptian markets. It can be inferred from variance ratio analysis that none of the examined monthly return indices in our sample appears to follow a martingale due to the negative correlation in returns. Since the early 1980s, the equity markets in MENA and Pacific Basin have not been weak-form efficient at a significance level of 5%. The pattern of the variance ratio estimates suggests that the considered markets exhibit significant mean-reverting and predictable behavior in their monthly corrected return series for the 25-year period from 1980 to 2004. Moreover, the persistent mean-reverting pattern decisively points toward an inter-temporal informational inefficiency, which appears to be structural. Therefore, successive return movements are serially dependent. Consequently, it is possible that market makers earn abnormal returns by studying the behaviors of historical prices. Our variance ratio analysis shows that the non-martingale behavior of MENA and Pacific Basin does not vary with the level of equity market development. Furthermore, the results reveal the ineffectiveness of the economic liberalization and privatization measures implemented in the early 1990s to the examined markets. Apparently, the reforms undertaken did not contribute to a martingale process. We find insignificant improvement in the variance ratio statistics of Saudi, Moroccan, Omani, and Egyptian markets despite the efforts by regulators. Furthermore, MENA markets are not influenced by the Asian crisis. This offers a prospect for those markets to attract global investors that are concerned with portfolio diversification and portray, at the same time, a veritable defy for the MENA authorities to improve their investment climate through effectual reforms to attract more local and international savings. Our findings call authorities to intensify efforts to deepen these markets. Concomitantly, an adequate regulatory structure that improves transparency in corporate governance along with implanted property rights and diversified financial services may contribute to market efficiency enhancement.
Further research can be conducted to identify the economic and institutional factors underlying our empirical findings and to determine whether or not any pricing inefficiency can be exploited economically to earn a risk-adjusted abnormal return.
Footnotes
Declaration of Conflicting Interests
The author declared no potential conflicts of interest with respect to the research, authorship, and/or publication of this article.
Funding
The author received no financial support for the research and/or authorship of this article.