
Abstract
Little experimental research has investigated how attitudes are formed via direct personal experience within risky environments. This report summarizes the development of Treasure Island (TI), an attitude learning paradigm based on BeanFest. Two studies are reported: The first designed to compare the outcomes of TI with BeanFest; the second to show how a manipulation of risk predictability would affect attitude learning within the paradigm. Study 1 demonstrated sampling and learning asymmetries similar to those seen in BeanFest, although the magnitude of these asymmetries was attenuated by the opportunity for participants to landmark decisions. The manipulation of risk predictability in Study 2 led participants to seemingly form a less accurate representation of the underlying pay-off contingencies; however, a significant negative learning asymmetry did persist. The findings of this research (a) identify TI as a versatile paradigm for the investigation of attitude learning within risky environments and (b) confirm the robust nature of the negative learning asymmetry in contingent-learning settings; but (c) assert that care should be taken when generalizing the findings of BeanFest to ostensibly more variable contexts.
Attitudes have long been considered to be an “indispensable concept” (Allport, 1935, p. 798) within social psychology, and with good reason. It is understood that “ . . . all aspects of responding, including emotions, cognitions, and overt behavior, are infused with the evaluative meaning that attitudes impart” (Eagly & Chaiken, 1998, p. 269). Thus, not only do attitudes color our evaluations of the social environment but they provide us with approach and avoidance motivations to guide our interactions within it (e.g., Cacioppo & Berntson, 1994). Indeed, by virtue of the fact that attitudes label things (i.e., people, issues, and objects) as positive or negative they necessarily have implications for action (Eiser & Fazio, 2008).
However, despite the centrality of the attitude concept to social psychology (e.g., Ajzen, 2001; Eagly & Chaiken, 1993; Fazio & Petty, 2008) and despite the recognition that the majority of our likes and dislikes are learned and not innate (e.g., Rozin & Millman, 1987), the study of how attitudes are initially acquired and shaped by experience has been relatively neglected (Eiser, Shook, & Fazio, 2007).
Furthermore, where research into attitude formation processes has been conducted, this has tended to focus principally on how attitudes are formed through “passive” experience—where opportunities to learn occur independently of an individual’s own behavior (e.g., mere exposure, see Bornstein, 1989; evaluative conditioning, see De Houwer, Thomas, & Baeyens, 2001)—with research into attitude formation in “active” or “experiential” learning contexts receiving less attention (Eiser & Fazio, 2008).
Attitude Formation via Personal Exploration
Actively establishing what (or where) is good/beneficial or bad/costly within a given context (i.e., what should be approached or avoided) necessarily constitutes attitude formation, as we tend to acquire attitudes consistent with our experiences (Eiser & Fazio, 2008). However, active learning scenarios present people with a challenge. The world is a risky place where approach–avoidance decisions are often made on the basis of incomplete or imperfect information, which can lead to errors. For instance, wrongly classifying something as “bad” when it is “good” can mean that something desirable (e.g., appetizing food) is avoided. Misclassifying things as “good” when they are “bad” could mean that undesirable (or even hazardous) things are approached (e.g., unappetizing or poisonous food). Importantly, within active learning scenarios, feedback about things is often tied to approach responses; thus, it is only by taking a risk and actively sampling or exploring the environment that we have the opportunity to learn and refine our appraisal of it. Remaining quiescent, while often less risky, presents no such learning opportunity.
Thus, when entering a new learning context we must strike a balance between approach–avoidance motivations to facilitate goal pursuit (e.g., finding appetizing food) while minimizing the risk of harm (e.g., eating something disagreeable). Exactly how we strike and refine this balance depends upon a number of factors, including personality factors (e.g., sensation seeking, see Zuckerman, 1994; regulatory focus, see Higgins, 1998) and incentive values (e.g., Liberman, 1993). Ultimately, though, it is often our expectancy about the likely outcome of an approach/avoidance response (based on previous direct of inferred experience) and how consistent this is with their current goals, which shapes such decisions (consistent with expectancy-value theory, for example, Fazio, Eiser, & Shook, 2004; see also Feather, 1988, 1992).
The BeanFest Studies
The gap in our understanding of attitude learning in active learning settings prompted Fazio, Eiser, and colleagues (i.e., Eiser, Fazio, Stafford, & Prescott, 2003; Fazio et al., 2004) to develop the BeanFest paradigm. Based on the principles of reinforcement learning (see Sutton & Barto, 1998), BeanFest is a two-stage computer-based foraging paradigm that investigates how attitudes form and generalize toward new stimuli (in this case beans) where feedback about the nature of stimuli (i.e., whether or not they are “good” or “bad”) is contingent on the sampling decisions of the learner. For details of the procedure, see Fazio et al. (2004) or try BeanFest go to: http://www.millisecond.com/download/samples/v3/BeanFest/.
One of the key findings from studies using BeanFest is how biases in approach behavior tend to result in persistent negative asymmetries in the learning and generalization (see Eiser & Fazio, 2008; Fazio et al., 2004; Shook, Fazio, & Eiser, 2007). In short, because participants are motivated to approach positive beans and avoid negative beans there is a greater likelihood that they will approach and correct false-positives (i.e., believing a bad bean is good) than false negatives (i.e., believing a good bean is bad). This means that correct identification of “bad” beans typically exceeds that of “good” beans (negative learning asymmetry). Moreover, consistent with the “negativity bias” (see Cacioppo, Gardner, & Berntson, 1997; Rozin & Royzman, 2001), participants typically show a bias toward labeling previously unseen beans as “bad,” even after controlling for the differences in the learning of the “good” and “bad” beans (negative generalization asymmetry).
Research using BeanFest has yielded pioneering insight into attitude formation in active learning scenarios and the implications this holds for the understanding of diverse topics, such as prejudice (Deutsch & Fazio, 2008), political ideology (Shook & Fazio, 2009), depression (Conklin, Strunk, & Fazio, 2009), emotional reactivity to stressful events (Pietri, Fazio, & Shook, 2013), and vulnerability to emotional disorders (Shook, Fazio, & Vasey, 2007). However, to date all experiments utilizing BeanFest have focused on attitude learning in perceptively uncertain but objectively stable, prescriptive environments; where stimulus valence is unchanging (i.e., where good beans are always good and bad beans always bad) and where target stimuli are presented sequentially (i.e., where each trial constitutes the presentation of a single bean to participants devoid of other contextual cues that might aid the decision to approach or avoid it).
These parameters pose problems for our broader understanding of attitude formation processes in risky experiential-learning scenarios. For example, our social and physical environments are arguably more variable than presented within BeanFest, with the availability and/or valence of desired resources being altered by our or others’ interactions within them (or by the simple passing of time). For example, Hardin’s (1968) “tragedy of the commons” illustrates how social competition for a limited resource in line with one’s self interests can lead to the overexploitation and rapid decline in the availability and/or quality of that resource. Also, it is not always the case we make sequential, isolated sampling decisions based solely on the features of an individual stimulus, but rather we often concurrently utilize other features or items within the decision-making context to aid or landmark these sampling decisions (e.g., when choosing groceries, for example, Putrevu & Lord, 2001).
Considerable research both in human and in lower-animal subjects exists to indicate how both these (and other) factors can influence real-world foraging and navigation (e.g., Bateson & Kacelnik, 1998; Golledge, 1999; Hunt & Waller, 1999; Kamil & Cheng, 2001; Sorrows & Hirtle, 1999; Weber, Shafir, & Blais, 2004). For instance, cognate research by Goldstone and colleagues (e.g., Goldstone & Ashpole, 2004; Goldstone, Ashpole, & Roberts, 2005; Goldstone, Roberts, & Gureckis, 2008; Roberts & Goldstone, 2006) indicates how human foraging within two-dimensional virtual environments can be negatively affected by the presence of competitors, resulting in sub-optimal sampling behavior (i.e., over- and under-matching of available resources) as participants utilize the foraging decisions of others to help guide their own decisions. With this in mind, one might hypothesize that factors such as the opportunity to landmark one’s sampling decisions could affect the attitude learning and generalization observed within the paradigm.
In sum, while BeanFest studies have proved invaluable in strengthening our understanding of how attitudes form and function in active learning scenarios, the question of whether or not the central findings from this research (e.g., the learning and generalization asymmetries) are generalizable to (a) perceptively more variable contexts, (b) contexts where the opportunity to concurrently reference (i.e., landmark) one’s approach–avoidance decisions against experiences with other stimuli, and (c) other kinds of target stimuli (i.e., going beyond beans) remains open.
The principal aim of the current research was to develop and test a modified version of the BeanFest paradigm capable of simultaneously investigating these things—this was achieved through the evolution of the Treasure Island (TI) paradigm.
The “TI” Paradigm
The TI paradigm (outlined fully below) is purposefully designed to operate in a largely comparable way to BeanFest; however, rather than eating or rejecting beans, participants play the role of an explorer visiting an “island” where they are required to search for treasure (equivalent to eating “good” beans) while avoiding pirates (equivalent to avoiding “bad” beans). The “island” is created by simply overlaying a depiction of a TI across the 10 × 10 matrix used to determine the valence of stimuli within BeanFest. This creates a two-dimensional life-space with three (hidden) positive regions and three (hidden) negative regions (akin to the “good” and “bad” families of beans; see Figure 1). Participants are presented with a full depiction of the TI on all trials and so have concurrent access to all stimuli when making their sampling decisions.

Treasure Island: Highlighted within the island are the six experimental regions (3x positive and 3x negative), which are formally equivalent to the “coordinates” used to generate good and bad beans in BeanFest.( see Fazio et al. 2004).
Thus, in contrast to BeanFest, (a) stimuli are differentiated by their location in the spatial matrix as opposed to their individual features (i.e., shape and speckling of beans), (b) individual sampling decisions can be landmarked against prior experiences at other locations, and (c) because participants can be made to believe that the pirates (negative entities) are either static or mobile, there is an opportunity to manipulate the perceived environmental consistency and hence the anticipated risk associated with sampling decisions. 1
The remainder of this article details the development of the TI paradigm and reports on two studies: the first designed to assess whether or not the paradigm would produce the patterns in sampling and learning common to BeanFest, thus providing a test of whether the findings of BeanFest can be generalized to a new stimulus type (in this case, spatial coordinates) and the second designed to investigate how a manipulation of environmental consistency (specifically the perceived consistency of coordinate valences) would affect participants’ sampling decisions and attitude learning within the paradigm. The article ends with a consideration of the research implications and suggestions for further studies.
Study 1: TI and BeanFest Comparison
Study 1 was designed to test whether or not the TI paradigm would generate similar trends in sampling and learning to those observed in BeanFest. It was hypothesized that the similarities between the BeanFest and TI paradigms should mean that the negative sampling and learning asymmetries typical of BeanFest should emerge. That is, participants should show a greater tendency to approach and correct “false-positive” than “false negative” beliefs within the task, resulting in more accurate learning and recall of the negative coordinates versus the positive coordinates (i.e., negative learning asymmetry).
Method
Participants
A total of 30 (7 male and 23 female) undergraduate and graduate psychology students at the University of Sheffield, United Kingdom, participated in this study. All participants had normal or corrected to normal vision, were aged between 18 and 38 years (Mage = 21.7 years), and received partial course credit or £2 for taking part. Twenty-nine participants completed the sampling phase (none with restarts—explained below).
Procedure
TI was designed on a PC using E-Prime (Schneider, Eschman, & Zuccolotto, 2002a, 2002b). All participants were tested individually in a quiet laboratory cubicle. Upon arrival, each participant was provided with a series of instructions about TI. Participants were informed that the task would comprise two phases: the first taking the form of a “treasure hunt” in which their aim was to accrue wealth by sampling the environment (sampling phase); and a second phase, instructions about which they would receive following the treasure hunt (recall phase). Thus, participants were not informed at this stage that the second phase would constitute a recall task.
Sampling phase: Instructions
Participants were presented with the treasure map (see Figure 1) and told that the computer would sequentially select coordinates for them to sample. They were informed that approach responses (made by pressing “Z” on the keyboard) could meet with one of two possible outcomes, that is, the discovery of Treasure (+10 coins) or a Pirate Town (−10 coins). They were also told that avoidance responses (made by pressing “M”) would have no net impact on their accrued wealth, but that they would not receive feedback as to the valence of the coordinate (i.e., feedback was contingent on approach). 2
Participants were notified that they would start the task with 50 virtual coins and that their coins tally would be updated following each sampling response. There was no upper limit to the wealth that could be accrued (other than that predetermined by the number of trials); however, participants were notified that if they ran out of coins, they would be evicted from the island and receive instructions relating to the second phase of the task. Unlike BeanFest, once participants were evicted from the island they were not restarted, unless their eviction occurred within the first 10 min of beginning the task (i.e., upon receiving the instructions). This 10-min window was introduced to prevent the premature attrition of participants. Participants evicted during this time were restarted minus the initial instructions, whereas participants evicted after this time were thanked for their time and dismissed. 3
In addition to guaranteed course credit or £2 (approx. US $3) for participating, participants’ performance within the game was also tied to a donation to a local children’s charity. Participants were informed that a donation of 50p would be made as a result of their participation and that their final coins tally would be matched with an additional donation (i.e., 1p for every coin). The charity donation concept was introduced as pilot studies revealed that guaranteed course credit was not sufficient to motivate participants within the task.
Participants then received an automated demonstration of a sampling-phase trial, before partaking in a short practice session, comprising six predetermined trials. These six trials presented one preselected coordinate from each of the six regions on the island. Participants were encouraged to approach all six of these coordinates to become familiar with the outcomes of correct and incorrect approach decisions.
Sampling phase: Test trials
The sampling phase had a 3 (Trial Block: 1, 2, 3) × 2 (Coordinate Valence: Negative vs. Positive) repeated-measures design. In each block, the 36 target coordinates (18 × positive and 18 × negative, highlighted in Figure 1) were presented once to participants. The presentation order of the coordinates within each block was randomized except for the first 12 coordinates in Block 1. These trials were fixed across participants (as in BeanFest, see Fazio et al., 2004) to reduce the chance of premature eviction from the island. These trials comprised the presentation of two coordinates from each of the six coordinate clusters.
Following completion of Block 3 (or when the participant ran out of coins), a screen appeared notifying the participant of their eviction from the island. Participants were instructed to inform the experimenter that they had completed Phase 1. The experimenter made a record of their coin tally before providing the participant with details of the second phase of the experiment.
Recall phase: Instructions
Participants were informed that the treasure hunt aspect of the game was over and that their task was now to recall which coordinates were “good” and “bad.” They were told that they would be presented with a series of coordinates and that for each one they should indicate whether they thought it would yield treasure (by pressing “Z”) or a pirate town (by pressing “M”). The computer then recorded whether the participants’ response accurately matched the actual valence of the coordinate. 4
Recall phase: Test trials
On each trial, one coordinate on the treasure map was highlighted. Written instructions then appeared, prompting participants to make their judgment. During the recall phase, the reward and feedback structure of the sampling phase did not apply and participants received no feedback as to the “actual” valence of each coordinate. Participants were required to categorize each of the 36 presented coordinates, as well as estimate the valence of 34 novel coordinates (comprising 26 coordinates adjacent to presented locations and 8 unaffiliated coordinates [A10, D4, E5, E6, F5, F6, G7, J1]). Specifically, participants were instructed to remember the valence of presented coordinates and make predictions about the likely valence of the novel coordinates. It was hoped that responses made within this phase of the game could be used to establish the extent of attitude learning within the paradigm and how readily attitudes might generalize.
This recall assessment provides a subjective measure of participants’ evaluation of stimuli (i.e., coordinates) grounded conceptually within the expectancy-value framework of attitudes (e.g., Fishbein, 1963). As the gaming aspects of the paradigm have ceased (i.e., participants choices no longer reflect approach and avoidance decisions) and participants are simply invited to comment on whether coordinates are “good” (contain treasure) or “bad” (contain pirates), this exercise can be seen as a direct measure of participants’ attitudes rather than a behavioral index thereof. For a full justification of this measure of attitude, see Fazio et al. (2004).
Debrief
Participants were first provided with a short feedback questionnaire asking them to comment on the perceived purpose of the study and whether they had noticed anything particular about the distribution of treasure and pirate towns. Participants were then fully debriefed, thanked, and dismissed.
Results
Sampling phase
A 3 (Block: 1, 2, 3) × 2 (Valence: Negative vs. Positive) repeated-measures ANOVA yielded main effects of both Valence, F(1, 28) = 30.66, p < .001, = .52 (large effect size [ES]), 5 and Block, F(2, 27) = 11.37, p < .001, = .46 (large ES), and a significant Block × Valence interaction, F(2, 27) = 6.45, p < .01, = .32 (large ES). These results confirmed that sampling behavior was roughly comparable with that observed in BeanFest, with a sharp attenuation in the approach of negative stimuli but a relative maintenance of the approach of positive stimuli over time (see Figure 2 for visual comparison with Fazio et al., 2004, experiment 1).

The sampling phase (top) and recall (bottom) data from BF (Fazio et al., 2004; Experiment 1) and TI Study 1.
Recall phase
Participants showed above chance recall for both positive and negative coordinates (ts ≥ 3.08, ps < .01, ds ≥ 1.16; large ESs). This confirmed that participants had successfully established the location of the majority of treasure and pirate towns on the island. A significant negative learning asymmetry was observed, t(28) = 2.06, p < .05, d = 0.39 (small-medium ES), indicating that participants had more accurate knowledge of the negative coordinates on the island (see Table 1).
Mean Recall Accuracies and Adjacent/Non-Adjacent Generalization Tendencies Within Study 1 (S1) and Study 2 (S2).

Proportion of coordinates labeled with same valence as presented neighbors.
Proportion of non-adjacent coordinates labeled as negative.
Generalization
Valence-congruent generalization from both the positive and negative regions to adjacent novel coordinates was found to be above chance (ts ≥ 3.10, ps < .01, ds ≥ 1.17 [large ESs]) and comparable (i.e., there was no negative generalization asymmetry). Responses to the eight non-adjacent coordinates were recoded to reflect the proportion of participants labeled as negative. Labeling of these coordinates was at chance levels (i.e., 0.50), indicating that equal numbers were seen to be positive and negative, t(28) = 1.32, p = ns, d = 0.50 (medium ES; see Table 1). 6
Discussion
Taken together, the trends in approach and recall in this study were broadly consistent with those seen in BeanFest. Participants were able to use the outcomes of their sampling behavior to learn about the distribution of treasure and pirates on the island (and adjust their future approach–avoidance decisions), but a remaining preponderance of incorrect avoidance choices resulted in a more accurate learning of the negative coordinates. In contrast to BeanFest, however, no significant generalization asymmetry was observed within TI.
While still evident, the learning asymmetry within this study was smaller than that observed within BeanFest (see Figure 2). This finding, combined with the lack of a significant generalization asymmetry, is perhaps indicative of the opportunities that participants had to visually reference their decisions within the task. Specifically, in contrast to BeanFest, because TI participants could see all coordinates at all times, it would arguably be easier for them to recognize (and recall the valence of) presented coordinates and distinguish generalization targets as “new.” This should have not only narrowed the expected learning asymmetry but also should have reduced the likelihood of automatic generalization to novel targets based on mistaken identity (i.e., confusing a novel coordinate for a presented one of known valence).
However, despite the apparent advantage offered within TI by the opportunity to visually reference (i.e., landmark) sampling decisions, a significant negative learning asymmetry did still emerge. This finding is of importance as it is indicative of a generalization of the negativity bias in attitude formation inherent to BeanFest, not only to a novel stimulus set (i.e., spatial coordinates) but also to a scenario where the stimuli can be viewed simultaneously, as opposed to sequentially.
Taken together, Study 1 confirmed TI as a viable paradigm for exploring attitude formation, and one that could produce similar sampling and learning trends to those observed in BeanFest. We next sought to investigate how a manipulation of risk predictability might affect these trends.
Study 2: Risk Predictability Manipulation
Risk predictability was manipulated by varying participants’ perceptions of the risk of encountering pirates at particular locations. This was achieved by either informing participants (correctly) that the pirates would remain in their towns (consistent condition), or (incorrectly) that the pirates could roam the island and so turn up in a location that had previously been safe (inconsistent condition). This manipulation was made without the need for actual changes to the underlying matrix (i.e., the pirates did not actually roam), allowing for the direct comparison of participants’ responses in perceptively stable (consistent) and unstable (inconsistent) versions of the same task.
It was hypothesized that participants in the consistent condition should show patterns of sampling and learning similar to those observed in Study 1.
In the inconsistent condition, the belief that outcome contingencies could change was hypothesized to lead to more varied search behavior, especially later in the sampling phase. Specifically, positive locations that had previously been found to contain treasure might be later avoided on the grounds that they may now house pirates. Conversely, locations that had previously been categorized as negative might be later approached on the grounds that the pirates may have moved on.
Overall, we anticipated that the greater perceived unpredictability of the environment should result in generally more sustained approach behavior—and hence greater experience of actual reward and punishment contingencies—but with paradoxically poorer learning of actual valence-location contingencies.
Method
Participants
Seventy (17 male and 53 female) undergraduate psychology students participated. All participants had normal or corrected to normal vision, were aged between 18 and 34 (M = 20.1 years), and received partial course credit or £2 for taking part. Thirty-five participants were assigned to each condition. Of the 35 (10 male and 25 female) participants who took part in the consistent condition, 30 completed the sampling phase (5 receiving restarts). Of the 35 (7 male and 28 female) participants in the inconsistent condition, 30 completed the sampling phase (6 receiving restarts). The following analyses are performed on the responses of the 60 participants who managed to complete the sampling phase.
Procedure
The procedure was the same as that outlined in Study 1; however, the instructions were altered so as to manipulate the apparent mobility of pirates. Specifically, participants in the consistent condition were (correctly) informed that pirates were confined to towns and could not roam the island; while participants in the inconsistent condition were (incorrectly) informed that the pirates could roam the island at will.
Results
Manipulation check
A manipulation check was developed to ensure that the instructions were having the intended effects on beliefs about risk predictability. This constituted the addition of a question to the questionnaire preceding the final debrief, which asked participants to report on the extent to which they felt that pirates on the island were mobile (1 = not at all [very static] to 5 = very much so [roam freely]). The primary manipulation proved successful with participants in the inconsistent condition considering the pirates to be significantly more mobile than those in the consistent condition, t(48.04) = 3.00, p < .01, d = 0.80 (large ES; see Table 2).
Mean Ratings of Pirate Mobility, Coin Availability, and Mean Coin Yield in Study 2.

Sampling phase
Participants in the consistent condition significantly outperformed those in the inconsistent condition. Mean coin yield in the inconsistent condition was lower than that in the consistent condition, t(48.56) = 2.69, p < .01, d = 0.71 (medium-large ES; see Table 2).
Mean positive and negative approach responses within the sampling phase were compared using a 3 (Block: 1, 2, 3) × 2 (Valence: Negative vs. Positive) × 2 (Condition: Consistent vs. Inconsistent) repeated-measures ANOVA. Two significant main effects (Block and Valence), two 2-way interactions (Block × Valence; Valence × Condition), and a 3-way interaction (Block × Valence × Condition) were discovered and are discussed below. The main effect of Condition failed to reach significance, F(1, 58) = 3.36, p = ns, = .06 (small ES), meaning that overall participants in both conditions were engaging in a similar amount of approach behavior across the sampling trials.
The main effect of Valence indicated that, on average, participants were approaching more positive than negative coordinates, F(1, 58) = 72.17, p < .001, = .55 (large ES). The main effect of Block indicated that participants tended to sample fewer coordinates as the blocks progressed, F(2, 57) = 23.80, p < .001, = .46 (large ES). These trends were qualified by the Block × Valence interaction, which showed that levels of sampling of negative coordinates reduced significantly more than sampling of positive coordinates over time, F(2, 57) = 3.70, p < .05, = .12 (medium ES).
The Valence × Condition, F(1, 58) = 7.46, p < .01, = .11 (medium ES), and Block × Valence × Condition, F(2, 57) = 6.70, p < .01, = .19 (medium ES), interactions indicated that trends in sampling behavior differed by condition. Figure 3 illustrates that, while participants in the consistent condition showed the sampling pattern typical of BeanFest (i.e., maintained positive sampling with a decrease in negative sampling), participants in the inconsistent condition showed a relative maintenance in the sampling of both positive and negative areas across time.

Three-way (Block × Valence × Condition) interaction plot showing the proportion of positive and negative approach responses made by participants within the consistent and inconsistent conditions (Study 2).
A t test revealed that the Block 3 sampling asymmetry (B3SA; calculated by subtracting Block 3 positive approach from Block 3 negative approach) in the consistent condition (M = −0.36; SD = 0.36) was significantly greater than in the inconsistent condition (M = −0.09; SD = 0.21), t(47.00) = 3.61, p = .001, d = 0.95 (large ES).
The sampling-phase trends (see Figure 3) appeared to indicate that participants in the inconsistent and consistent conditions were refining their sampling behavior differently as a result of the risk predictability manipulation. To further explore this, a second repeated-measures ANOVA was conducted to specifically contrast the sampling trends between Blocks 2 and 3.
Blocks 2 and 3 analysis
The ANOVA yielded significant main effects of Block, F(1, 58) = 7.34, p < .01, = .11 (medium ES), and Valence, F(1, 58) = 50.90, p < .001, = .47 (large ES). These main effects confirmed that (a) participants were approaching fewer coordinates in Block 3 than in Block 2 and (b) participants were approaching fewer negative than positive coordinates. The main effect of condition was not significant, F(1, 58) = 2.53, p = ns, = .04 (small ES).
While the two-way interactions between Block × Valence and Block × Condition failed to achieve conventional levels of significance (Fs ≤ 1.63, ps = ns, ≤ .03 [small and non-significant ESs, respectively]), the two-way Valence × Condition interaction, F(1, 58) = 8.28, p < .01, = .13 (medium ES), and the three-way Block × Valence × Condition interaction, F(1, 58) = 10.82, p < .01, = .16 (medium ES), did. These latter significant interactions indicated that there was a difference between the consistent and inconsistent conditions in the manner in which positive and negative approach behavior was refined between the second and third blocks.
Paired samples t tests revealed that for the consistent condition, between Blocks 2 and 3, approach of positive coordinates was statistically comparable, t(29) = 0.81, p = ns, d = 0.15 (non-significant ES), whereas approach of negative coordinates significantly reduced, t(29) = 3.30, p < .01, d = 0.60 (medium ES). By contrast, in the inconsistent condition participants’ approach of positive coordinates significantly reduced, t(29) = 2.44, p < .05, d = 0.52 (medium ES), whereas approach of negative coordinates remained statistically comparable, t(29) = 0.35, p = ns, d = 0.05 (non-significant ES).
Mediation analysis: Pirate-mobility manipulation on Block 3 sampling
A mediation analysis was conducted to establish whether the relationship between condition and the size of the B3SA was mediated by the manipulation of perceived risk predictability (i.e., pirate mobility).
Multiple regression analyses were first conducted to assess each component of the proposed mediation model. Condition (dummy coded: consistent = 0; inconsistent = 1) was negatively associated with B3SA, B = −.27, t(58) = 3.61, p < .001, R2 = .18, f2 = .22 (medium-large ES). Condition was positively associated with perceptions of pirate mobility, B = .93, t(58) = 3.00, p < .01, R2 = .13, f2 = .15 (medium ES). The mediator, pirate mobility, was negatively associated with the B3SA, B = −.11, t(58) = 3.72, p < .001, R2 = .28, f2 = .39 (large ES).
Because both the a-path and b-path were significant, mediation analysis of the indirect effect was conducted using 5,000 bootstrapped resamples using bias-corrected 95% confidence intervals (CIs; Preacher & Hayes, 2004, 2008). The direct effect of condition on B3SA reduced in size when controlling for perceived pirate mobility, B = −.17, t(58) = 2.35, p < .05, although remained significant. The mediation analysis confirmed pirate mobility as a partial mediator of the relationship between condition and B3SA, B = −.10, CI = [−0.19, −0.04]. See Figure 4 for the mediation diagram. 7
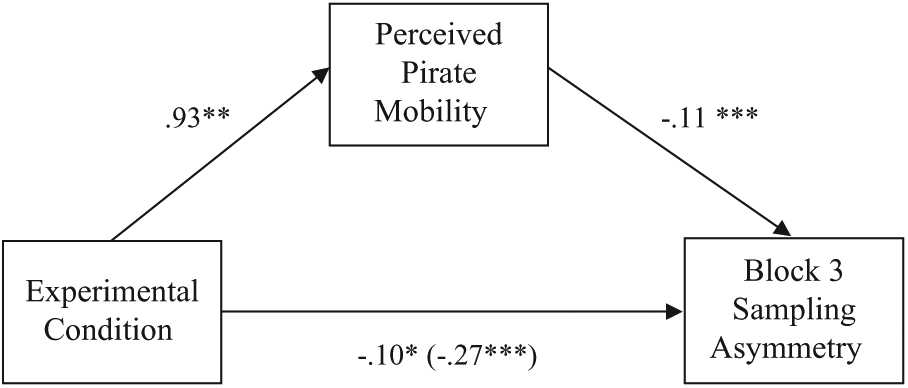
Mediation analysis showing impact of the manipulation of risk predictability (perceived pirate mobility) on the relationship between condition (consistent vs. inconsistent) on the size of the B3SA (Study 2).
Recall accuracy
Participants in the consistent condition showed more accurate recall of positive coordinates, t(53.25) = 2.55, p < .05, d = 0.65 (medium-large ES), than those in the inconsistent condition. There was a similar, although not significant, trend toward more accurate recall of negative coordinates in the consistent condition versus the inconsistent condition also, t(58) = 1.88, p = .06, d = 0.50 (medium ES).
Recall of positive and negative coordinates exceeded chance (i.e., 0.50) in the consistent condition, ts ≥ 4.58, ps < .001, ds ≥ 1.70 (large ESs). While only recall of negative coordinates was above chance in the inconsistent condition, t(29) = 6.34, p < .001, d = 1.70 (large ES); there was also a trend toward greater than chance recall of the positive coordinates, t(29) = 1.93, p = .06, d = 0.72 (medium-large ES).
Participants in both conditions demonstrated evidence of a bias toward more accurate recall of negative coordinates (ts ≥ 2.78, ps < .01, ds ≥ 0.50 [medium ESs]). The size of the negative recall asymmetry was statistically comparable in both conditions, t(58) = 0.75, p = ns, d = 0.21 (small ES; see Table 1 for means).
Block 3 sampling and recall correlations
Correlations were run to see whether “accurate” sampling decisions in Block 3 (i.e., positive approach and negative avoidance) were significantly related to levels of accurate positive and negative recall, respectively. The results of the consistent condition revealed a significant correlation between accurate sampling and both positive and negative recall, rs (30) ≥ .60, ps < .001 (large ESs). Conversely, there was no significant correlation between accurate sampling and recall in the inconsistent condition, rs (30) ≤ .33, ps = ns (medium and small ESs).
Mediation analysis: Pirate-mobility manipulation on coordinate recall accuracy
To assess whether the differences in recall accuracy between the conditions was mediated by the manipulation of perceived pirate mobility, a further mediation analysis was run. This used the mean proportion of accurate positive and negative coordinate recall (mean recall) as the dependent variable.
Initial multiple regression analyses revealed that condition (consistent = 0; inconsistent = 1) was negatively associated with mean recall, B = −.011, t(58) = 2.61, p < .05, R2 = .11, f2 = .12 (medium ES). Condition was positively associated with perceptions of pirate mobility, B = .93, t(58) = 3.00, p < .01, R2 = .13, f2 = .15 (medium ES). Estimates of pirate mobility were negatively associated with the mean recall, B = −.05, t(58) = 3.20, p < .01, R2 = .21, f2 = .27 (medium-large ES).
Mediation analysis of the indirect effect was conducted using 5,000 bootstrapped resamples using bias-corrected 95% CIs (Preacher & Hayes, 2004, 2008). The direct effect of condition on mean recall became non-significant, B = −.06, t(58) = 1.44, p = ns, when controlling for perceived pirate mobility. The mediation analysis confirmed pirate mobility as a mediator of the relationship between condition and mean recall (B = −.05, CI = [−0.092, −0.018]). See Figure 5 for the mediation diagram. 8
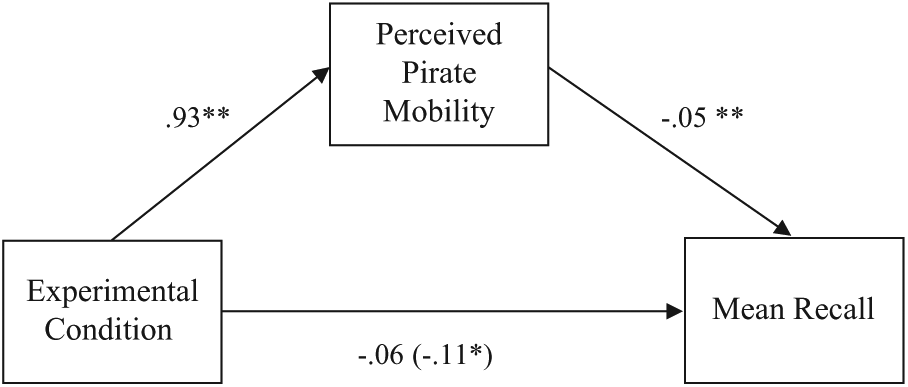
Mediation analysis showing impact of the manipulation of risk predictability (perceived pirate mobility) on the relationship between condition (consistent vs. inconsistent) and mean recall (mean recall) accuracy for presented coordinates (Study 2).
Generalization
Independent samples t tests revealed that participants in the consistent and inconsistent conditions showed equivalent levels of “positive generalization” and equivalent levels of “negative generalization” (ts ≤ 1.66, ps = ns, ds ≤ 0.42 [small-medium ESs]; see Table 1 for means). Levels of “negative generalization” were above chance (i.e., 0.50) in both conditions (ts ≥ 3.25, ps < .01, ds ≥ 1.21 [large ESs]); however, “positive generalization” only exceeded chance in the consistent condition, t(29) = 2.60, p < .05, d = 0.97 (large ES); inconsistent, t(29) = 0.95, p = ns, d = 0.35 (small ES). The positive and negative generalization asymmetry was not significant in either condition (ts ≤ 1.89, ps = ns, ds ≤ 0.29 [small ESs]).
Responses to the eight non-adjacent coordinates were recoded to reflect the proportion that participants labeled as negative. In both conditions, the labeling of these coordinates was at chance levels (i.e., 0.50), meaning that there was no overall negativity bias in the labeling of these coordinates (ts ≤ 0.12, ps = ns, ds ≤ 0.05 [non-significant ESs]). 9
Discussion
The results of Study 2 indicated that the manipulation of perceived risk predictability had, in the absence of any actual underlying change to the TI matrix, prompted marked differences in the sampling behavior and recall accuracy of participants in the consistent and inconsistent conditions.
Participants in the consistent condition showed sampling-phase trends, recall accuracies, and generalization tendencies consistent with having established a reasonably accurate representation of the good and bad locations. While no significant generalization asymmetry was observed (akin to Study 1), there were significant negative asymmetries in Block 3 sampling and recall. These trends indicated how sampling behavior within the paradigm (and hence learning) was being governed by expected outcomes at the presented locations, a result supported by the significant correlations between “accurate” Block 3 sampling behavior and recall within this condition. Consistent with Study 1, it was also evident that the residual preponderance of false-negative beliefs resulted in less accurate recall of the positive coordinates.
By contrast, participants in the inconsistent condition showed evidence of apparently more maladaptive sampling behavior (particularly between Blocks 2 and 3) and poorer recall compared with the consistent condition, suggesting that the risk predictability manipulation had disrupted attitude learning. Indeed, the lack of significant correlations between sampling and recall within this condition suggested that participants were not as readily matching the outcomes of their accurate sampling behavior in Block 3 with congruent recall responses.
Interestingly, while general recall accuracy was lower in the inconsistent condition compared with the consistent condition, a negative learning asymmetry did persist. This asymmetry was ostensibly the result of the risk predictability manipulation having had a marked impact on participants’ learning of positive versus negative locations. We argue that the sampling strategy employed by participants in the inconsistent condition offers an explanation for the retention of this asymmetry.
First, if participants did believe that the island was changeable during the sampling phase, then their resultant tendencies to avoid returning to positive areas (believing them to be negative) and to re-approach negative areas (believing them to be positive) should have served to directly decrease and increase their actual experience of positive and negative location contingencies, respectively. Second, the continued experience of negative outcomes at areas thought to have been vacated by pirates (from an incorrect approach of negative coordinates) should have led to a belief among participants in the inconsistent condition that the environment was negatively biased. Both experiences would have likely inflated negative responding relative to positive responding in the recall phase.
It is clear, then, that the manipulation of risk predictability did have a notable impact on sampling trends and recall responses relative to seemingly more stable versions of the TI task. However, while we contend that the findings from Study 2 support the original hypothesis accompanying this study (i.e., that participants in the inconsistent condition had genuinely developed less accurate representations of the valence-location contingencies relative to those in the consistent condition), there is a competing explanation for the findings that would argue that the detriment shown in sampling and recall within the inconsistent condition was more apparent than real.
Within the sampling phase of the inconsistent condition, for instance, if participants were convinced that the environment was changeable, you might predict that those who had developed an accurate representation of the underlying matrix (perhaps equivalent to that of the consistent condition) should show poor sampling accuracy. In other words, poor sampling accuracy should be expected if participants had established where the good and bad locations were but who were then erroneously updating their approach behaviors based on the assumption that the valence of these locations had changed. 10 Similarly, within the recall phase, if participants were making predictions about the likely future valence of locations as opposed to simply recalling their last experiences at these locations, then this might also be anticipated to artificially lower recall accuracy within the inconsistent condition (this issue is dealt with further in the general discussion).
In sum, while we conclude that the trends in sampling and recall are indicative of participants in the inconsistent condition having poorer learning of the valence-location contingencies, we concede that further research is required to disentangle the extent to which this detriment is genuine.
General Discussion
The present research developed a modified version of the BeanFest paradigm which we used to investigate how people might form attitudes toward spatial location within a perceptively variable active learning scenario (i.e., where the predictability of risk could be manipulated) but one in which they could landmark their approach–avoidance decisions. Study 1 illustrated that trends in sampling and learning in the new TI paradigm were broadly consistent with those seen in BeanFest studies (e.g., Eiser & Fazio, 2008; Fazio et al., 2004; Shook, Fazio, & Eiser, 2007); however, no significant generalization asymmetry was observed. Study 2 revealed how a simple manipulation of perceived (not actual) risk predictability was apparently sufficient to disrupt participants’ learning of the actual underlying valence-location contingencies, although the extent to which this detriment is real or apparent should be resolved through further research.
The results of Study 1 are important in illustrating the generalization of the negative learning asymmetry inherent to BeanFest to (a) an ostensibly easier learning environment (i.e., where participants could landmark their approach–avoidance decisions) and (b) a task using a qualitatively different kind of stimulus (i.e., spatial location vs. beans). We suggest that this is indicative of the robust nature of this asymmetry under perceptively stable conditions.
We argue that the opportunity to landmark approach–avoidance decisions within TI explains the lack of the emergence of a clear generalization asymmetry. Unlike BeanFest, it would have been easier for TI participants to recognize generalization coordinates as new, thus limiting automatic generalization based on mistaken identity (i.e., mistaking a novel bean of unknown valence for a presented bean of known valence due to visual similarities). We contend that this finding is indicative that the generalization asymmetry inherent to BeanFest is, at least in part, tied to the decision to sequentially present stimuli—as people are required to retrospectively recall rather than simultaneously reference their decisions.
The results of Study 2 indicate the apparently detrimental impact that perceived risk predictability has on attitude learning and, in doing so, assert that one should take care when generalizing the findings from BeanFest to situations where the environment and the objects therein are perceptively more variable. Our research suggests that within perceptively variable environments, the translation of experience into learning is slower and less clearly defined than posited by the results of studies employing the BeanFest paradigm. That having been said, even within this perceptively more variable context, the negative learning asymmetry common to BeanFest did still emerge. We argue that this finding is thus indicative of the transferability of this asymmetry to perceptively less stable learning contexts.
Paradigm Limitations and Future Research
While the research outcomes from these studies may hold some relevance for our understanding of judgment and decision making (JDM) in risky situations (for a discussion of the research challenges in this field, see Rakow & Newell, 2010) and human foraging behavior (e.g., Goldstone & Ashpole, 2004; Goldstone et al., 2005), we reason that they are most valuable for (a) enhancing our understanding of “active” attitude formation within ostensibly variable environments and (b) producing a tool for further expanding our understanding of this under-researched field of psychology. However, bearing in mind the novelty of this paradigm and the limitations in the studies outlined, there remains a number of interesting research opportunities in this area. We outline a few of these below.
Changes to the task instructions
Obedience to authority
Building on the early findings of Fazio, Eiser, and colleagues (Eiser et al., 2007; Fazio et al., 2004, Experiment 5), these studies highlight the influence that an individuals’ beliefs about a learning environment can have on their perception of actual reinforcement contingencies experienced. Notably, within the inconsistent condition, participants appeared to give greater credence to the expected outcomes (based on the indirect information provided at the start of the task), rather than their directly experienced outcomes at these locations. Indeed, within this condition people were seemingly less able to overcome the (incorrect) advice provided to them before commencing the task, resulting in significantly poorer performance.
It is possible that this finding is related to the fact that the task instructions came from the experimenter, whom participants perhaps saw as either an expert and/or as unlikely to provide incorrect information. It could be hypothesized that if the instructions was seen as coming from a less authoritative source (e.g., other participants, for example, Eiser et al., 2007; Fazio et al., 2004) that people might have more quickly overcome the inaccuracies in the advice provided and would thus show sampling and recall patterns consistent with better learning.
Equally, however, this finding may stem from a conflict between motivation and learning within this perceptively more complex version of TI (see discussion of Yerkes-Dodson Law, for example, Hanoch & Vitouch, 2004; Liberman, 1993; Teigen, 1994). Specifically, the perceived complexity of the inconsistent condition could have led participants to complete the task in a narrower, more piecemeal fashion than those in the consistent condition. This might have resulted in a kind of “confused chasing” of individual pay-offs and difficulties in recognizing the broader regional contingencies present within the life-space (see Ert & Erev, 2007).
We argue that a formal investigation of (a) how the perceived source of the instructions and advice within the task influences sampling and recall trends and (b) the interactions between motivation and attitude learning within a TI or BeanFest type scenario could provide fruitful avenues for future research in this field.
The impact of inconsistency: Poorer learning or experimental artifact?
We have concluded that the manipulation of risk predictability in Study 2 led to a poorer leaning of the actual location-valence contingencies among participants in the inconsistent condition as compared with the consistent condition. This conclusion would appear to fit both with the more indiscriminate sampling and poorer recall accuracy shown in this condition. However, we have also discussed the possibility that the detriment within the inconsistent condition could be more apparent than real. This alternative explanation could be strengthened by limitations in the instructions accompanying the recall task.
In short, while the instructions accompanying the recall task asked participants to remember which areas were “good” and “bad” (i.e., insinuating that the participants should recall their last experiences at each location), it is possible that some participants believed that this instruction was asking them to predict future outcomes at each location (as was the case of novel coordinates presented during this phase). If this was the case, and if those in the inconsistent condition maintained a belief that the environment was changeable, then this could help to explain the lower recall accuracy in this condition. That is, while participants in both conditions may have had an equivalent appreciation of the pay-off matrix at the end of the sampling phase (i.e., may have shown equivalent learning), those in the inconsistent condition may have been less trusting of this knowledge in predicting future experiences at given locations. Thus, if these participants’ recall responses were reflective of anticipated future outcomes at visited locations (not intended) rather than their most recent experience at these locations (intended), this could have artificially lowered recall accuracy in this condition.
Future research could usefully adapt the TI procedure to formally investigate this possibility. This could be achieved by a simple rephrasing of the recall instructions to ensure that participants focus on their last known experience at each location. These responses could then be compared with those from a secondary task where participants are invited more explicitly to make predictions about the future valence of each location. One would anticipate that accuracy should be similarly poor in both “recall” and “prediction” tasks if the risk predictability manipulation has resulted in genuinely poorer learning; but that “recall” should be superior to “prediction” (and on par with responses in the consistent conditions), if the effect of the manipulation is more artifactual.
Creating a more realistic foraging space
Actual versus implied change to stimulus valence
TI is not a traditional foraging paradigm in the sense that participants do not personally navigate the environment to identify resources but are, akin to BeanFest, presented with a preselected series of stimuli in a randomized order. Moreover, within the current studies, the manipulation of risk predictability was achieved through a variations in the information provided to participants only and not through actual changes to the underlying pay-off matrix.
While both factors could be seen to undermine the ecological validity of the findings, these design decisions were purposeful so as to ensure a broad underlying comparability to all test conditions (i.e., all participants had the same potential to have the same experiences within the task). Also, while there was no underlying change to the pay-off matrix, it was reasoned that the predictability manipulation should be self-propagating and would thus not require us to make such changes. Specifically, to the extent that participants were basing their decisions on the expected outcomes, the self-generation and subsequent approach of false-positive beliefs (generated by the manipulation of environmental consistency) should have enhanced the perception of the environment as changeable.
Participants in the inconsistent condition did believe the pirates to be more mobile in comparison with the consistent condition; however, estimates of mobility within this condition were fairly moderate. This is presumably because of the actual underlying stability of the pay-off matrix and the timing of the manipulation check (i.e., the manipluation check took place after the TI task was complete and so participants may have established that the pirates were immobile). It is likely, therefore, that the results of the risk predictability manipulation observed within this research are moderate compared with those that would be expected from studies where the predictability threat is real (i.e., where the pay-off matrix does vary).
Future research should thus investigate to what extent attitude learning is affected within actually variable contexts and/or where participants are more able to select the order in which they experience stimuli, akin to more real-world foraging.
The impact of resource depletion on attitude learning
Real-world foragers must often contend with resource depletion, for example, as inter- and intra-species competition for resources alters the availability of these resources (e.g., Goldstone et al., 2005; Goldstone et al., 2008). Future studies might investigate how resource depletion (i.e., the predictability of reward) might affect on sampling decisions and attitude formation within the paradigm. This manipulation could be achieved either by altering the actual availability of resources (i.e., treasure) on the island or, akin to Study 2, by altering participants’ perceptions about the availability of treasure on the island (e.g., informing them that treasure yielding coordinates might have less/no treasure once sampled).
One key feature of TI that would aid such investigation is that it lessens the rigid “resource-trial” contingency present in BeanFest. As opposed to BeanFest where for each trial participants must choose to approach (eat) or avoid (not eat) individual beans, TI presents participants with spatial coordinates that could feasibly contain variable amounts of a desired resource (e.g., lots of treasure or not much treasure) that could be seen to deplete as a result of sampling decisions.
Investigating individual differences and other applications
The impact of personality and individual differences
The BeanFest and TI studies indicate that attitude learning within contingent-feedback scenarios is (a) related to the approach and avoidance decisions of participants; and (b) influenced not only by the information provided to participants but also by state and trait individual differences (e.g., Conklin et al., 2009; Fazio et al., 2004; Pietri et al., 2013; Shook & Fazio, 2009). For example, Fazio et al. (2004, Experiment 3) showed that priming people to be more promotion or prevention focused within BeanFest resulted in smaller and larger negative learning asymmetries, respectively. Furthermore, Shook and Fazio (2009) discovered that political conservatism related to more avoidant strategies in BeanFest, resulting in a stronger learning asymmetry compared with those with a more liberal political ideology.
The TI paradigm offers further opportunity to investigate how individual differences might interact with attitude learning, particularly within less-predictable contexts. Of particular interest here could be traits relating to an individual’s tolerance of uncertainty; for example, low ambiguity tolerance (Furnham & Ribchester, 1995), high need for closure (Webster & Kruglanski, 1994), and high personal need for structure (Neuberg & Newsom, 1993). These personality characteristics have been linked to a number of impression formation biases (e.g., the correspondence bias and erroneous group stereotyping) as people attempt to ascribe order to their social world (see also Schaller, Boyd, Yohannes, & O’Brien, 1995). Feasibly, the TI paradigm could be utilized to explore how these characteristics might facilitate or impede attitude learning within variable environments, which could have implications for our understanding of prejudice formation and transmission.
Intergroup prejudice
Relatedly, the TI paradigm could provide a better platform for assessing the formation and function of attitudes toward more socially relevant stimuli (e.g., individuals, groups) than BeanFest. The TI theme arguably makes the experimental scenario more social than that presented by BeanFest. That is, rather than approaching and avoiding “beans,” participants enter a dynamic intergroup setting where they run the risk of approaching a threatening group of people (in this case pirates). While variations of BeanFest have been utilized to draw inferences about intergroup processes (e.g., stereotyping; Deutsch & Fazio, 2008), we contend that TI provides a more appropriate conceptual platform for investigating such issues due to the more social nature of the exploratory context,.
Future research could, for instance, focus on how prejudice reduction strategies might affect the formation, maintenance, and transmission of the negative learning and generalization asymmetries common to this research (see Paluck & Green, 2009). One might anticipate that strategies promoting greater openness to interactions with outgroups (e.g., imagined contact; Crisp & Turner, 2009) could serve to increase sampling behavior, thus reducing the size of these asymmetries.
Conclusion
The aim of these studies was to advance understanding of attitude formation processes via direct personal experience within ostensibly risky environments through the development and testing of a new computer-based paradigm based on BeanFest (i.e., TI). The findings of Study 1 support the pioneering research achieved using the BeanFest paradigm, illustrating how an apparent failure to correct for false-negative beliefs results in the emergence of negative learning asymmetry. However, it would appear that provision of an opportunity to visually landmark decisions attenuates the size of this asymmetry and limits the extent of generalization from learning experiences. Meanwhile, the results of Study 2 indicate how a verbal manipulation of risk predictability can serve to disrupt sampling behavior and recall in the task.
Taken together the findings of this research would appear to confirm the robust nature of the negative learning asymmetry in contingent-learning settings but simultaneously argue that care should be taken when seeking to generalizing the findings of BeanFest studies to ostensibly more variable contexts and/or those where participants can more easily landmark their decisions. This is an important finding being that real-world environments are perceptively (and often actually) (a) more changeable than BeanFest asserts; and (b) often offer more opportunity for people to reference their decisions than is provided in the BeanFest paradigm. We hope that TI will be further utilized and developed to further advance research in this presently under-investigated field of attitude research.
Footnotes
Acknowledgements
The authors would like to thank Dr Natalie Shook and the two anonymous reveiwers for their helpful comments on this article and Dr Daphne Kaklamanou for her advice on earlier drafts of this article.
Declaration of Conflicting Interests
The author(s) declared no potential conflicts of interest with respect to the research, authorship, and/or publication of this article.
Funding
The author(s) disclosed the receipt of the following financial support for the research and/or authorship of this article: This research was funded by the Economic and Social Research Council (ESRC) (PTA-020-2003-00103).