
Abstract
With the growth of technology, modernization, and changes in food habits, agricultural cropping pattern of the country has undergone a major shift in the recent past, moving away from the cereal to non-cereal crops cultivation, especially toward the horticulture crops. Horticulture has been one of the fastest growing sectors within the larger agriculture activities in India, and the State of Karnataka is at the forefront in this context. With the help of secondary data and by employing Simpson’s Diversification Index, crop diversification toward horticulture across the districts of Karnataka was explored. Using regression growth trends, the districts have been categorized as high, medium, low, and negative growth trend of horticulture crop area, and the districts have been further regrouped according to their agro-climatic zones. The study found that the districts of Gulbarga, Raichur, Bijapur, Bidar, Koppal, Bagalkot, and Bellary showed a complete diversification toward horticulture crops, whereas the districts of Kolar, Udupi, and Dakshina Kannada were found to be diversified the least. The study also explored that the districts having complete diversification toward horticulture sector were found to have devoted a lesser share of their cultivable area under horticulture crops. Also, most of the highly diversified districts have come under the dry agro-climatic zones and experienced a high growth rate of horticulture crops cultivation from triennium ending (TE) 2002-2003 to TE 2009-2010. However, the lesser diversified districts have got lesser growth rate of area under the horticulture crops, but devoted relatively a higher share of area under the crops.
Introduction
Growth of horticulture sector has been one of the driving forces of overall agricultural development in India (Dev, 2012; Mehta, 2009). Horticulture sector encompasses a wide range of crops, for example, fruit crops, vegetable crops, potato and tuber crops, ornamental crops, medicinal and aromatic crops, spices and plantation crops (Government of India [GoI], 2001). With the growth of technology, modernization, and changes in food habits of the people, the sector has undergone a major shift in the recent past and got a tremendous potential to push overall agriculture growth above the country’s targeted 4% level (Bahadur, 2010). Also, the sector can directly address poverty and food security issues in both urban and rural areas of the developing world (Abou-Hadid, 2005). At present, the sector has, perhaps, become the most profitable venture of all farming activities, as it provides ample employment opportunities and scope to raise the income of the farming community in the country (Choudhary, Singha, & Vishnu, 2013).
Having realized the potentials of the sector, since the Seventh Five-Year Plan, the GoI has made some development initiatives under the horticulture crops cultivation (Chand, 1996; Singh, Nath, Dutta, & Sudha, 2004). Prior to Seventh Plan, the sector was at the dormancy stage as the initiatives were taken mainly for raising the production and productivity of major food grains. Also, major part of the plan budget was utilized to alleviate poverty, improve technological self-reliance, and so on. But, with the onset of Seventh Plan, a sum of Rs. 21.94 crores was utilized for horticulture promotion implemented through 10 sub-schemes, and subsequent efforts were also made to integrate horticulture with agriculture in hilly areas/lands, dry-land areas, and coastal saline areas for diversifying agricultural production and raising incomes and reducing poverty, unemployment, and regional disparities. Also the initiatives that have been burgeoned for the horticulture crops in the Eighth Plan were considered to be a great scope for employment generation (Planning Commission, 1992-1997). As a result, the country has registered as the second largest producer of fruits and vegetables in the world now, next to China. Of the fruits, the country is the largest producer of mango, banana, coconut, cashew, papaya, and pomegranate, and also, the largest exporter of spices. At present, the country ranks the first in productivity of grapes, banana, cassava, peas, papaya, and so on. 1 In terms of area coverage, the area under the crop in the country has increased significantly from 12,770,000 ha in 1991-1992 to 21,825,000 ha in 2010-2011, accounting for a compound annual growth rate (CAGR) of 2.7% in the last 20 years. As of the overall production, during the same period, it rose from 96,562,000 MT to 240,531,000 MT, accounting for a growth (CAGR) of 4.7% (National Horticulture Board [NHB], 2011). At present, India produces 257.2 million tonnes of horticulture crops from an area of 23 million ha. What is significant over the last few decades is that the area under horticulture grew by about 3.8% per annum and its production rose by 7.4% (Chopra, 2013). This signifies that the productivity of horticulture crops has increased significantly in the recent years, in the country.
In this context, the State of Karnataka has achieved a distinction of being the first State in the country to have introduced a separate budget for agriculture during 2011-2012. The Department of Horticulture, Government of Karnataka (GoK; 2013), has launched a program called Suvarna Bhoomi Yojana (SBY), for transforming 0.25 million small and marginal farmers from low-value crops to high-value horticultural crops. Now, Karnataka produces about 17.80 million MT of horticulture from an area of 1.87 million ha, accounting for 7.40% of horticultural production of the country. In the State, major share of production of the sector comes from vegetables, fruits, and plantation crops with 50.88%, 35.25%, and 10.07%, respectively (National Horticulture Mission [NHM], 2013). Although the sector accounts for only 15% of total net area sown, its contribution to gross value of output in the sector was around 40%, and the State is identified as the largest producer of spices, and aromatic and medicinal crops in the country (Planning Board, 2012).
However, until recently, the horticulture crops received very little attention from the policy makers, planners, and investors, not only in the country (Chadha, 1999; Choudhary et al., 2013) but also in the world (Weinberger & Lumpkin, 2007). Horticulture crops in the country covered an area of around 7% of the total cropped area, of which, 2% is under vegetables. Until recently and prior to the development of the sector, it was not recognized separately and was merged with the agriculture sector. But, it got importance with the inception of Seventh Plan, when the production of tea, coffee, and cardamom was adversely affected by the unusually severe and prolonged drought experienced during the years 1981-1982 and 1982-1983 (Planning Commission, 1992-1997).
Moreover, in the State, having seen the potentials of the sector, diversification of agriculture toward horticultural crops has been surged in the recent years (Singha & Chakravorty, 2013). Also, the tendency behind this shift away from cereals to fruits and vegetables has absolutely been the economic factor of the farmers (Mittal, 2007). Nevertheless, in the process of agricultural development, the changes in the land use pattern, crop acreage, and labor use in different agro-ecological conditions cannot be overlooked. According to Purushothaman and Kashyap (2010), these changes have become much more volatile in Karnataka, in the recent past. These observations call for a micro-level understanding of the drivers of such development, to initiate policy changes to address the issues affecting the growth of agricultural sector. Therefore, analysis of cropping pattern, growth and diversification of crops in different districts and agro-climatic conditions might give an interesting picture at the policy level.
Conceptual Framework
As advocated by the Engel’s law, with the growth of urbanization, modernization, and increase in disposable income of the individuals, food consumption pattern gets changed greatly, shifted proportionately more toward the non-cereal crops (Popkin, 1998). As a result, in the recent past, change in cropping pattern from conventional/traditional to high-value cash crops has also been experienced in the Indian agriculture (Singha & Chakravorty, 2013). At the same time, farmers are attracted by the higher market prices of the high-value cash crops. Also, growth of the horticulture sectors is not only enthused by the domestic needs but also by a large quantity of export requirements (Bhattacharyya, 2008; Mittal, 2007), supported by the growth of physical infrastructures, credit mechanism, and land use policies (Weinberger & Lumpkin, 2007).
In the recent years, the issues of arable land depletion, loss of soil fertility, and environmental degradation due to different agricultural activities and excessive human pressure on land have come in the forefront of national debates and academic arena. Traditional crops have little advantage in these areas, and suggestion is being made to diversify toward high-value cash crops, especially the horticulture crops (Chand, 1996; Tout, 1990). Also, due to continuous traditional cereal–cereal cropping pattern, multiple nutrient deficiencies have emerged in the fertile lands. So, high-value cash crops, including horticulture, are encouraged in these areas, which have less pressure on land compared with traditional crops (Das, 2006).
Nevertheless, the decision on cropping system is further narrowed down under the influence of several other forces related to infrastructure facilities, socioeconomic factors, and technological developments. These are all operating interactively at the local- and micro-level. At the farmer’s level, potential productivity and monetary benefits act as guiding principles while opting for a particular crop/cropping system (Das, 2006). Taking into consideration all these factors, including the cost–benefit and economic viability of the crops in the local agro-climatic condition, farmers intend to diversify their cultivation toward the crops that give them higher economic returns. In the process, agricultural diversification toward high-value crops can potentially increase farm incomes, where demand for high-value food products has increased more quickly than that of the cereal crops. However, speedy diversification through these crops is constrained, by and large, by the smallholders-dominated system of the country. In other words, land allocation to horticulture decreases with the size of landholdings (Birthal, Joshi, Roy, & Thorat, 2007).
According to Acharya, Basavaraja, Kunnal, Mahajanashetti, and Bhat (2011), the major driving forces of crop diversification in Karnataka were the per capita income, proportion of urban population, rainfall, average size of holding, market density, and fertilizer consumption. Also, according to Planning Board (2012), the success for achieving high growth rate of horticulture sector in the State depends mainly upon the introduction of new varieties of seed and bridging the gap between actual and potential production through transfer of technology and reducing the post-harvest wastages. In addition to these, marketing system will require a great deal of attention, so that farmers get maximum benefits from their endeavors. Nevertheless, a detailed analysis of growth and diversification of horticultural crops under different agro-climatic zones will facilitate in formulating the sector’s further development. The main advantage of measuring horticulture crops diversification in Karnataka is that it provides a relative strength of the crops grown in the State and ushers policy implication for further development of agriculture sector.
Objective and Method
With the growing popularity of horticulture crops and benefits to the farmers, the GoK has also given due importance in the sector. As a result, a major shift through the horticulture area has been noticed. With these backgrounds, the present study focuses on diversification of horticulture crops, and growth and development of horticulture sector in the State.
The specific objectives of the study are
to analyze the cropping pattern in different districts of Karnataka;
to analyze the magnitude of diversification of horticulture sector in different districts; and
to categorize the districts according to their growth slabs, diversification magnitude, and agro-climatic zones.
To achieve the set objectives, four-step analyses have been made in this article. First, the districts’ share of area under major crops of the State was analyzed. For this, secondary data on area of major crops—cereals, pulses, oilseeds, and horticulture—have been used for the period from triennium ending (TE) 2004-2005 to TE 2009-2010. Second, districtwise share of area and production of horticulture crops in TE 2004-2005 and TE 2009-2010 was estimated. Third, to understand the cropping intensity, Simpson’s Diversification Index (SDI) was constructed for horticulture crops in all the districts of the State, for two time periods 2002-2003 and 2009-2010. Although there are a number of methods to calculate diversification such as Ogive Index and Entropy Index, Simpson Index (modified version of Harfindahl Index) was taken for the present analysis because of its ease of the formulae and understanding. Furthermore, growth rates of area of horticulture crops were estimated by using regression growth trend for the period from 2002-2003 to 2009-2010 and for convenience, the districts have been categorized into four different growth slabs—high (up to 4%), medium (2%-3.9%), low (up to 1.9%), and negative (below 0%). Fourth, to understand the characteristics of the districts’ agro-climatic conditions and their impact on the cropping pattern, the districts were again regrouped based on the agro-climatic zones, growth rates of horticulture area, SDI, and share of cultivable area of the districts to gross cropped area (GCA).
The required data have been collected from the Directorate of Economics and Statistics, Ministry of Agriculture, NHB. The SDI of the districts was estimated by using the following equation:

where n implies horticulture crop area under ith district (1, 2, . . . 29); N implies GCA of the district. Index value ranges from 0 to 1. There is a complete diversification toward the horticulture crops if SDI value approaches 1 or complete specialization (no diversification) of one crop if SDI value approaches 0.
Second, regression growth rate of the area of horticulture crops was calculated by using the following equation:

where Y0 is the present time period, t is the time period in year (1, 2, . . . 10), and r is the growth rate.
Cropping Pattern in Karnataka
Although Karnataka has achieved an impressive growth rate in overall infrastructural development in the country, the development of agricultural infrastructure has not been evenly distributed within the State, and it resulted in regional imbalances in the State (Venkatachalam, 2003). Therefore, development should be inclusive and balanced among the districts. Using composite development index of 39 components, Narain, Rai, and Bhatia (1997) studied district-level development in Karnataka and found a wide disparity within the State. Furthermore, they explored a positive co-relationship between the agricultural growth and socioeconomic development in the State. For the convenience of the analysis, in the present study, the Directorate of Economics and Statistic’s classification of the districts based on the agro-climatic zones has been used (Table 1).
Classification of Districts Based on Agro-Climatic Zones and Their Characteristics.

Note. Bangalore R = Bangalore Rural; Bangalore U = Bangalore Urban; U Kannada = Uttara Kannada; D Kannada = Dakshina Kannada.
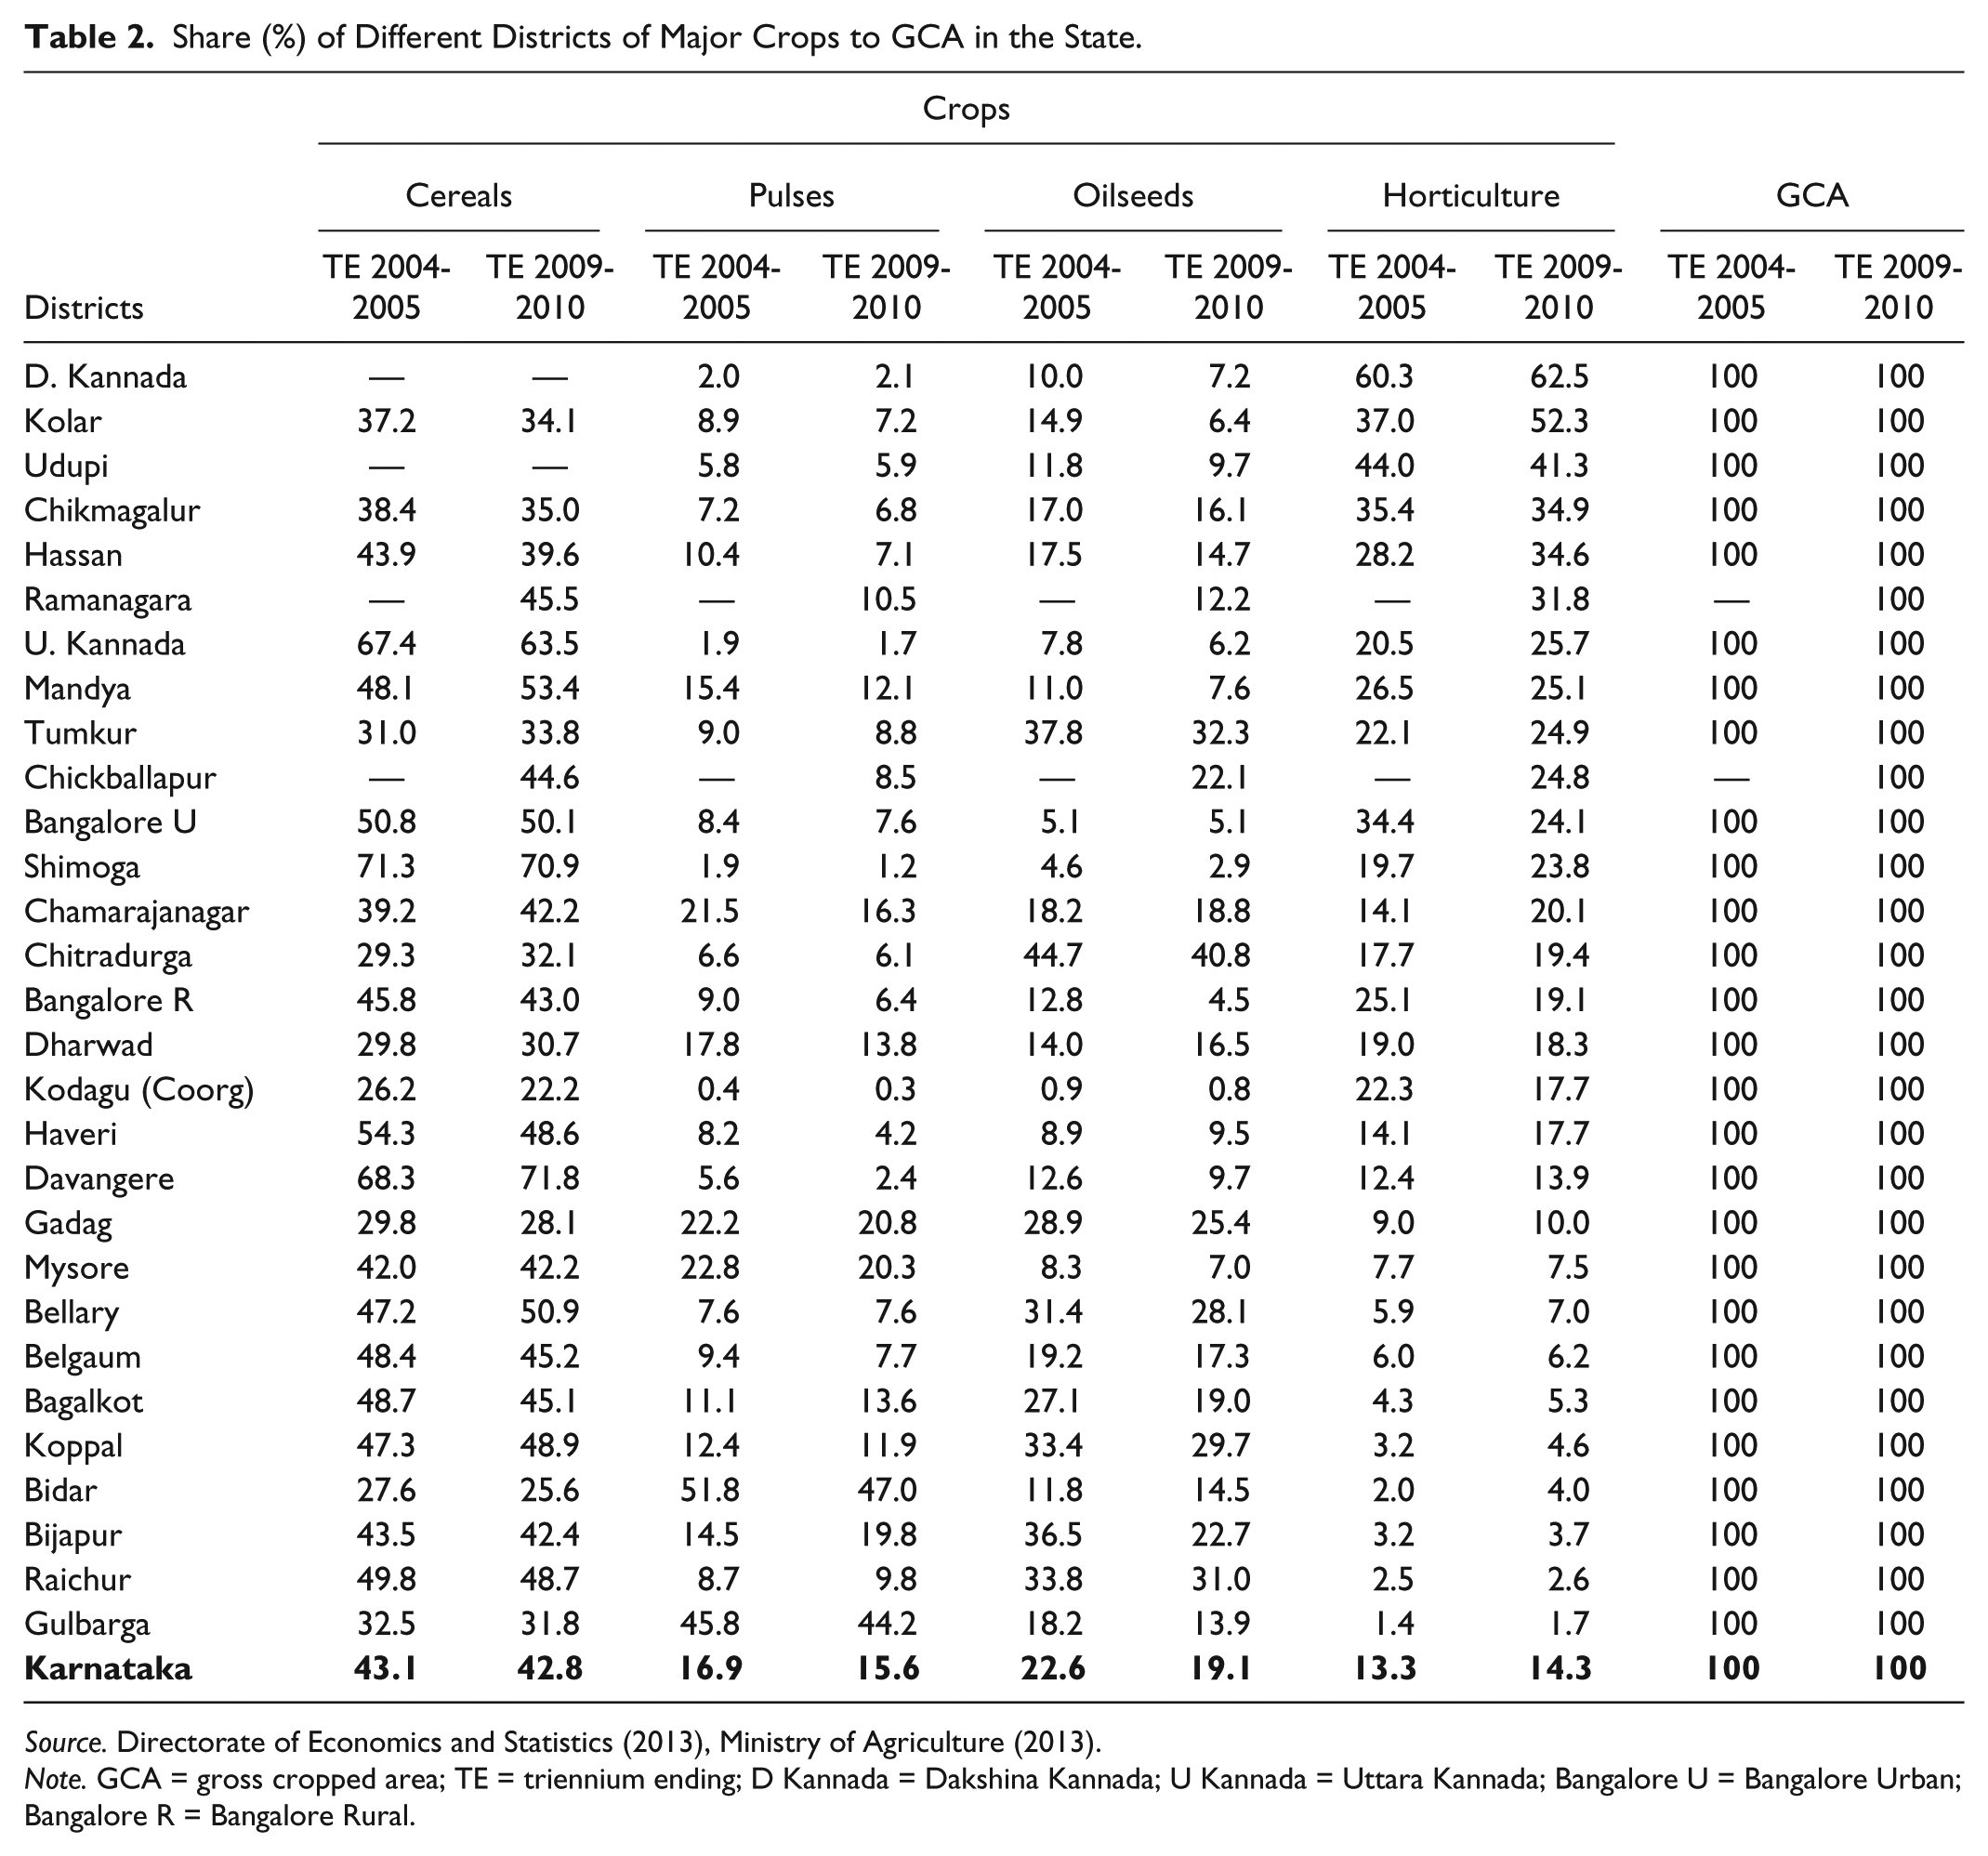
Table 2 depicts the share of districts’ major crop area to GCA. An increasing demand for horticulture crops often stimulated the cropping pattern that shifts toward the horticultural crops in the recent past. One can further observe that the percentage of area under total cereals to GCA in the State has declined from 43.1% to 42.8% between TE 2004-2005 and TE 2009-2010. A similar declining picture was also experienced for the pulses and oilseeds, estimated at 16.9% to 15.6% for pulses and 22.6% to 19.1% for oilseeds during the same period. Albeit it was a marginal change, the area under horticulture crops has increased from 13.3% to 14.3% during the same period. The districts of Davangere, Shimoga, Uttara Kannada, Mandya, Bellary, and Bangalore Urban (U) have devoted their larger share of area under cereal crop, around 50% of the GCA in TE 2009-2010. During the same time, Dharwad, Gadag, Bidar, and Kodagu registered comparatively less share of area under cereal crop. Barring Mandya, Bellary, Davangere, and Chamarajanagar, other districts of the State have shown a declining area under cereals in TE 2009-2010 over TE 2004-2005. In the case of pulses, the districts of Bijapur, Bagalkot, and Raichur have shown an increasing share of area, probably due to increase in area under red gram (Kumar, Kannan, Choudhary, & Vishnu, 2013). Barring the three districts, all other districts have shown a declining share of the crop area during the same period. Although it was declining, the district of Bidar and Gulbarga registered the highest and the second highest share of area under pulses in the State, estimated at 47% and 44.2% of GCA, respectively. Of the oilseeds, though it was slightly declining, the districts of Chitradurga, Tumkur, and Raichur have shown a higher share of area to GCA under the crop. Barring the districts of Bidar and Dharwad, other districts have shown a declining trend under oilseed area.
Share (%) of Different Districts of Major Crops to GCA in the State.
Note. GCA = gross cropped area; TE = triennium ending; D Kannada = Dakshina Kannada; U Kannada = Uttara Kannada; Bangalore U = Bangalore Urban; Bangalore R = Bangalore Rural.
In the case of horticulture, the State’s 13.3% of area to GCA was devoted to the crops during TE 2004-2005 and rose to 14.3% in TE 2009-2010. Of the districts, Dakshina Kannada and Kolar have devoted more than 50% of area (GCA) to horticulture sector in TE 2009-2010, followed by the districts of Udupi, Chikmagalur, and Hassan in the third (41.3% of GCA), fourth (34.9% of GCA), and fifth (34.6% of GCA) positions, respectively, in TE 2009-2010. Besides, Kolar showed a tremendous increase in the area of horticulture, estimated at 37% of GCA in TE 2004-2005, and rose to 52.3% of GCA in TE 2009-2010. Although the districts of Udupi and Chikmagalur have devoted a larger share of cropped area under horticulture in TE 2004-2005, a slight declining trend was witnessed in TE 2009-2010. During the same period, Hassan district experienced an increasing trend of horticulture area from 28.2% to 34.6% of GCA.
Horticulture, Growth, and Diversification of Crops
As we have seen from the preceding section that the shift in cropping pattern through horticulture crops was very significant in the recent past in the State. Statistical estimation of the crops’ growth trend can be seen in the following sections. With this understanding, the present section focuses more on districtwise area and production of horticulture. Furthermore, the present section analyzes the diversification of the crops, especially toward the horticulture crops in different districts. This will also highlight the share of respective districts’ area and production of horticulture crops to State total.
Horticulture Crops in Karnataka
Table 3 shows districtwise share of area and production of horticulture crops and their growth trends over time. Hassan district registered the highest area under vegetable crop with 12.38% of the State total in TE 2004-2005 and slightly increased to 12.97% in TE 2009-2010. However, the district’s share of production of vegetable to State total was 8.49% (third position among the districts) in TE 2004-2005, and further reduced to 3.21% (seventh position) in TE 2009-2010. Kolar district occupied the second position in terms of horticulture crop area in TE 2004-2005, estimated at 11.80% to State total, and slightly reduced to 8.07% (fourth position) in 2009-2010. Nevertheless, the contribution of the district’s production was at the highest, estimated at 20.07% and 12.48% in TE 2004-2005 and TE 2009-2010, respectively. Similarly, the district of Belgaum contributed the second largest share of production of vegetables, estimated at around 10%, albeit the share of area under the crop was around 8% of the State total. In total, Kolar, Belgaum, and Haveri were found to be the major vegetable producing districts in Karnataka in the last few decades.
Districts’ Contribution of Horticulture Area and Production to State Total in TE 2004-2005 and 2009-2010 (in %).

Note. TE = triennium ending; D Kannada = Dakshina Kannada; Bangalore R = Bangalore Rural.
Of the fruit crops, Kolar covered 21.42% of area in TE 2004-2005, declined tremendously to 14.94% in TE 2009-2010. Also, the production share of the district was not as high as area, estimated at around 16% in TE 2004-2005, and further reduced to around 9% in TE 2009-2010. Tumkur and Mandya were the other two districts that registered at around 6% each of fruit area to the State total. In case of production, their contribution to the State total was around 7% to 8%, respectively. Albeit the districts of Ramanagara and Chickballapur were bifurcated/borne newly in TE 2009-2010, their contribution of fruit area and production to the State total was very significant, estimated at around 6% to 9%, respectively.
In the case of spices, around 73% of the State’s total area under the crop was mainly contributed by Dharwad, Haveri, Hassan, and Kodagu during TE 2004-2005, and reduced to 54% during TE 2009-2010. During the same period, these districts accounted for around 59% and 36% of the total State production, respectively. The contribution of area under spices by the districts of Dharwad and Haveri was at the highest and the second highest in TE 2004-2005, estimated at around 31% and 21%, respectively. But, further it decreased to around 20% and 15%, respectively, in TE 2009-2010. However, the shares of production by these States were around 6% and 7%, respectively, in TE 2009-2010. Kodagu, Bellary, and Gadag were also the other districts that contributed significantly in area as well as in production of spices in Karnataka.
Of the plantation crops, Dakshina Kannada and Chikmagalur districts have contributed production of around 11% and 16%, respectively, in TE 2004-2005. These districts still have occupied a larger share in TE 2009-2010, but the order of the districts has reverted—19.94% was contributed by Dakshina Kannada and 12.95% by Chikmagalur. Tumkur district followed in the third position with around 6% and 9% of the State’s total output in TE 2004-2005 and TE 2009-2010, respectively. In the case of area, Tumkur, Chitradurga, Dakshina Kannada, and Chikmagalur districts were in the lead positions, starting from the top to bottom, respectively.
As of the fiber crop, the districts of Haveri, Mysore, and Gadag dominated production share in Karnataka. In terms of area, Haveri district accounted around 13.71% of State’s total area under the crop in TE 2004-2005, and further increased tremendously to around 22% in TE 2009-2010. Also, the production of the district was at the highest, estimated at 14% in 2004-2005 and 21% in 2009-2010. However, Bellary district’s area share to State total has declined from 8.36% to 5.62% during the same period. Similarly, the production of the district has declined from around 9% to 6% during the same time. The district of Dharwad contributed the largest share of area under the crop in TE 2004-2005, estimated at around 19% of the State’s total and slightly reduced to 18% in TE 2009-2010. The districts of Gadag, Mysore, and Raichur were also contributing a significant share of area under fiber crop in the State. On the production side, Dharwad, Gulbarga, Mysore, and Gadag districts were also contributing a larger share to the State total, after Haveri.
In case of medicinal and aromatic crops, Dakshina Kannada, Gadag, Udupi, and Kolar covered a larger share of area under the crop in the State in TE 2004-2005, estimated at around 20%, 14%, 10%, and 7%, respectively. In TE 2009-2010, the districts of Kolar, Udupi, and Gadag covered around 30%, 15%, and 11% of the State total, respectively. In the same manner, these districts registered the first (33%), second (21%), and third (18%) largest share of production of the crop in the State during the same period. The share of area covered by the district of Dakshina Kannada has declined from 20% in TE 2004-2005 to 6% in TE 2009-2010, also the share of production was declining proportionately more than that of the former, from 16% to 3%. As of the commercial flowers, the districts of Tumkur, Haveri, Chamarajanagar, and Kolar were found to be the major districts, which accounted for the larger share in terms of area and production during the same period in the State in the last decade.
Diversification of Crops
Crop diversification is a strategy to maximize the use of land, water, and other resources and for the overall agricultural development. It provides the farmers with viable options to grow different crops in different agro-climatic conditions, to avoid risk and uncertainty due to climatic and biological vagaries (Acharya et al., 2011). Indian agriculture has been diversifying during the last two decades toward High-Value Commodities (HVCs), mainly the fruits, vegetables, and milk, meat, and fish products. The pace has accelerated during the decade of 1990s. HVCs account for a large share in the total value of agricultural production. Supply and demand side factors coupled with infrastructural development and innovative institutions have driven these changes (Bhattacharyya, 2008). Diversification of crops is also widely taking place in Indian agriculture sector to offer considerable scope for improving the economic viability and in turn, reducing their dependence on the production of primary subsidized agricultural commodities. According to Haque, Bhattacharya, Sinha, Kalra, and Thomas (2010), the agricultural diversification index in 2007-2008 at national level was around 0.27. However, it was slightly higher in Karnataka, estimated at 0.74 in 2002-2003, and further rose to 0.77% in 2009-2010. Based on the SDI, in Table 4, districtwise diversification index toward the horticulture crops was calculated for the two time periods—2002-2003 and 2009-2010. This will indicate the change in index value over the years across the districts.
Districtwise Simpson Index (SI) for Horticulture Crops in Karnataka.

Source. Authors’ estimation from Directorate of Economics and Statistics (2013); National Horticulture Board (2011).
Note. Bangalore R = Bangalore Rural; Bangalore U = Bangalore Urban; U Kannada = Uttara Kannada; D Kannada = Dakshina Kannada.
According to Subramanyam and Sudha (2004), it was found that the small cultivators have allotted more cultivable area toward seasonal horticultural crops, whereas the medium and large cultivators have diverted considerably higher area for perennial horticultural crops compared with that of the small farmers in Karnataka. To verify the proposition, as used above, the SDI was applied in this section as well. From Table 4, we can see that the diversification index toward the horticulture sector of the State has been as high as 0.98 in 2002-2003 and 2009-2010. Of the districts, Gulbarga, Raichur, Bijapur, Bidar, Koppal, Bagalkot, Belgaum, Bellary, and Mysore have shown a complete diversification (index value 1) of horticulture sectors. It implies that these districts have completely diversified through different horticulture crops (such as vegetable, fruit, spices, etc.) in the two periods given above. Furthermore, the horticulture diversification index values of the districts were not found to be fluctuating throughout the period. The interesting picture that has emerged from the analysis is that the highly diversified districts have come under rain-fed and dry zones. Simpson Index values for districts of Dakshina Kannada, Kolar, and Udupi that got better irrigation facilities in the State turned out to be quite low compared with that of other unirrigated districts in the State.
Brief Findings of the Study
From the statistics provided in the tables and the discussions made above, we can analyze that the diversification toward the horticulture crops in the State was found to be quite high. In the present analysis, the districts have been classified into four slabs, depending on their horticulture area growth rate—high, medium, low, and negative. Table 5 shows that the districts having complete diversification (index value 1) toward the horticulture sector devoted relatively a less share of their area under horticulture crops. These districts, barring Belgaum, have come under the dry agro-climatic zones and most of them experienced a high growth rate of area under the crop. However, the lesser diversified districts were found to have devoted relatively a high share of area under the horticulture crops. It implies that the districts devoted higher share of area under the horticulture crops have got lesser diversification value, and cultivating mainly the perennial horticulture crops or long-gestation crops.
Districtwise Growth of Area (TE 2002-2003 to TE 2009-2010), Diversification Index, and Horticulture Area to GCA in Different Agro-Climatic Zones in Karnataka.

Source. Authors’ estimation from Directorate of Economics and Statistics (2013); National Horticulture Board (2011).
Note. GCA = gross cropped area; TE = triennium ending; U Kannada = Uttara Kannada; Bangalore U = Bangalore Urban; Bangalore R = Bangalore Rural; D Kannada = Dakshina Kannada.
Share in 2009-2010.
implies statistically significant at 5% and 10%, respectively.
When we look into the districtwise growth of horticulture area and diversification intensity in different agro-ecological zones, seven districts that have devoted a larger share of area under the horticulture crops were found to have got lesser growth rate of crops’ area and lesser diversified over the years. These districts have come under dry zones. Among seven districts, Bidar, Koppal, Bagalkot, and Bellary were found to have completely diversified (SDI value 1) toward horticulture crops, but the shares of horticulture area to GCA of these districts were found to be relatively less than that of the less diversified districts. While the other three less diversified districts—Chamarajanagar, Shimoga, and Uttara Kannada—have devoted their larger land share to horticulture crops.
Of the medium growth slab, nine districts were covered, and of them, three—Gulbarga, Bijapur, and Belgaum—were found to have completely diversified. However, their share of area under horticulture to GCA in 2009-2010 was relatively less than that of low diversified districts. But, of the three completely diversified districts, the growth rate of area under horticulture of Belgaum district in the last decade was found to be statistically significant. Furthermore, we can see that the districts categorized under the medium area of horticulture growth slab have come under dry zone areas, barring Belgaum and Haveri. Similarly, the districts that have been categorized as less diversified, however, were found to be devoting a higher share of area under horticulture crops.
Based on the growth trend in the last decade, seven districts have come under low growth slab of horticulture area. Of the seven, only Raichur was found to be completely diversified, but its share of area to GCA was again very less. Under this growth slab, the districts of Kodagu and Chitradurga were also found to be highly diversified, but the area growth trend was not found to be statistically significant. However, the other low diversified and low area growth districts were found to be statistically significant, but have devoted a larger share of area under the horticulture crops. To be precise, under the low growth slab, the least diversified district—Dakshina Kannada—comes under the coastal zone but the share of area under horticulture was at the highest with 62.5% of GCA. In case of the negative growth slab, five districts have come under this category, and none of them was found to have complete diversification. However, the shares of area under horticulture covered by these districts were found to be very large.
Conclusion
With the growth of technology, modernization, and changes in consumption pattern, Karnataka agriculture has undergone a major shift in the recent past, moving away from the cereal to non-cereal crops cultivation, especially toward the horticulture crops. Horticulture has been one of the fastest growing sectors within the larger agricultural activities in the State. Overall change in the area under horticulture cultivation in the State between TE 2004-2005 and TE 2009-2010 was found to be at the highest, estimated at 15% compared with 5.6% of cereal crops during the same period. However, growth trends of area under pulses and oilseeds were found to be negative, estimated at −1% and −10%, respectively. At present, the State produces about 17.80 million MT of horticulture crops from an area of 1.87 million ha, accounting for 7.40% of horticultural production of the country. Although the sector accounts for 15% of total net area sown in the State, its contribution to gross value of output in the sector was around 40%. Also, Karnataka is the largest producer of spices, and aromatic and medicinal crops in the country.
Within the horticulture sector, vegetable crops have contributed the largest share of area and production in the State in the recent past. Albeit the production of plantation and fiber crops occupy a larger share of area to GCA, their contribution to State’s total production was not very impressive. Although the State’s share of fruit area to GCA was not very significant, its contribution to total production in the State was at the highest within the horticulture crops. Among the districts, Kolar, Tumkur, Hassan, Chikmagalur, and Haveri have contributed a larger share of area and production of horticulture crops in Karnataka. Also, the contributions (growth trend) of the districts of Uttara Kannada, Mandya, Dakshina Kannada, and Dharwad, in terms of area and production, have been very statistically significant. Of the individual horticulture crops, vegetable was mainly contributed by the districts of Hassan, Belgaum, Kolar, and Kodagu. In the case of fruit, the districts of Kolar, Tumkur, and Mandya have contributed the lion’s share of State total output and export.
In the case of diversification toward the horticulture crops, the districts of Gulbarga, Raichur, Bijapur, Bidar, Koppal, Bagalkot, and Bellary have shown complete diversification. However, the districts of Kolar, Udupi, and Dakshina Kannada were found to have diversified the least. The study further explored that the districts that had experienced complete diversification toward the horticulture sector devoted a lesser share of cultivable area under horticulture. Also, most of these districts (highly/completely diversified) have come under the dry zones and experienced a high growth rate of area. On the contrary, the districts with a lesser diversified and lesser growth of area under the crop have devoted a larger share of area to GCA. It is believed that the districts which have devoted a higher share of area under horticulture with lesser diversification might be cultivating more perennial or long–gestation period crops.
Footnotes
Declaration of Conflicting Interests
The author(s) declared no potential conflicts of interest with respect to the research, authorship, and/or publication of this article.
Funding
The author(s) received no financial support for the research and/or authorship of this article.