
Abstract
Socially desirable responding presents a difficult challenge in measuring personality. I tested whether a partially ipsative measure—a normatively scored Q-sort containing traditional Big Five items—would produce personality scores indicative of less socially desirable responding compared with Likert-based measures. Across both instructions to respond honestly and in the context of applying for a job, the Q-sort produced lower mean scores, lower intercorrelations between dimensions, and similar validity in predicting supervisor performance ratings to Likert. In addition, the Q-sort produced a more orthogonal structure (but not fully orthogonal) when modeled at the latent level. These results indicate that the Q-sort method did constrain socially desirable responding. Researchers and practitioners should consider Big Five measurement via Q-sort for contexts in which high socially desirable responding is expected.
Keywords
Introduction
Socially desirable responding is often thought to affect psychometric tests—particularly Likert measures (Hough & Oswald, 2008)—and it is unclear whether it can be partialled or adjusted out of a measure after the measurement has been obtained, typically via a social desirability scale (Podsakoff & Organ, 1986; Spector, 2006). One strategy to deal with socially desirable responding is to look for alternative measurement methods that will constrain this behavior while still allowing for meaningful measurement of non-cognitive constructs. I believed that, for a number of reasons described below, a Q-sort containing traditional Big Five items would represent a useful method to constrain socially desirable responding.
In the interest of precision, I note that socially desirable responding is distinct from the trait of social desirability as commonly measured (Zerbe & Paulhus, 1987). A crucial implication of this distinction is that trait-based measures of social desirability may not capture socially desirable responding on non-cognitive measures to a large degree. The situation strength of a given context can be an important consideration in determining whether a given response pattern is more likely to be influenced by socially desirable responding. In contexts to respond honestly (i.e., conditions of many personality research paradigms), response elevation or strategic responding that deviates from honest responses generally would only be expected for those with a high level of social desirability as a trait. However, in applied, high-stakes contexts, such as applying for a job, the situational forces are much stronger, and many test-takers—not just those high in trait social desirability—would be expected to engage in strategic responding, faking, or what I term socially desirable responding. It is in these contexts that alternatives to Likert-type scaling have been sought for decades.
One proposed advantage to non-cognitive trait measurement via Q-sort is that this format reduces the potential amount of socially desirable responding in the measure. For example, it is fairly easy to strongly agree with each positive item and strongly disagree with each negative item on Likert measures (i.e., socially desirable responding and/or faking) if one chooses to do so. It is typically not possible to do this with every item in a partially ipsative measure such as a Q-sort—although it is possible to strategically choose some items and scales (McCloy, Heggestad, & Reeve, 2005)—as each item placed in the strongly agree pile reduces the probability that any of the remaining items can be placed there. For example, if a job applicant assumed that a sales job would require a high level of extraversion, that person could selectively place items measuring extraversion toward the most like me side, and by extension, negatively worded extraversion items to the least like me side. However, this would come at a cost, because the distribution in a Q-sort is fixed, and those slots could not be occupied by items for other potentially desirable personality traits either, such as conscientiousness. This process demonstrates the issues that might arise when introducing ipsativity into a measure.
Degrees of Ipsativity
As defined by McCloy et al. (2005), the crucial feature of an ipsative measure is that the total score is constant for all individuals. One proposed advantage to ipsativity is that it reduces the potential amount of socially desirable responding in the measure. One key feature of any non-Likert measure is the level of ipsativity introduced by the method in which users choose responses. McCloy et al. (2005) distinguish between fully and partially ipsative (or semi-idiographic; Chatman, Caldwell, & O’Reilly, 1999) measures. Partially ipsative measures fix the total score but are multidimensional and allow for flexibility in how the total scores are achieved across dimensions.
The amount of socially desirable responding is inversely related to the level of ipsativity. Highly ipsative measures, such as forced-choice instruments, reduce user control to respond either in honest or socially desirable ways. Forced-choice measures may remove too much user control, as respondents may have multiple items that they feel describe them but must choose only one as most like me. Moderately ipsative measures such as Q-sorts may represent a useful middle ground by providing a modest check on socially desirable responding while still providing enough user control to sort each item relative to all the items in the set.
Another important consideration is the process through which individuals respond to personality items. Likert measures may be strictly non-ipsative conceptually but less so practically. For example, the traditional Likert perspective assumes that personality items are rated independently of other items, and that because of this, correlations between items represent true construct overlap (Cronbach & Meehl, 1955). However, research indicates that this is often not the way people approach non-cognitive measures, as people often perceive such items as redundant (Schleicher, Venkataramani, Morgeson, & Campion, 2006) or as attempts to catch test-takers in a lie (Robie, Brown, & Beaty, 2007). Furthermore, items encountered early in a measure often influence items reached later in the form of anchoring effects (Tourangeau & Rasinski, 1988). Thus, individual responses to personality items are often made relative to the other items in the set, rather than to pure estimates of absolute standing on a particular item.
In other words, Likert-based measures may often behave in a partially ipsative manner, as items can “stick” to each other for reasons other than true construct overlap. One cause for this ipsativity is socially desirable responding, especially in motivated settings (i.e., applying for a job). In these contexts, it may be particularly important to consider a measurement method that constrains socially desirable responding.
Q-Sort Background
As a psychological assessment tool, the Q-sort has a long history. Developed by Stephenson in the 1930s, Q methodology evolved in a contrasting school of thought from the traditional factor analytic process of analyzing correlations between items and/or variables (Block, 1961). It should be noted that the sorting procedure, as used in the current study, is only one component of the measurement and philosophical issues associated with the larger Q methodology. Q-sorts are used in many corners of psychology and can come in many shapes and forms. The basic procedure involves sorting cards/items into piles, usually into a quasi-normal distribution, which can easily be converted into numerical values for each item, but these are the only defining features. Q-sorts can be manual (i.e., a set of cards each with one item) or electronic (see Funder’s extensive work with the Riverside Accuracy Project). Q-sorts can be completed in the form of self-sorts, but in clinical settings, self-sorts are often supplemented or replaced by “other”-sorts (i.e., clinician, friend, family member) of a target person (Funder & West, 1993; Letzring, Wells, & Funder, 2006).
Despite the persistence of Q-sort use in a variety of settings and disciplines, the potential of Q-sorts for normative construct scaling has received little attention. It is unclear exactly why, although the divergent philosophical and psychometric perspectives likely play a role. For example, item generation in strict Q methodology is to be made in a “theoretically neutral form” (Block, 1961, p. 43) and to exclude similar or potentially redundant items. Individuals trained in classic psychometric theory who value clear factor structures and high internal consistency reliability are unlikely to be satisfied with the psychometric properties of Q-sorts developed via strict Q methodology. However, whether Q-sorts can demonstrate these properties when they are developed with the a priori goal of measuring normative traits, as in the current study, has been largely unexplored.
In this study, I test the general proposition that Q-sorts offer a potential measurement middle ground between Likert measures and common non-Likert alternatives with regard to socially desirable responding. Specifically, the use of identical items from Likert measures in a Q-sort can allow for direct tests of measurement method effects on construct validity. To investigate these method effects, I developed my hypotheses around four statistical concepts that can guide inferences of construct validity: mean scale scores, multitrait–multimethod (MTMM) relationships, latent factor structure, and criterion-related validity. If Q-sorts involve a higher level of ipsativity than Likert measures, then socially desirable responding will be more constrained in the Q-sort. By extension, this general proposition—that socially desirable responding introduces score inflation and increased scale interdependence, and that the Q-sort method is less susceptible to this influence—should affect each of these statistical concepts.
Method
Two studies were conducted to test these hypotheses. Study 1 was a pilot study that involved administering both Q-sort and Likert versions of a personality assessment to investigate whether personality items delivered via Q-sort could indeed produce psychometrically sound Big Five data in a typical setting. Study 2 extends the pilot study in two ways. First, to test the primary hypotheses in a condition in which socially desirable responding is likely to be high, participants were instructed to respond to the personality assessments as if they were completing them in the process of applying for a job. Second, to test the criterion-related validity hypothesis, job performance ratings from supervisors were collected.
General Procedures and Measures
In each study, students participated in the study to receive extra credit in psychology courses (Study 1, N = 65; Study 2, N = 370). Each participant completed personality assessments in both Likert and Q-sort format, counterbalanced. The personality items were identical for each method, consisting of the International Personality Item Pool (IPIP) 50-item Big Five measure. The assessments were completed via computer (SurveyMonkey software for Likert and FlashQ for Q-sort) in a campus lab with a proctor present to address any questions. The Q-sort distribution had a quasi-normal shape, as the nine columns in the distribution had spaces for 3, 5, 6, 7, 8, 7, 6, 5, and 3 items, respectively (50 total spaces). The Likert items were also rated on a 9-point scale, and both assessments used identical anchors (not like me and like me). Negatively worded items were reverse-coded for both response formats.
For Study 2, supervisor performance ratings were collected (n = 79). Participants who were currently working were offered additional credit if they provided a contact email address for a direct supervisor who submitted a completed set of ratings. Supervisors were then emailed a link in which to access a brief measure: six items measuring in-role job performance (α = .68; Williams & Anderson, 1991).
The primary difference between Study 1 and Study 2 involved separate instructional sets for participants. For Study 1, in which I was seeking strictly honest responding, participants were given instructions from the IPIP website, in verbal and printed form, generally stating that they were to be honest and that their responses would be kept confidential. For Study 2, I provided “simulated-applicant” instructions based on work by Steiner and Gilliland (1996). These instructions contained verbal and printed directions to picture a desired job, and that the assessments would be used in determining whether the participant would be offered an interview for this job. The instructions were designed to closely approximate the use of personality in selection contexts, in which personality assessments are often delivered in the early stages of a multiple-hurdle selection process.
Study 1 Results
Correlations and internal consistency values can be found in Table 1, with Big Five relationships in the upper diagonal and internal consistency values in the diagonal (honest instructions first). Before addressing the study hypotheses, it was important to determine whether the IPIP items produced acceptable alpha values, as an initial criterion for inferring construct validity involves demonstrating that responses to items within scales are internally consistent (Cronbach & Meehl, 1955).The results suggest that the personality dimensions measured via Q-sort surpass the conventional benchmark for acceptable internal consistency (α > .70), with the lone exception of agreeableness (α = .68). Although encouraging, I note that these values are generally lower than the corresponding alphas for the Likert method. In addition, there is support for Hypothesis 1, as there are fewer significant correlations (and generally lower magnitudes) for the Q-sort when compared with Likert, although the small sample size precludes strong conclusions (and use of structural equation modeling to fully test Hypothesis 1).
Correlations and Descriptive Statistics.

Note. n = 370 for motivated instructions, n = 65 for honest instructions. Upper diagonal for honest instructions, lower diagonal for motivated instructions; values in parentheses are internal consistency reliabilities (honest instructions first, motivated instructions second); values in italics are convergent correlations (i.e., extraversionLikert correlated with extraversionQ-sort). L = Likert and Q = Q-sort.
p < .05. **p < .01.
Convergent correlations can provide an indication of how given scores relate to similar variables, but these may not reflect mean-level scale differences of the Big Five dimensions that could be present in comparisons of different measurement formats. For example, a uniform mean difference between Big Five dimensions measured via Q-sort compared with Likert would not be detected by inspection of correlations. The partially ipsative nature of a Q-sort is expected to generally reduce overall mean scores through restricting the range of responses. Big Five dimension means and standard deviations can be found in Table 2, which also provides within-subjects tests of mean differences by measurement method for each dimension. Regarding Hypothesis 2, the Q-sort mean was lower for each dimension, and significantly lower for extraversion and openness. Although the sample sizes only allow for statistical significance of larger effects, Hypothesis 2 is supported, as Big Five measurement via Q-sort results in lower dimension mean scores. It is also important to note that these differences in means and intercorrelations did not preclude high convergent correlations between Big Five dimensions measured by different methods, as convergent correlations were generally quite high (from ropenness = .71 to rextraversion = .84).
Within-Subjects Tests of Big Five Mean Differences by Measurement Method.
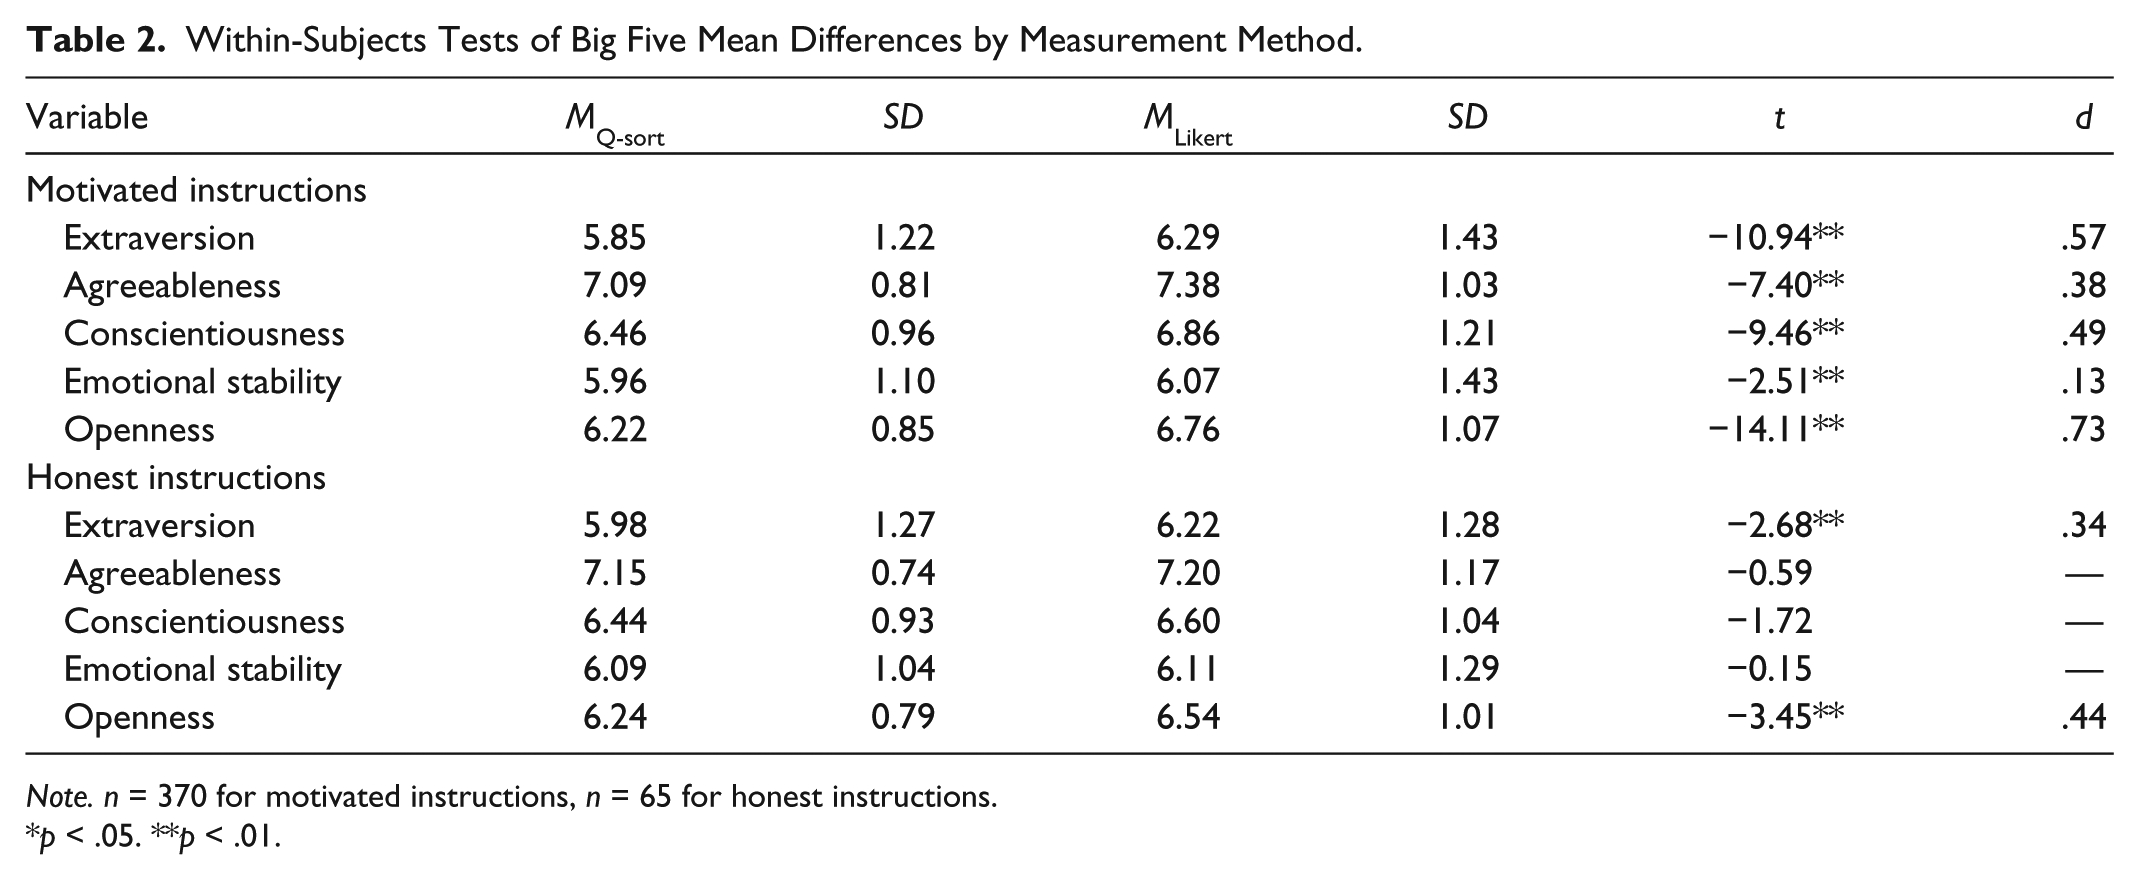
Note. n = 370 for motivated instructions, n = 65 for honest instructions.
p < .05. **p < .01.
Study 2 Results
To replicate some of the findings from Study 1 under conditions in which a larger amount of socially desirable responding would be expected, as well as to present a sample size large enough to test all of the study hypotheses, participants in Study 2 completed the personality assessments under the simulated-applicant instructions.
Dimension Intercorrelations and Latent Variable Structure (Hypothesis 1)
General evidence for replication of the Study 1 findings for Hypothesis 1 can be found in Table 1. A notable pattern is that the Big Five dimensions are more highly correlated when measured via Likert than Q-sort. Each Big Five correlation (10 total Big Five intercorrelations) measured via Likert was statistically significant and of at least moderate magnitude (r > .18). In the Q-sort, only three correlations reach significance. To address whether these results are due in part to the lower internal consistency of the Q-sort format, intercorrelations were adjusted for unreliability (not pictured), and the ratios remained identical. Interestingly, although the intercorrelations within each method differed more drastically than in Study 1, the dimension convergent correlations remained similar in magnitude (ragreeableness = .68 to rextraversion = .84).
A series of confirmatory factor analyses (CFAs) were conducted to model the Big Five dimensions at the latent level, the results of which can be found in Table 3. The first set of CFAs involved modeling the Likert and Q-sort Big Five data separately. Similar to Lim and Ployhart (2006), the first model involved modeling the Big Five dimensions at the item level, with each item specified to load on the appropriate Big Five factor (50 total indicators). This model was suboptimal for both the Likert (poor model fit) and the Q-sort (model failed to converge).
Confirmatory Factor Analyses for Big Five Measures (N = 349).

Note. CFI = comparative fit index; TLI = Tucker–Lewis index; RMSEA = root mean square error of approximation; SRMR = standardized root mean square residual.
Model did not converge
p < .05. **p < .01.
Although item-level indicators are desirable to provide the most interpretable relationships between individual items and latent factor structures, failure to demonstrate acceptable Big Five fit at the item level is common, and items often must be combined, or parceled, into aggregate indicators for Big Five dimensions (Lim & Ployhart, 2006). As such, items were then randomly assigned, similar to Lim and Ployhart (2006), to three parcels per personality trait (parcels of 3, 3 and 4 items, for 15 total indicators per measurement method), with the same items in each parcel for the Likert and Q-sort. Modeling the Big Five structure with parcel indicators resulted in generally acceptable model fit statistics, indicating that both the Likert and Q-sort measures can be mapped onto the a priori Big Five structure when indicators are modeled at the parcel level.
Next, correlations between the Big Five factors were constrained to equal zero. This provides a test of orthogonality, as the Big Five dimensions are often theorized to be largely independent. However, the results indicate, via the chi-square nested model difference test, that imposing orthogonality on the Big Five structure results in significant reductions in model fit for both the Likert and Q-sort measures, although this constraint is much more detrimental to the Likert model. This provides partial support for Hypothesis 1, as the Q-sort format does not produce a purely orthogonal factor structure, but rather a structure that approaches orthogonal relations between most of the Big Five dimensions.
The overall CFA results strongly indicate that when modeled from a latent variable perspective, the Q-sort measure performs quite similarly to the Likert measure. Regarding the orthogonality constraint, the Q-sort performs better. This supports the notion that the partially ipsative nature of the Q-sort improves the orthogonality of the Big Five.
Lower Big Five Scale Scores (Hypothesis 2)
Means for the simulated-applicant instructions can be found in Table 2, and strong support for Hypothesis 2 is provided. Mean differences were found for all five dimensions, with a wide range of effect sizes (d = .13-.73). In no case did a Q-sort Big Five dimension have a mean higher than its corresponding Likert-scaled dimension. The finding of different magnitudes of mean differences by Big Five dimension has implications for research involving socially desirable responding, as this type of responding may involve strategic decisions to inflate certain dimensions over others when assessed via Q-sort.
As noted by an anonymous reviewer, the study design also allows for between-subjects comparisons across instructional conditions. In other words, is there a pattern in the magnitude of differences between honest and simulated-applicant instructions that distinguishes the Likert and Q-sort? Only one significant difference was found, and that was for conscientiousness measured via Likert (t = 2.00, p < .05), although the low sample size and subsequent low power of the analyses suggest potential for a Type II error. The effect sizes are instructive for the Likert (dextraversion = .05, dagreeableness = .20, dconscientiousness = .26, demotional stability = .03, and dopenness = .18) and Q-sort (dextraversion = .11, dagreeableness = .09, dconscientiousness = .02, demotional stability = .11, and dopenness = .01) formats. No clear pattern emerges, as some effect sizes are larger for Likert (agreeableness, conscientiousness, and openness) and some are larger for Q-sort (extraversion and emotional stability).
Higher Criterion-Related Validity (Hypothesis 3)
The primary function of a selection tool is to predict employee performance. To compare the validity of the Big Five measures, regression analyses were in which supervisor in-role performance ratings were regressed on Likert-type and Q-sort scale scores. These analyses were separated by Big Five dimensions, and two models within each dimension were specified: one in which the Likert-type scale is entered first, and one in which the Q-sort scale is entered first. This provides a test for whether one method for measuring a given Big Five dimension “captures” variance that the other method does not.
Table 4 presents the results of the regression analyses. Of the five combinations of Big Five dimensions predicting supervisor in-role performance, three cases show evidence of criterion-related validity for either or both of the assessment methods. In two cases, both the Likert and Q-sort measures independently predict the criterion but do not predict incrementally over the other. In another case, the Likert provides incremental validity over the Q-sort measure. Considering these results together, it appears that neither assessment is more or less predictive of the criteria included, although there are some differences between methods. This is a supportive finding for the Q-sort measure, as the Q-sort generally demonstrates criterion-related validity of comparable magnitude and scope to the Likert measure; however, this also leaves Hypothesis 3 unsupported.
Big Five Predicting In-Role Performance (n = 79).
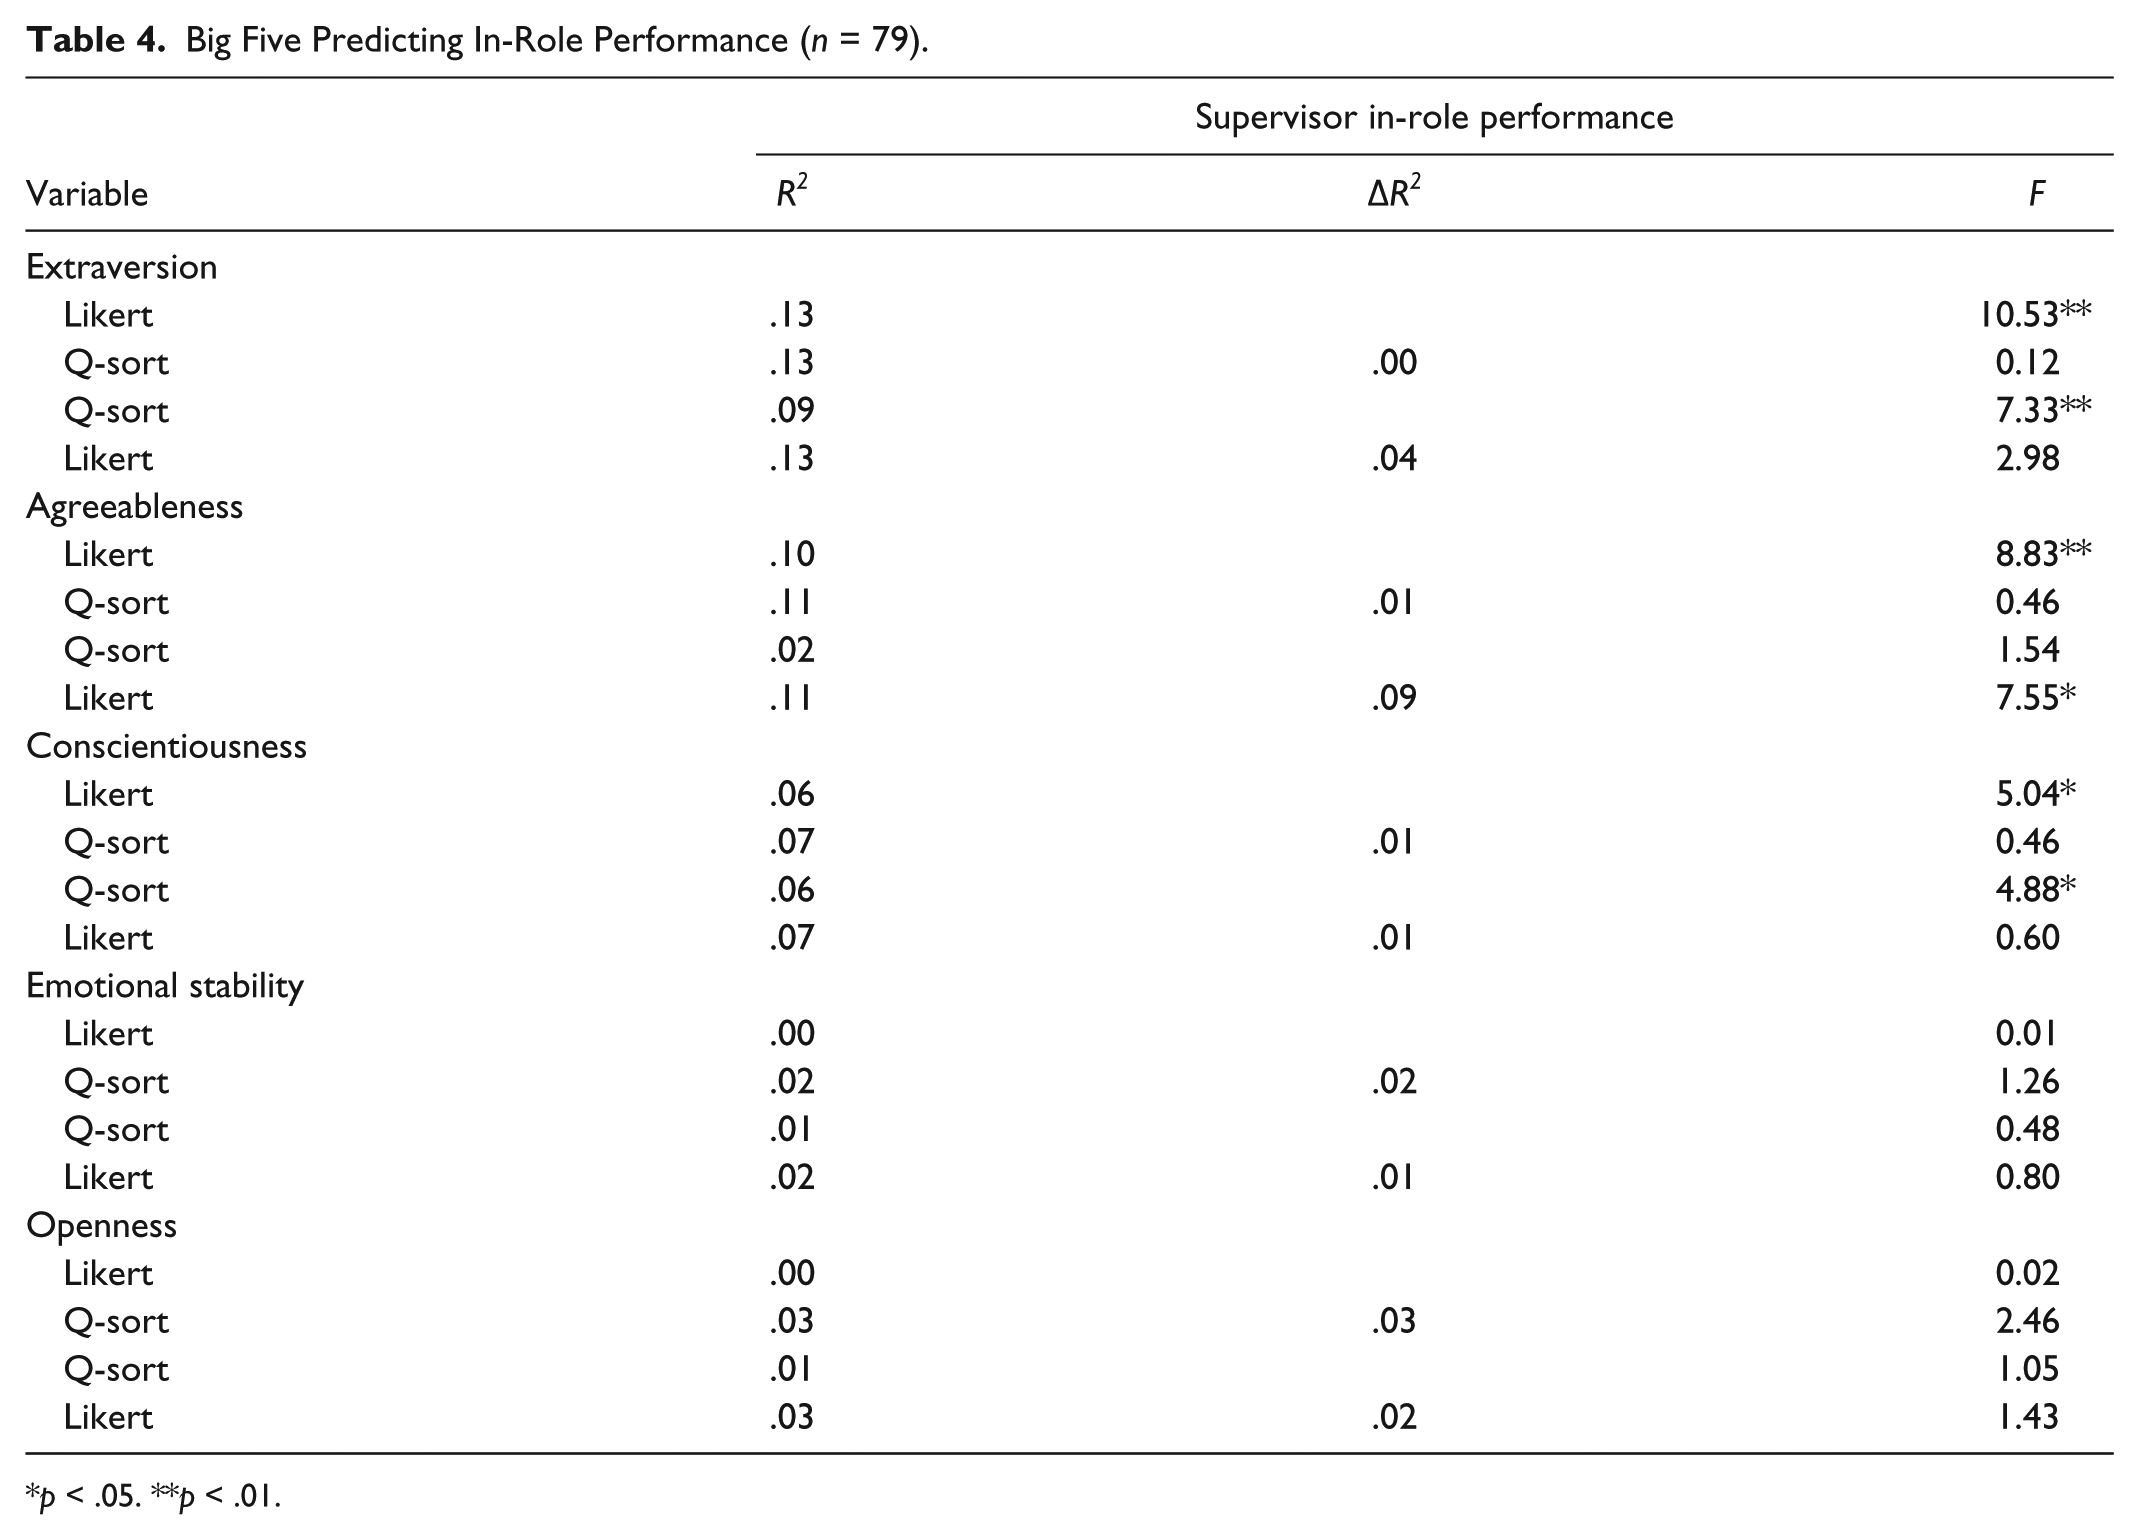
p < .05. **p < .01.
Discussion
In many respects (internal consistency, criterion-related validity), the Q-sort and Likert-scaled Big Five dimensions function quite similarly. These results are similar to previous studies that have used multiple Big Five measures and compared construct validity (Biesanz & West, 2004; DeYoung, 2006; Lim & Ployhart, 2006). However, the current study adds to these studies for two primary reasons: (a) The current study uses two different self-report formats (as opposed to two different Likert-scaled instruments), and (b) the current study also investigates Big Five dimension mean differences between measures.
Each Q-sort Big Five dimension largely demonstrated a high convergent correlation with its corresponding Likert-scaled counterpart (r = .68-.84). In addition, similar confirmatory models were needed to fit the Big Five data to reach acceptable standards for both measures, as acceptable-fitting models were found only with parcel (not item) level indicators and freely estimated Big Five dimension correlations (non-orthogonal structure; similar to the results of Lim & Ployhart, 2006). Based only on this information, one might conclude that Big Five measurement via Q-sort and Likert, at least with the item set used in this study, is largely unaffected by measurement method.
However, construct validity evidence diverges between measurement methods on inspection of other key statistical indicators. Specifically, Big Five dimension means were systematically lower for the Q-sort than the corresponding Likert-scaled dimension. It should be noted that this effect was most prominent for participants completing the measures under simulated-applicant (as opposed to honest) instructions (from small to large effect sizes, d = .13-.73), in which more socially desirable responding might be expected.
Regarding the criterion-related validity component, the tentative results indicate that the Q-sort Big Five dimensions do relate to criteria similarly to the Likert dimensions. In addition, conscientious predicts supervisor performance ratings as measured in both formats, which is consistent with previous research involving the Big Five and job performance (Hough & Oswald, 2008). Perhaps surprisingly, extraversion, as measured by both formats, predicts performance ratings. This may be partially explained by the work history of the sample, which involved many customer service jobs, and could reasonably be expected to emphasize extraversion and other interpersonal skills to a greater degree than most blue-collar work. These issues do not account for agreeableness predicting supervisor ratings for the Likert, but not the Q-sort, format. It could be that test-takers were strategically, and not uniformly, engaging in socially desirable responding across dimensions, and de-emphasized agreeableness compared with other dimensions. This interpretation is speculative, and replication would be needed to support it. Regardless, the criterion-related validity issue represents perhaps the greatest need for future research presented by the current study, as studies involving real job applicants and incumbents, along with expansion of the criterion domain beyond in-role performance, could serve to expand understanding of the normative Q-sort in high-stakes contexts.
The question remains of when a Q-sort might be desired. A likely scenario would be when a researcher, or more likely an applied practitioner, has reason to believe that socially desirable responding is present. This could be based on mean and intercorrelational differences between applicant and incumbent samples, or between obtained samples and established test norms. Another scenario might be if one believes that criterion-related validity is being reduced due to intercorrelations between relevant personality traits. In this case, the practitioner would be less concerned about construct validity issues (i.e., if the Q-sort reduces means and/or intercorrelations below “true” levels or not) and more concerned with simply systematically removing multicollinearity with the hope of increasing predictive power (It should be noted that the criterion-related validity results in the current study were conducted in a univariate predictor fashion and do not support or refute using a Q-sort for this purpose).
The basic advantage of a Q-sort, based on the results from this study, is that this format positively affects measurement properties of Big Five measures that are thought to be influenced by socially desirable responding. Although it cannot be inferred that participants in this study were attempting to fake and that the Q-sort generally reduced their ability to do so—and it should be noted that establishing these conditions have been quite difficult for many non-cognitive measurement formats to prove (Ones et al., 2007)—it is reasonable to believe that when a large number of test-takers inflate their scores, common consequences will be increased overall means and increased intercorrelations between dimensions. The Q-sort has softened these effects in the current study.
The main disadvantage from incorporating existing Likert-derived items into a Q-sort format is that inferences of construct validity might be reduced. Careful attention was paid to establishing construct validity inferences in this study, but many contexts may not be amenable to similar rigorous designs. Another issue involves the interpretation of the partially ipsative nature of the Q-sort data. Some argue that this information cannot be used for normative, between-person purposes (Ones et al., 2007). Others, such as Heggestad et al. (2006), believe that the issue of appropriate uses for partially ipsative scores is unresolved and requires more research. The results of the current study support the notion that Big Five dimensions measured by Q-sort produce similar, and in some aspects (orthogonality) more desirable, psychometric properties than when measured by Likert-type scaling.
A final issue involves consideration of these results in the context of recent developments involving the general factor of personality (GFP). Although the Big Five have typically been conceived as orthogonal, evidence consistently indicates moderate correlations between dimensions (mean r = .26 according to a meta-analysis performed by Rushton & Irwing, 2008), leading to support for investigations of higher-order factors. However, many of the investigations supporting the GFP have relied on single-source Likert data (van der Linden, Nijenhuis, & Bakker, 2010). More research is needed to determine whether the GFP is robust in studies that account for socially desirable responding. For example, Biderman, Nguyen, Cunningham, and Ghorbani (2011) found that modeling social desirability through the positive and negative valence of items produced a more orthogonal factor structure, suggesting limited robustness of the GFP. The current study accounted for social desirability by using a method that constrains socially desirable responding and found a more orthogonal Big Five structure. These results indicate that partially ipsative measures, such as normatively scored Q-sorts, have both practical (constraining socially desirable responding) and conceptual (producing a more orthogonal Big Five structure) advantages.
Footnotes
Declaration of Conflicting Interests
The author(s) declared no potential conflicts of interest with respect to the research, authorship, and/or publication of this article.
Funding
The author(s) received no financial support for the research and/or authorship of this article.