
Abstract
The objective of this article was to describe and validate psychometric properties of a Likert-type scale to assess the perception of equity in health care, characterize equity in health care of users in the district of Vila Real, and analyze the factors that determine equity in health care in the district of Vila Real. The study was developed in a district of the northern interior of Portugal, with 6,113 participants. We resorted to Cronbach’s alpha and also Pearson’s correlation to validate the scale. The Cronbach’s alpha of the scale is adequate, showing a good internal consistency, and the most appointed factors as being influential on equity are age, geographical distance, and socioeconomic resources. The proposed scale was found to perform well, measuring these participants’ perception on the equity to access in health care, which can contribute to identify the key determinants appointed by the population as generators of inequity, leading to the implementation of measures.
Keywords
Introduction
The guarantee of equity and accessibility to health care is enshrined in national health policies and is a basic principle of any health system, included in most constitutions (Giraldes, 2001, 2005). The World Health Organization (WHO) says it is expected that health systems are equitable, but those are developing in directions that contribute little to equity and social justice, thus moving away from its goal of reducing health inequities. It is important to know the extent and understand the nature of inequities and exclusion to develop goals for change, in the way that the health sector is able to take significant steps to contribute to the progress of equity in health (WHO, 2008).
This article describes and validates psychometric properties of a Likert-type scale to assess the perception of equity in health care. After the implementation of the reform in primary health care occurred in Portugal, changes should be evaluated with scientific methodology to understand what measures effectively leads to health gains (Furtado & Pereira, 2010). It becomes even more pertinent to do this analysis given the interiority, the geographical dispersion and a net loss of roads and transports in the region in study (district of Vila Real, Portugal). However, these data seem relevant to us given the importance of knowing what view the citizens have about this issue (current and relevant), and this is one aspect that has not been analyzed in previous studies.
The International Society for Equity in Health (ISEqH; 2001) defines equity as “the absence of potentially remediable, systematic differences in one or more aspects of health across socially, economically, demographically, or geographically defined population groups or subgroups,” implying a fair distribution of services according to needs, taking into account that some individuals or populations may require a greater share of resources than those which would be assigned an equal distribution of the same (Kinman, 1999), that is, we speak of vertical equity. Vertical equity exists when people with greater needs are provided with greater resources and horizontal equity indicates that people with the same needs have access to the same resources (Starfield, 2011).
The term inequity has a moral and ethical dimension, referring to the differences which are unnecessary and avoidable, but in addition, are also considered unfair and unjust. To describe a certain situation as inequitable, the cause has to be examined and judged to be unfair in the context of what is going on in the rest of society (Whitehead, 1992). Equity in health is an ethical value, inherently normative, grounded in the ethical principle of distributive justice and consonant with human rights principles (Braveman & Gruskin, 2003). These authors show that “a health disparity is inequitable if it is systematically associated with social disadvantages in a way that puts an already disadvantaged social group at further disadvantage.”
The concept of equity is not necessarily equivalent to equality, although the two terms are sometimes used synonymously. Equity has to do with the redistribution of something according to the needs related to this something, and is a relative concept. Equality is an absolute concept, not necessarily with an ethical connotation (Pereira, 1993). However, authors like Starfield (2011) defend that the term unfairness to define inequity is not appropriate, because unfairness is not measurable and therefore not a useful term for policy or evaluation. On the other hand, the majority of the published literature on equity in health focuses on access, utilization and financing of health services, sometimes confusing this with equity in health (Macinko & Starfield, 2002). Access to health care is the possibility that individuals have to get health care when and where it is necessary, in appropriate quantity and cost in order to obtain health gains (Justo, 2004). This may be influenced by socioeconomic and cultural contexts of different groups in society, so access to health care is inextricably linked to equity (Furtado & Pereira, 2010).
According to Whitehead (1992), the goal of the policies in health equity is not to eliminate all health differences so everyone has the same level and quality of health care, but rather to reduce or eliminate those that result from factors that are considered avoidable and unjust. In other words, it is not possible that all people have the same level of health, but acting on the social injustices that are killing people on a grand scale is an ethical imperative (Marmot, Friel, Bell, Houweling, & Taylor, 2008).
As has been argued in the literature, it is important to understand the reality underlying equity in health, to allow the implementation of policies that are able to act effectively on health inequities (Furtado & Pereira, 2010; Marmot et al., 2008; Whitehead, 1992). A strategy to reduce health inequities must be based on a solid foundation of scientific evidence about the existent asymmetries as the effective interventions in the area of health equity for informed decision making (Furtado & Pereira, 2010).
However, there are no statistics on inequity in health in different countries. All standard health statistics describe average or “mean” health in the population—life expectancy, infant mortality, death rates from various diseases, and the like. Health indicators that are used to describe various aspects of population health and the impact of services on them are also useful for assessing equity in health. Producing them only requires stratifying the population into the social, economic, or geographic indicators and determining if there are differences in rates of the indicators across the strata (Starfield, 2011). In addition, Braveman and Gruskin (2003) propose to assess health equity, and compare health and its social determinants between more and less advantaged social groups. This practice (measurement through comparing an indicator of health or a health-related factor in one or more disadvantaged groups with the same indicator in a more advantaged group or groups) generally reflects data limitations and is not featured in the work of experts (Starfield, 2006). Other complex methods, such as population attributable risk, the slope and relative evidence of inequality, and the concentration curve and index, have been used.
Bhuiya, Hanifi, Urni, and Mahmood (2009) propose evaluating the utilization of health care services by the poor through routinely collected data from the facilities and communities by systems. The authors highlight the importance of monitoring at a local level, where most of the actions have to take place to improve the situation. Starfield’s (2006) proposed definition of equity advances a scheme to measure health disparities based on three basic components: (a) an indicator of health or a modifiable determinant of health, such as health care, living conditions, or the policies that shape them; (b) an indicator of social position, that is, a way of categorizing people into different groups (social strata) based on social advantage/disadvantage, such as income, education, ethnic group, or gender; and (c) a method for comparing the health (or health determinant) indicator across the different social strata, such as a ratio of the rates of the health indicator in the least and most advantaged strata.
Method
The goals of the study were to (a) describe and validate psychometric properties of a Likert-type scale to assess the perception of equity in health care, (b) characterize equity in health care of users in the district of Vila Real, and (c) analyze the factors that determine equity in health care in the district of Vila Real.
A cross sectional study took place in December 2011 to September 2013, with users of health centers in the district of Vila Real—Portugal. The following inclusion criteria were applied: (a) must have used the health center at least once in the last year, (b) be above 18 years of age, and (c) must be able to understand and answer questions.
The principles of the Helsinki Declaration were taken into account, namely, the nonexploitation of participants, equality and fair treatment, a fair selection of the population in study, beneficence, nonmaleficence, autonomy of individuals, respecting their values, and a favorable risk-benefit relation. All of these assumptions have been secured in the form of free and informed consent.
Procedures
There were a total of 6,113 eligible participants. Of this number, 4,399 (71.9% of those eligible) fully completed the equity questionnaire. Only completed questionnaires were used in scale development. Questionnaires were used to interview participants. The first step in the construction of the scale included the systematic literature review, which identified variables and indicators that can affect health equity, detected relevant issues to include in the scale and related the questions to the goals; clear and precise vocabulary was used.
The variables identified that can influence the access to health care and included in the scale developed were geographical distance to health care centers, socioeconomic resources (of families, cost of living in general), ethnicity, age, and gender. The scale also included a question about equity perception (“There is equality of opportunities in access to health care face to existing resources”). These question and factors are organized in an agreement scale with Likert-type format (1 = strongly disagree, 2 = disagree a lot, 3 = slightly disagree, 4 = neither agree nor disagree, 5 = slightly agree, 6 = agree a lot, 7 = strongly agree). Moreover, the questionnaire used included the assessment of socioeconomic, demographic, and cultural data (age, sex, marital status, educational attainment, professional activity, monthly income).
The psychometric validation of a scale considers its construction, data collection and respective treatment, and verification of the reliability and validity of the factors that constitute it. The internal consistency of the factors respect the variability of the answers that results from real differences in respondents (Pestana & Gageiro, 2008).
Statistical Analysis
The statistical software used for the analysis and processing of data was the “Statistical Package for Social Sciences” (SPSS) version 19 for Windows (SPSS Inc., Chicago, Illinois, EE.UU.). The level of significance for all analysis was set at .05. Cronbach’s alpha assessed the internal consistency of the scale, which is the test most recommended for Likert-type instruments (Coutinho, 2011). For the analysis and interpretation of Cronbach’s alpha, the mean was calculated, standard deviation and the correlation of factors. The relationship between each factor and the equity perception was calculated by Pearson’s coefficient correlation.
Results
Regarding the sociodemographic characteristics, the female gender was most prevalent with 60.1% of participants, ranging in age from 18 to 44 years (44.1%), the mean age was 50.13 years (SD = 20.63). More than 50% of the participants were married (56.1%) followed by those of single status (26.8%).The majority (50.9%) of the sample had 9 years of schooling. Note that 9.2% of the participants did not attend school. Most individuals worked or hire (34%) or were unemployed (27.6%). Monthly income varied between 451 to 1,000 Euros (35.5% of participants) and 200 to 450 Euros (34.4% of participants).
The internal consistency of the scale in study obtained by Cronbach’s alpha is .810. Intercorrelations between factors and total scale presented lower values in contrast to other factors. Similarly, Cronbach’s alpha increased when the age factor was deleted (Table 1).
Item-Total Statistics.

Note. In the analysis of Pearson correlation (Table 2), equity perception is positively correlated and statistically significant with the geographical distance, socioeconomic resources and ethnicity.
In the analysis of Pearson correlation (Table 2), equity perception is positively correlated and statistically significant with the geographical distance, socioeconomic resources, and ethnicity.
Correlation Analysis Between Equity Perception and Their Factors.

Statistical differences significant at .000 level.
In the distribution of the equity perception (answer to the item scale “there is equality of opportunities in access to health care compared with existing resources”), 26.1% indicated “neither agree nor disagree”; 20.7% indicated that they “strongly disagree” (Figure 1) that there is equity in access to health care. Geographical distance, socioeconomic resources, and ethnicity are those factors in which the majority of participants indicated they “strongly disagree.” Participants neither agreed nor disagreed and also strongly disagreed with factors of age and gender related to health care equity. The most frequently appointed factor as a barrier in access to health services is age (41%), followed by geographic distance (37%), socioeconomic resources (31%), ethnicity (24%), and gender (20,8%).
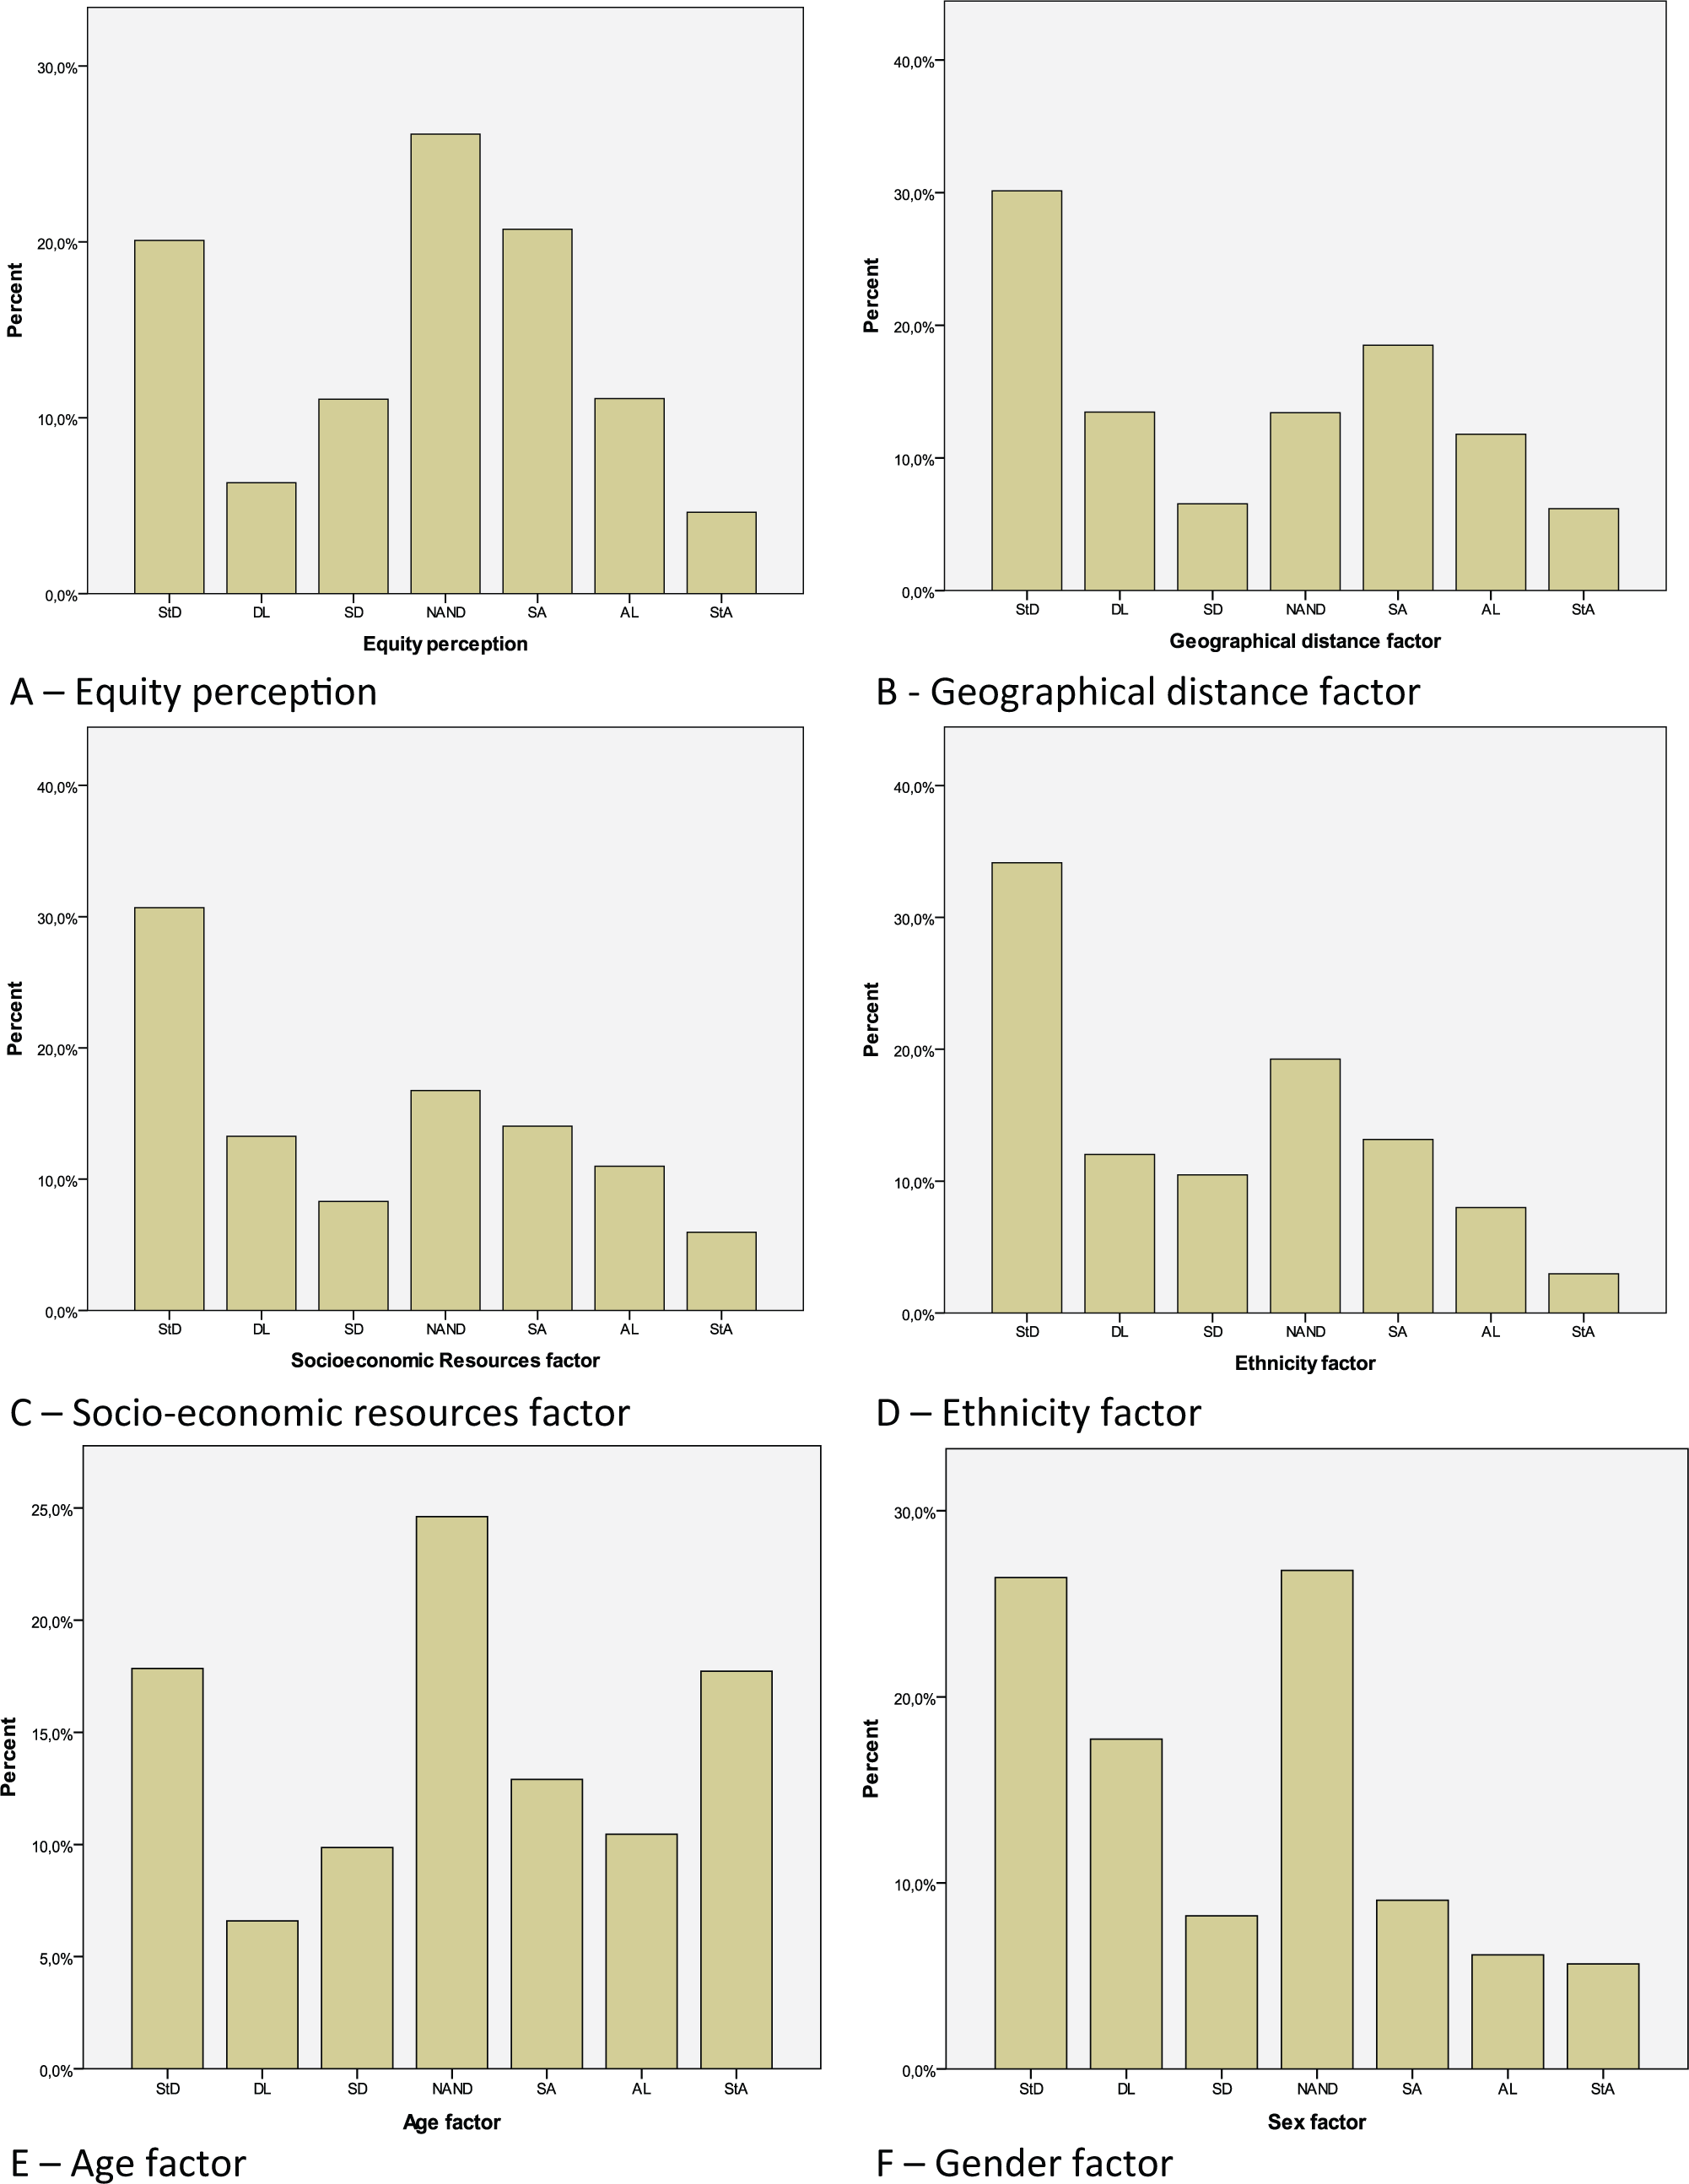
Distribution of equity perception (A) and their factors: Geographical distance (B), socioeconomic resources (C), ethnicity (D), age (E), and gender (F).
Discussion
Although equity is a key building block in the law of the Portuguese health care system, there has been little concern in the past to accomplish, promote, and monitor this goal (Furtado & Pereira, 2010). Therefore, this is a pioneer study in obtaining evidence regarding the validity and reliability of a scale that assesses the perception of health care equity. Based on the surveys of 4,399 participants, their perception is that there is a lack of health care equity in the northern interior region of Portugal, in which the largest percentage being female with a mean age above 50 years, have qualifications and low monthly income, as indeed in the register of health care (Ministério da Saúde, 2009). According to the Annual Reports on Access to Health Care (Ministério da Saúde, 2010), the population accessibility is closely linked to various demographic, socioeconomic, and geographic factors; specifically in this region, with poor road networks, an aging population and a low socioeconomic status which can explain the differences regarding access to health care services.
The result on the scale’s internal consistency, assessed by Cronbach’s alpha was adequate (.810), which according to the literature, is considered to be very reliable (Pestana & Gageiro, 2008). The percentage of participants included in the scale validation process (n = 4,399) was satisfactory, as it exceeded the number recommended on literature to proceed with the Cronbach’s alpha analysis (Pasquali, 1999). According to Hora, Monteiro, and Arica (2010), the sample must also be heterogeneous, which can be confirmed given the inclusion criteria and the mean of each factor. Thus, the scale was administered on participants with different opinions on the issue under study, leading to the total variability of the questionnaire and thus increasing Cronbach’s alpha.
The correlations between equity perception and their factors were significant to the geographical distance to health care centers, socioeconomic resources and ethnicity. It is important to highlight that “age” correlates negatively with equity perception. When deleted, Cronbach’s alpha would increase. This indicates the need for better composition, to enhance its internal consistency. However, the factor “age” is the most indicated to be influential on equity to access to health care, which can be explained taking into account the levels of aging in this region. This demonstrates that individuals may be made aware of the condition and/or feel the inherent difficulties in access to health care by increasing age (Furtado & Pereira, 2010; Noronha & Andrade, 2005). For all these reasons, it was not excluded from the scale.
These findings may indicate the need for a validation scale in other populations. It can be justified with the relation to the increase of elderly population, a characteristic of this region and several countries. Marmot (2006) also reports that health inequities remain in the older age groups. Starfield (2006) refers to other things being equal, and that priority should be given to effective interventions at younger ages. Social disadvantage is damaging at any stage in life but is especially harmful when experienced early in life (Benzeval, Dilnot, & Judge, 2000).
Age is often mentioned to compare life expectancy or age at which diseases arise between different social groups, as can be seen also in terms of age related socioeconomic resources. Respect to this, the interior region has lower average income scores compared with the rest of the country, which is observed for example in the average monthly income and economic possibilities (Health Local Profile, 2009). With regard to the factors discussed in this work as generators of inequities, Braveman (2006) alleges that if inequity is the result of avoidable disparities in health and its determinants, these differences are reflected by socioeconomic, gender, ethnic, and age, among other factors such as religion and sexual orientation.
An ethnic group is a group of people who share an origin, culture, and language or are identified by others as different from other groups. Ethnicity can limit access to equal opportunities. In the study of equity is important to consider ethnic groups, because promotion of equal ethnicity contributes to the achievement of health equity (Canadian Agency for International Development, 2006). In the area studied, the ethnicities present are gypsies and immigrants from countries of Eastern Europe. These factors lead to the stratification of society and a widening gap between deprived and advantaged social groups. Those are groups of people defined by differences that place them at different levels in a social hierarchy, categorized by measures of income, economic assets, occupational class, and/or educational level (Braveman & Gruskin, 2003). Also Marmot (2007) adds that health inequities result from unequal distribution of power, prestige, and resources among groups in society, at very different stages of economic development of countries, and this is a key factor to the way health inequity is generated.
Studies indicate that geographical distance is a potential barrier in access to health care and an important factor in the equity of accessibility (Furtado & Pereira, 2010; Oliveira & Bevan, 2003). Furtado and Pereira (2010) verify that geographically more isolated users find difficulties in traveling to health centers. There is unequal distribution of physical and human resources in the territory and little dissemination of mechanisms to overcome the barrier of distance, including repayments of traveling costs. In this sense, Marmot et al. (2008) argue that the equitable distribution of financial resources among geographic regions is necessary to improve the social determinants of health care.
In this sense, economic and social policies affect the distribution of the social determinants of health, including resources for education and financial security (Balarajan, Selvaraj, & Subramanian, 2011; Marmot et al., 2008). It is crucial to recognize the importance of action on the social determinants of health.
As limitations of our study, we recognize the need for better composition of the scale items, in particular as regard age, to enhance its internal consistency. Taking account that approximately 25% of the participants neither agree nor disagree as to the existence of equity in access to health care, the elimination of “neither agree nor disagree” category will strengthen the scale and the study. The inclusion criteria “have used the health center at least once in the last year” could omit a significant population who were not able to access the health center. Those suggest the need for a validation scale in other populations.
Conclusion
The proposed scale was found to perform well measuring these participants’ perception of equity in access to health care. This approach could help to identify the key determinants appointed by the population as being generators of inequity. The statistical tests show that the scale is reliable and has good internal consistency. However, taking into account the specific characteristics of the population in study and the scale aspects that can be enhanced, there is a need for scale validation in other populations.
The majority consider that there is no equity in access to care and assign age, geographical distance and socioeconomic resources as the key factors. These findings may reflect some evidence that equity in access to health care services in this district needs to be strengthened, leading to the implementation of new social policies, promoting the necessary organizational adjustments and helping to improve the welfare of citizens.
Footnotes
Declaration of Conflicting Interests
The author(s) declared no potential conflicts of interest with respect to the research, authorship, and/or publication of this article.
Funding
The author(s) disclosed receipt of the following financial support for the research and/or authorship of this article: This study was supported by the Instituto Nacional de Saúde Dr. Ricardo Jorge (INSA), reference 2011/EXT456.