
Abstract
The proposed study, by using cluster analysis, presents the unique methodology for determining the level of efficiency of banking systems in terms of crisis. It identifies a cause and relationship of various derivatives when applying the specialized tools to regulate the level of stability of the banking system. The proposed methodology assists in applying the presented studies to track the trends of governmental strategies in regulating the banking market applying the financial and performance indicators. Furthermore, this article presents the innovative methodology when assessing the level of effectiveness of national banking systems in relation to other countries, by carrying out the evaluation of the efficiency of governmental regulations compared with various international banking systems during the period of 2004-2009, and the implementation of the results by received economic interpretations.
Introduction
Evaluating the level of efficiency of the banking system is an extremely important and difficult task. Existing methods and tools for analyzing the efficiency of the governmental regulation mechanisms of banking systems differ not only because of the complexity of the application but also because of the received results. Based on performed research, the development of an optimal model for estimating the efficiency of the banking system should be based on the analysis of the most important performance indicators of banks’ activity in general within certain country dynamics and should have a comparative nature.
The methodological basis of this research is scientific and is based on special methods of knowledge, conceptual rules of modern economic theory, experiments and research literature, and with use of government regulations to the monetary operations.
Methodology of the Research
The methodology of the comparative evaluation of the level of effectiveness by the government toward the banking system should consist of the following stages: introduction of performance indicators of the banking activity, standardization of the actual values, use of cluster analysis, and economic interpretation of the achieved results.
We performed quantitative comparative evaluation of the efficiency of the banking industry. The first step is to select effective indicators of the efficiency of the banking activity. To create a database, we have chosen the following financial indicators: K1—return on equity (ROE; %), K2—return on assets (ROA; %), K3—the proportion of equity in total assets (%), K4—the adequacy of regulating capital (%), K5—the share of nonperforming loans to total loans (%), and K6—the share of coverage by insurance reserves of nonperforming loans (or problem debt = %).
Selected relative ratios allow to assess the governmental regulatory policy from a position of financial stability and ability to control basic banking risks. The focus is on assessing the profitability of banking systems (K1, K2), the adequacy of bank capital (K3, K4), and the effectiveness of control over the banking credit risks (K5, K6).
The most important indicators of the banking system are the ROA and the ROE. The banking system functions efficiently, when it is constantly maintains profitability at a sufficient level with ROA over 1%, and ROE over 7%.
The quality of credit risk management of the banking system is characterized by the ratio share of nonperforming loans to the total loans. According to the International Monetary Fund (IMF), the nonperforming loans are loans, whose payment period expired after 90 days or more, and loans which in the last 90 days of the agreement were capitalized, refinanced, prolonged, and also loans whose payments are less than 90 days overdue, but there are strong doubts that it will be implemented (Financial Soundness Indicators, 2004).
Acceptable ratio level of nonperforming loans to the total loan portfolio at an appropriate level of governmental control of the banking system should not exceed 3.5%. The share covered by the insurance reserve of nonperforming loans should be closer to 100%. Under these conditions, potential credit risks do not threaten the overall stability of the banking system.
Regulatory capital adequacy ratio (solvency ratio) reflects the bank’s ability to promptly and fully pay for its obligations which are arise from trade, credit, or other monetary operations nature. The higher the value of the adequacy of regulatory capital, the greater the proportion of risk that is taken upon by the owners of the bank themselves and vice versa; the lower the value of the index, the greater the proportion of risk that creditors (depositors) of the bank are taking upon themselves.
Regulatory capital adequacy ratio is set to prevent excessive rearrangements by a bank with a credit risk and a risk of nonreturn of banking assets to bank creditors. This ratio is defined as the ratio of regulatory capital to total assets and certain off-balance sheet instruments, reduced by the amount of the relevant provisions on active operations and by the amount of the loan security (investment in debt securities) unconditional obligations or cash, covered as collateral property rights and suspended by the degree of credit risk (Instructions on the regulation of banking, 2001).
Standard value of regulatory capital adequacy ratios, under the Basel regulations, should not be less than 8%. Because of the global financial crisis, according to a requirements package of Basel III, the minimum capital adequacy ratio until January 01, 2019, has to increase to 10.5%, due to the size of “countercyclical reserve.” Otherwise, banks will be forced to form the phase of economic growth in the range from 0% to 2.5% of the ordinary shares, or another type of capital, to fully cover losses . In Ukraine, the ratio (H2) for existing banks from January 03, 2004, set at the level no less than 10% (Instructions on the regulation of banking, 2001).
In regards to the ratio of equity to total assets, it shows the level of capital adequacy in view of the total activity, regardless of the size of the various risks of the bank. The optimal value of this index should not exceed 4%. According to economic theory and practice, in “credit boom” conditions, the capital-asset ratio tends to decrease.
Evaluating the efficiency of governmental regulation of the domestic banking system will be conducted by using a comparative and dynamic analysis. In particular, the measures of efficiency of regulation of the banking system of one country will be compared with similar values of other banking systems in a joint cluster and indicators of foreign banking systems in other clusters. Forty-six countries were elected for this analysis, 21 of which being developed countries, 12 developing countries from Central and Eastern Europe, 6 Asian developing countries, and 7 former Soviet Union (CIS) countries. Dynamic analysis will be conducted to identify trends in the changing strategies of governmental regulation of banking systems over a certain period of time (in our estimation, the time lag is 6 years between 2004 and 2009). The set of information for cluster analysis was formed according to the official central banks statistical data of the appropriate countries, aggregated in IMF’s the Global Financial Stability Report (Global Financial Stability Report, 2011).
The selection of standardized indicators was performed during the second phase. For classification, we used the concept of evaluation of similarity between objects that depend on the value of the trait and the degree of variation in total. To avoid such dependence, the values of input variables should be normalized. Among the methods of centering and normalization, we performed the replacement of χij by the new value of yij using the formula:

where yij = standardized value, χij = output value, X̄ij = average value of each parameter, σij = it is the dispersion of parameter χij.
Dispersion σij can be found by the formula:

where n = number of variables.
The results of generated vectors of standardized evaluation of the efficiency of governmental regulation of banking systems are given in Tables 1 to 13.
Fragment of Matrix of Euclidean Distances.

Standardized Estimation of Level of Efficiency of Government Regulation of the Banking Systems of the World Countries in 2004.

Standardized Estimation of Level of Efficiency of Government Regulation of the Banking Systems of the World Countries in 2005.

Standardized Estimation of Level of Efficiency of Government Regulation of the Banking Systems of the World Countries in 2006.

Standardized Estimation of Level of Efficiency of Government Regulation of the Banking Systems of the World Countries in 2007.

Standardized Estimation of Level of Efficiency of Government Regulation of the Banking Systems of the World Countries in 2008.

Standardized Estimation of Level of Efficiency of Government Regulation of the Banking Systems of the World Countries in 2009.

Cluster Belonging of Objects and Distances From Objects to the Centers of Clusters (2004).

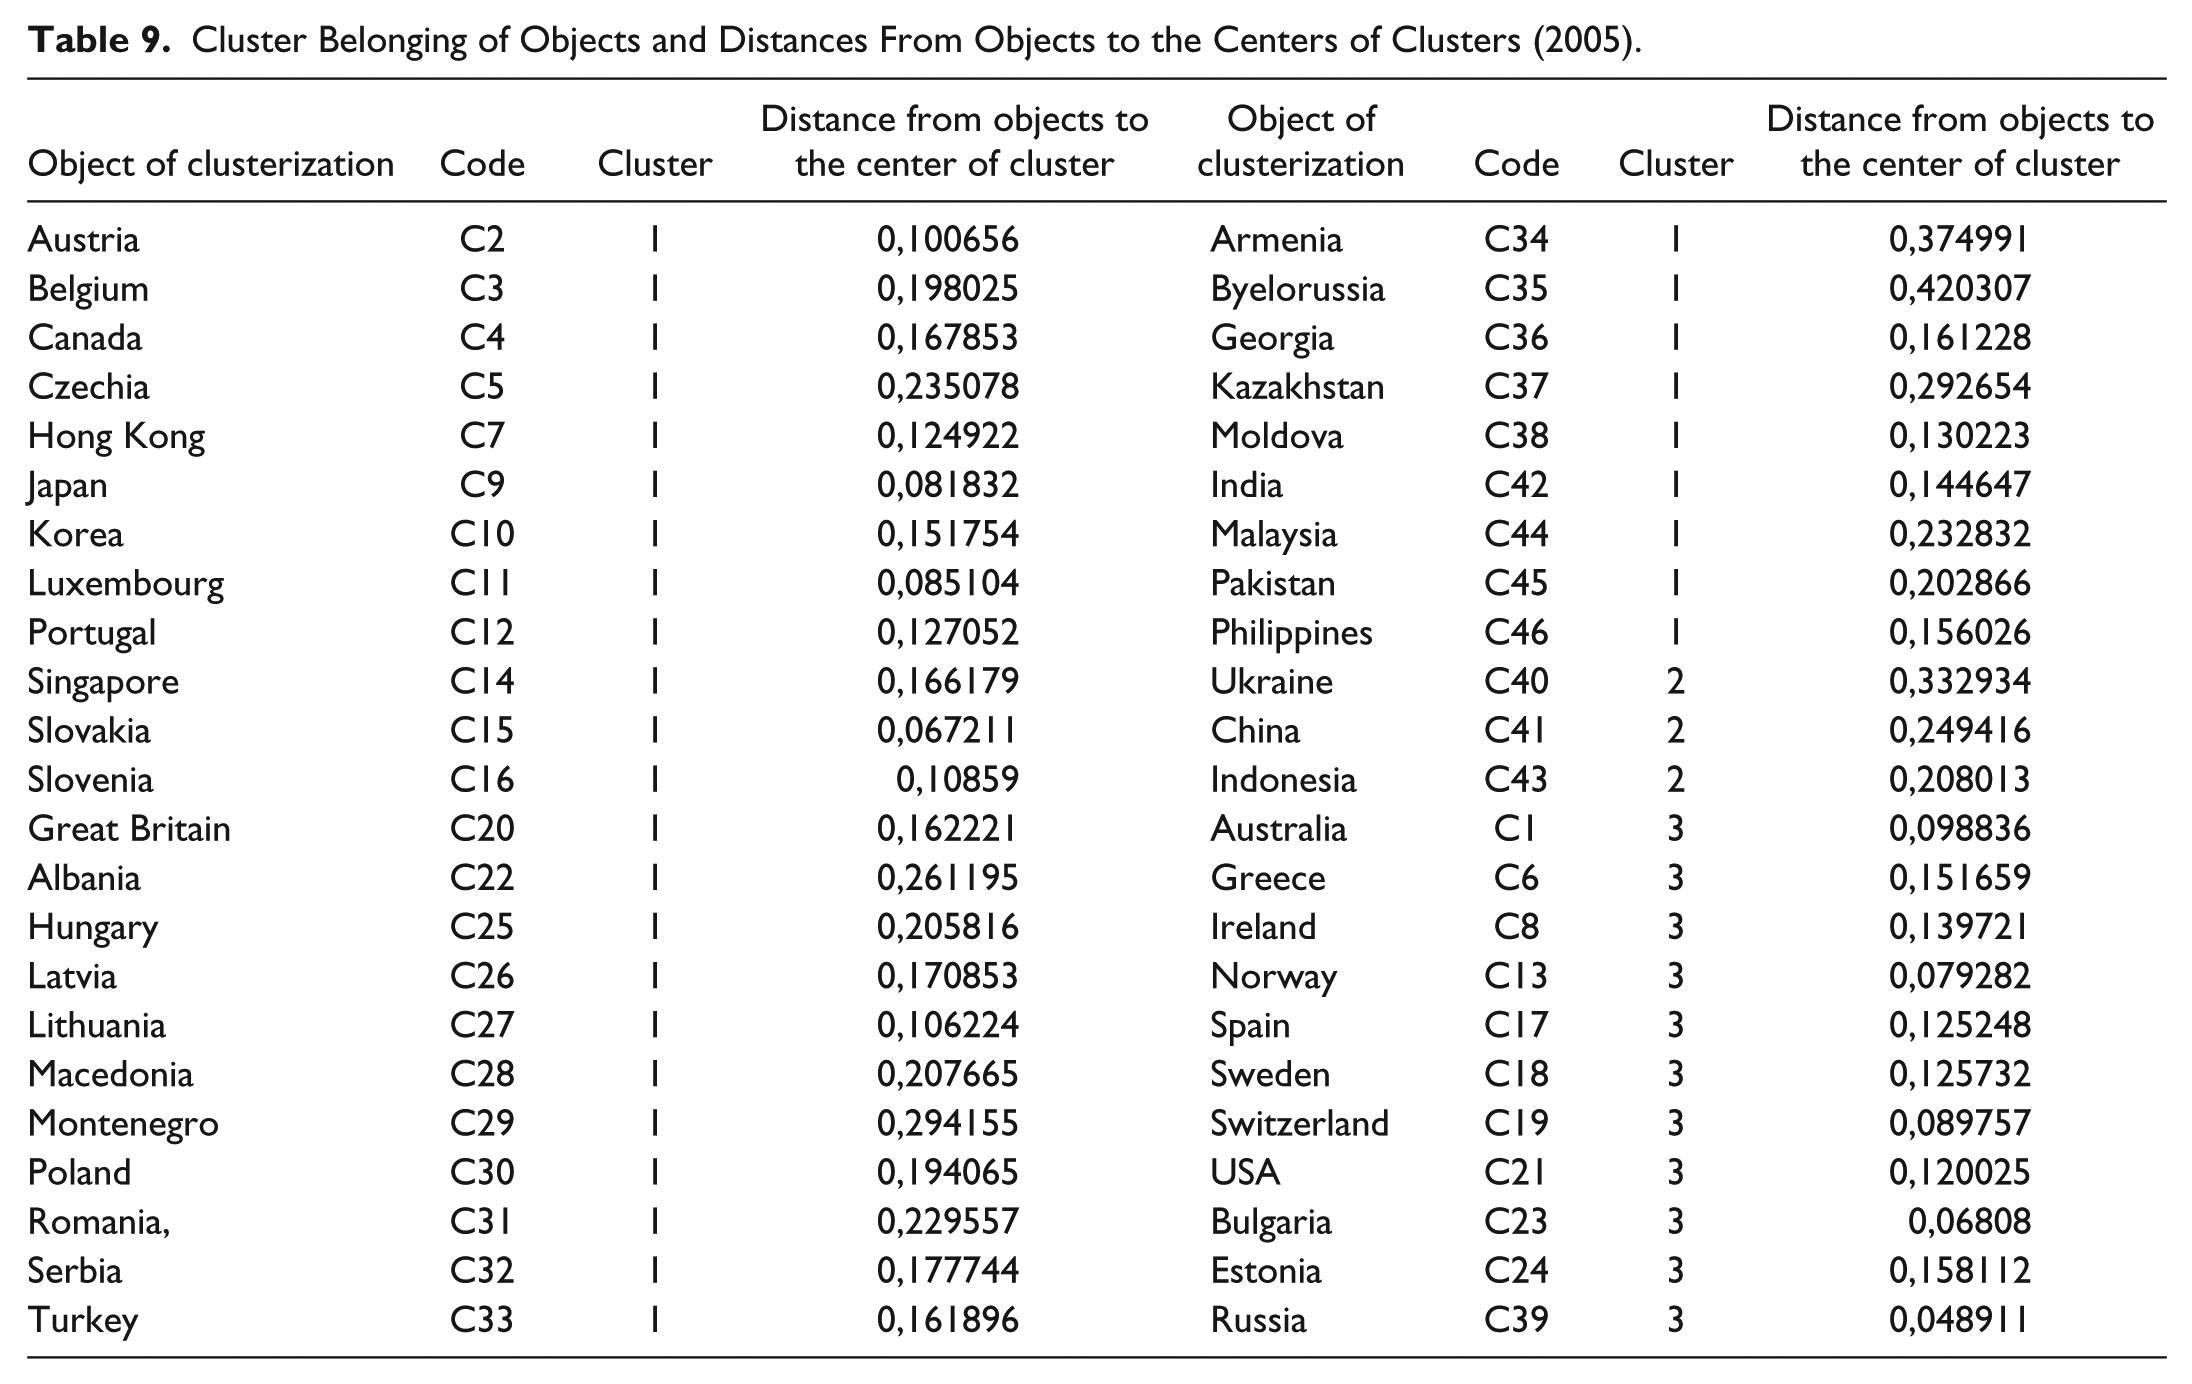
Cluster Belonging of Objects and Distances From Objects to the Centers of Clusters (2005).
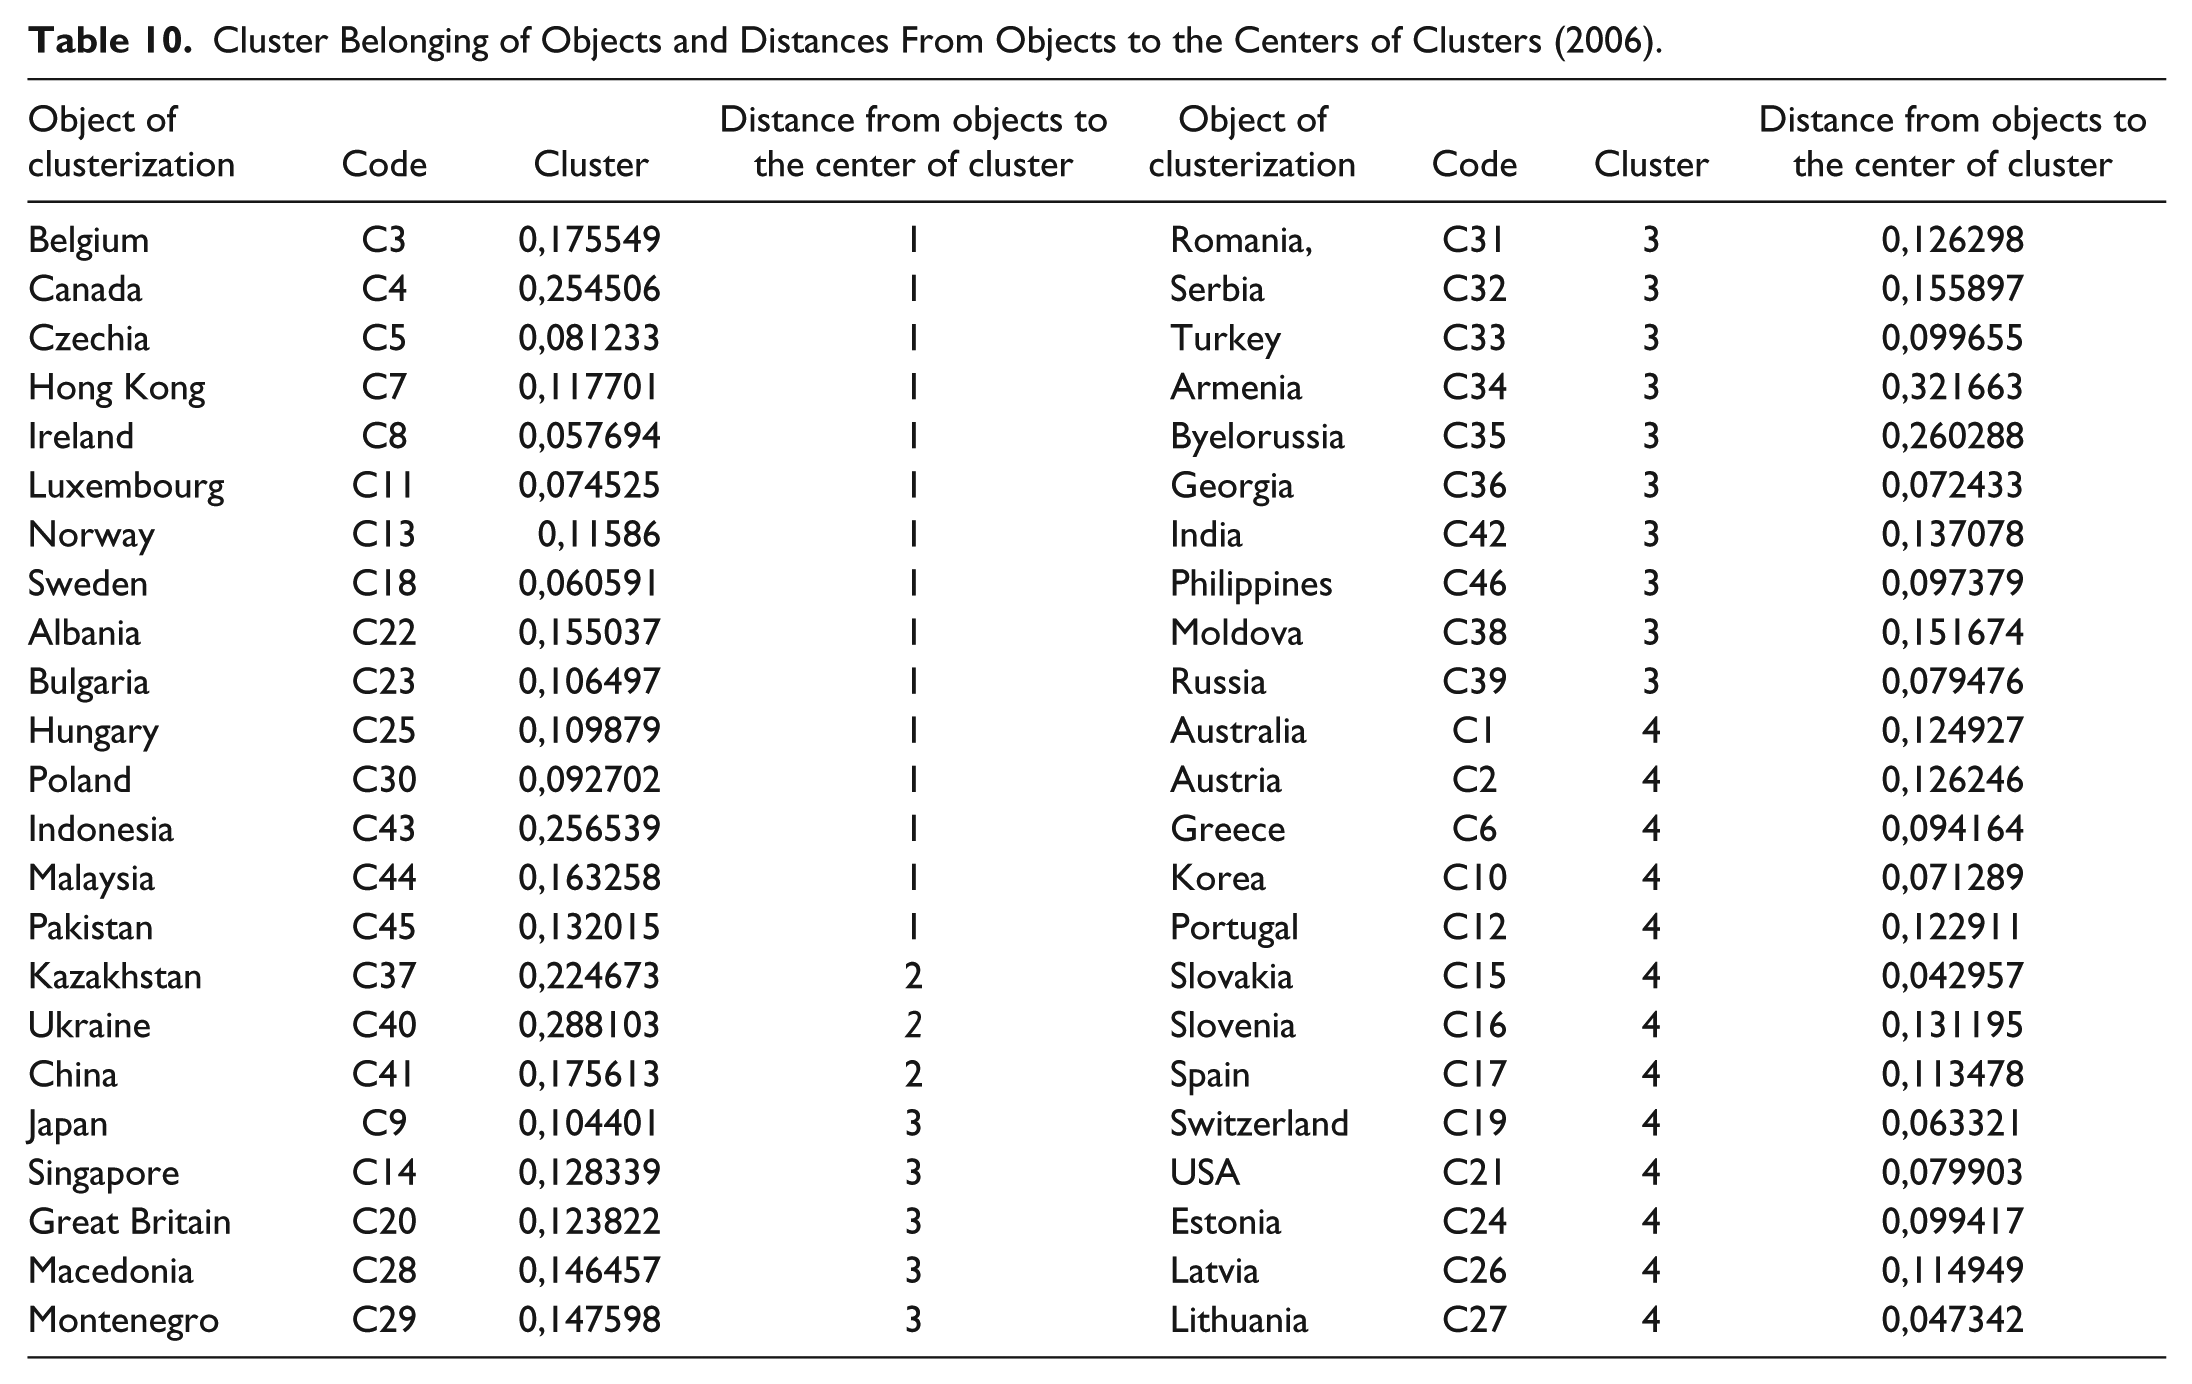
Cluster Belonging of Objects and Distances From Objects to the Centers of Clusters (2006).
Cluster Belonging of Objects and Distances From Objects to the Centers of Clusters (2007).

Cluster Belonging of Objects and Distances From Objects to the Centers of Clusters (2008).

Cluster Belonging of Objects and Distances From Objects to the Centers of Clusters (2009).

The purpose of cluster analysis is to classify objects into relatively homogeneous (uniform) groups, considering a set of selected variables. Primarily, the cluster analysis agglomerating method of middle linkages was applied to detect the number of clusters, into which the initial set was broken. The average values of all distances, measured between the objects of two clusters, are fixed on basis of this method with every pair objects, including different clusters (Malkhotra, 2002). In the process of clusterization, following the agglomerating, we used the method of middle linkage data applying all the distances between pairs.
As a result of cluster analysis on the base of the agglomerating method of middle linkage, the matrix of distances (similarities) is calculated. The results of calculation of matrix of Euclidean distances are given in Table 1. On the basis of calculated Euclidean distances, the banking systems form groups of clusters. The process of grouping the banking systems in clusters, by the selected indexes of evaluation of efficiency level of governmental regulation of the banking systems in 2004, is represented on a tree-shape diagram (Figure 1). Analogical methodology of analysis was applied to the indexes for the remaining years from 2005 to 2009.
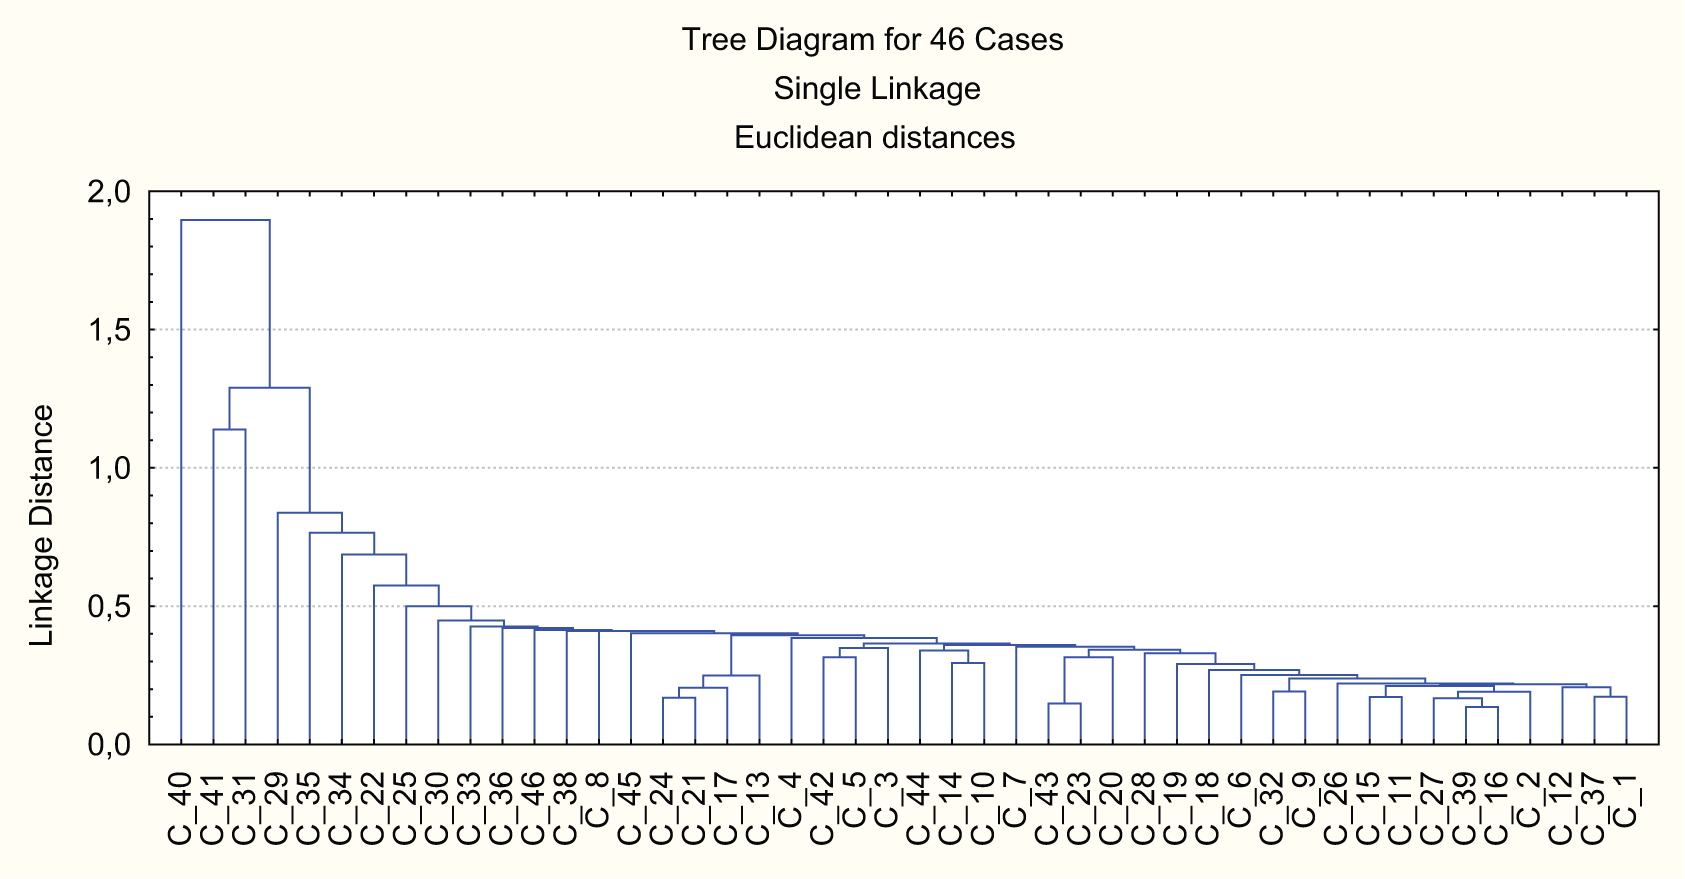
A tree-shape diagram of grouping of the world banking systems by the level of efficiency for the period of 2004.
During the further research, the hierarchical grouping was executed and the optimal numbers of clusters was obtained. As criteria for selecting the number of clusters, we used the middle distances between the centers (Figure 2). The considerable increase of distances between the consolidated clusters in transition from 43 to 44 stages is represented on Figure 2. An analogical situation is observed on the last stages in the diagram shown on Figure 1. On the basis of represented stages of clusterization, the most advantageous is to distinguish three clusters of the banking systems.

Distances between clusters that link on every step of analysis.
The results of cluster analysis, obtained with the help of hierarchical agglomerating method of middle linkage, were used during realization of iterative method of k- middle, notably the amount of clusters was set for the division of entrance of the totality of the banking organizations. The method of k- middle at first determines the center of cluster and then groups all objects within the fixed limits from the center of threshold value. As a result of clusterization, such compositions of clusters were obtained by the method of k- middle (Tables 2-7).
Clusterization of the banking systems by the level of efficiency of government role in regulating banking operations by using the k-middle method is based on such parameters of distribution of objects, as multidimensional average and multidimensional dispersion. Therefore, for interpretation of data it is necessary to analyze these statistic parameters.
This methodology was applied for analysis 2004, 2005, 2006, 2007, 2008, and 2009 to trace the reaction of change in functioning of the banking systems from stable development (stages of favorable terms of development to appearance and deepening the bank crises).
Empirical Analysis
As the result of realization of cluster analysis, we received three clusters in 2004 with distribution of the banking systems for these clusters by the level of efficiency of governmental regulation of banking. The cluster belonging to the banking systems and distance from objects to the center of clusters is given in Figure 3 and in Tables 8 to 13.
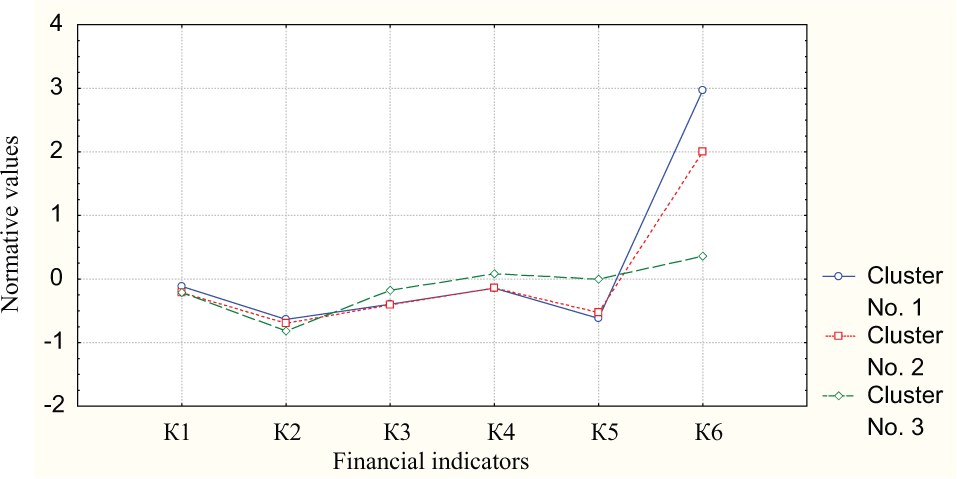
Middle values of indicators of the formed clusters that represent the level of efficiency of the banking systems in 2004.
According to the obtained results, Cluster 1 has the highest middle value by the index of κ6 (by part of coverage by insurance backlogs of problem debt from loans). The values of indexes of ROE and ROA are higher than middle values compared with the values of other clusters. It is equated with a Cluster 2 by the indexes of sufficiency of regulatory capital and share of bank capital in assets. The values of indexes of κ3 (share of bank capital in assets) and κ4 (level of sufficiency of regulatory capital) for both clusters are matched.
As a result, Cluster 1 is formed from countries where the governmental policy was assisted for development of banking, providing the high level of profitability of bank business maintaining of its financial firmness. Cluster 1 represents the developed countries such as Australia, Norway, Sweden, USA, Great Britain, Spain, Iceland, and also developing countries such as Estonia, Georgia, Hungary, and Indonesia. The level of governmental regulation in these countries can be estimated as highly influential.
Cluster 2 has slightly lower characteristics in relation to the indexes of coverage by insurance backlogs from complicated debt for loans and indexes of ROE and ROA. The position of the Cluster 2 is slightly worse also in relation to the average value of index of the level of convoluted debt. However, system firmness of banking Cluster 2 was kept at the same level as Cluster 1 (κ3, κ4). The majority of the investigated countries, in particular Austria, Canada, Japan, Czech Republic, Portugal, Turkey, Latvia, Lithuania, India, Russia, and Poland, matched this cluster. This cluster unites countries with lower level of efficiency of governmental regulation the banking systems.
Cluster 3 united only four countries: Romania, Belarus, China, and Ukraine. Trajectory of Cluster 3 considerably differs from previous clusters. This cluster has the lowest index of coverage by insurance backlogs from complicated debts per issued loans and the highest average value of the index of inactive loans in the general volume of loan operations. This indicates the increased excessive credit risks in the banking systems.
Cluster 3 has the greatest average values in relation to κ3 and κ4 (level of capital in assets and sufficiency of regulatory capital). This indicates the withdrawal of considerable amount of money. Much of the money was spent on funding insiders, persons connected with the bank. As volumes of crediting of insiders are limited normatively, then investment in related business is possible only on condition if bank capital increased.
The most effective banking regulation was realized in countries that enter the Cluster 3, represented by Australia, Norway, Sweden, USA, Great Britain, Spain, Iceland, and Estonia. Also Russia, Switzerland, and Greece may be listed here. Cluster 3 had the highest indexes of profitability for bank sector, the lowest average indexes of sufficiency for the regulatory capital, and the share of bank’s capital, which confirms the increase of governmental support of the economy and stimulation of aggressive credit politics.
We will observe how the situation changed in 2005 (Tables 8-13, Figure 4).

The average values of indicators of the formed clusters that represent the level of efficiency of the banking systems in 2005.
Cluster 2 unites only three countries—China, Indonesia, and Ukraine. On the basis of the ROA and return on capital, their average indexes approach the developing countries united by Cluster 2. However, it was above the set limit of minimum value of 10%. The explanation of this lays in improving methodology for the accounting the sufficiency of regulatory capital and prohibition of the artificial padding of capital by governmental regulators.
The low estimation of level of efficiency of governmental regulations in countries of the Cluster 2 is explained by inability to predict and manage credit risks. As a result, in 2005 in Ukraine there was the highest index of inactive loans in terms of the general amount of loans among the other 46 investigated countries. It accounted for 19.6% (in China = 8.6%, Indonesia = 7.6%). On the backdrop of a high debt, the average index of awkward credits coverage in these countries appeared to be the lowest, namely, Ukraine = 25%, China = 24.8%, and Indonesia = 60.6%.
In regard to 2006, using the cluster analysis, we obtained the division of the investigated countries by the level of efficiency of governmental regulations into four clusters (Figure 5).
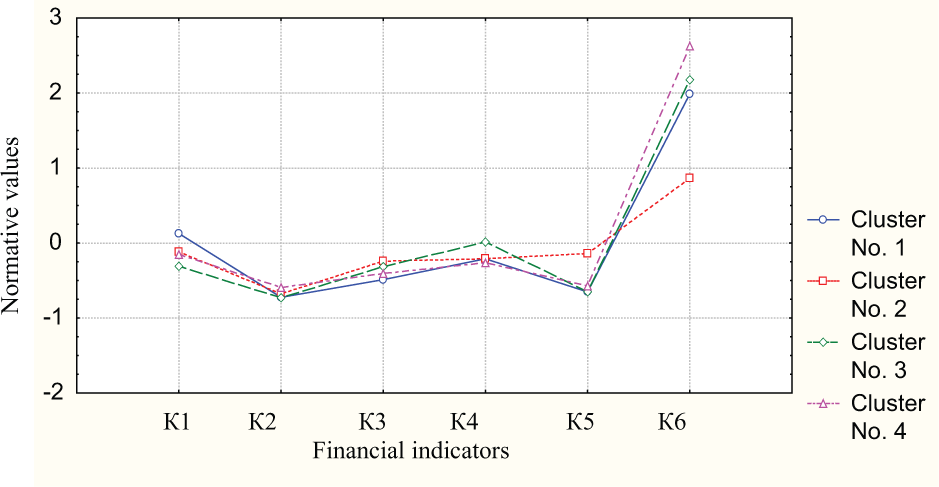
The average values of indicators of the formed clusters that represent the level of efficiency of the banking systems in 2006.
In 2006, there was considerable differentiation of the countries on the base of the indexes in κ1 (ROE). And Cluster 1 appeared to be the most cost-effective. The most typical representatives of this cluster are Czech Republic, Luxemburg, Sweden, Norway, Poland, Hungary, and Ireland. The ROE of these countries was within the limits of 19% to 21% that considerably exceeded the minimum limit of effective profitability a bank activity—7% (Tables 8-13).
With the increase of ROE, the decline share of equity in assets was observed. This indicates the realization of active credit politics by a banking sector of these countries. The level of credit risks grew at the same time. The average values of inactive loans to the total bank loans of countries of the Cluster 1 concur with the average indexes of the banking systems of the Clusters 3 and 4.
Only three countries entered Cluster 2—Kazakhstan, China, and Ukraine, which were developing dynamically. During a period of 3 years, banking systems of Ukraine and China, by a cluster analysis are identified as banking systems with the lowest level of efficiency. However, exposing the relative indexes of financial indicators to the analysis, it is possible to observe tendencies in relation to the improvement of positions of the banking systems of Ukraine and China (share of inactive loans had been reducing: in Ukraine, in 2004 formed 30%; in 2005, 19.6%; in 2006, 17.8%; in China, in 2004, 13.2%; in 2005, 8.6%; in 2006, 7.1%, and share of coverage by insurance backlogs of problem debt of loans were increased: in Ukraine in 2004 formed 21.1%;, in 2005, 25.0%; in 2006 р.-, 23.1%; in China, in 2004, 14.2%; in 2005, 24.8%; in 2006, р.- 34.3%; Global Financial Stability Report, 2011). However, compared with other banking systems, efficiency of government influence on banks was lower, despite the improvement of some relative coefficients.
Cluster 3 includes mainly developing countries, with the exception of Japan, Singapore, and Great Britain. Russia, Romania, Turkey, Moldova, Serbia, Belarus, Georgia, India, and Philippines, are in this category. The average value of ROE for this cluster was the lowest, and the average index of adequacy of regulatory capital was the highest among other clusters. This indicates the realization of conservative politics of minimization risks of active operations by governmental power, using the way of shifting of those risks at a greater degree toward the owners of bank institutions.
For Cluster 4, it is a natural to see the averaged position by all financial indicators, except the index of share of coverage by insurance backlogs of problem debt for non returned loans. It applies to the following countries: Switzerland, USA, Lithuania, Latvia, Estonia, Slovakia, Korea, Greece, Portugal, Slovenia, and Spain (Tables 8-13). To minimize credit risks, the government of those countries assisted their economies by supplying national banks with stimulus money.
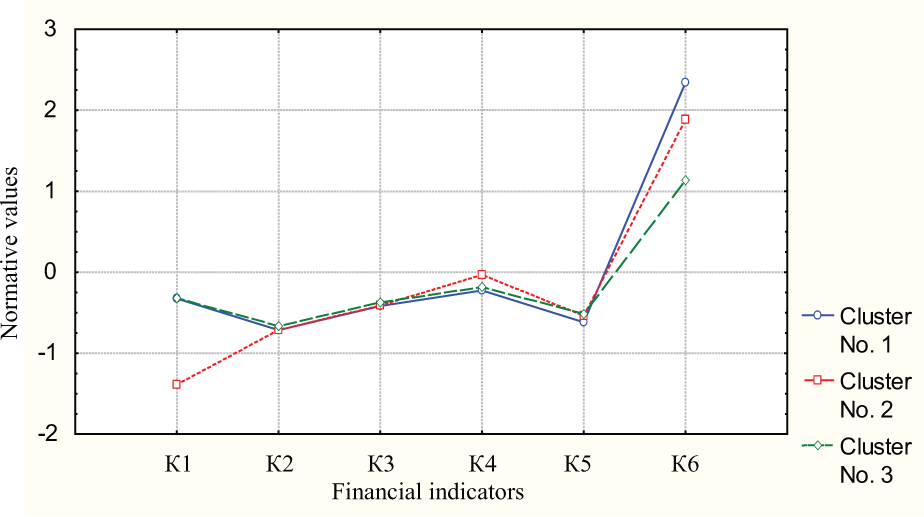
In 2007, the level of efficiency of governmental regulation by the certain set of financial indicators in selected countries practically leveled (Figure 6 and Tables 8-13).

The average values of indicators of the formed clusters that represent the level of efficiency of the banking systems in 2007.
With the help of cluster analysis, three clusters, whose curves are practically matching each other, with the exception of indexes of the average values of κ1 for ROE and κ6 represent the percent of coverage by insurance reserve from inactive loans.
Cluster 1 for Australia, Korea, Singapore, Switzerland, Latvia, Lithuania, Macedonia, Moldova, Romania, and Pakistan has the highest average share of coverage by insurance reserves of problem debt loans.
Cluster 2 has a slightly lower average shown in index K6, the typical representatives of which are Greece, Portugal, Slovakia, Turkey, Russia, India, Indonesia, and Malaysia (with the shortest distances from the center of cluster).
The curve of Cluster 3 is notably distinguished on the figure. This cluster is characterized by the highest average ROE, higher average level of sufficiency of regulatory capital and the lowest average index of the share of coverage by insurance debt in inactive loans. This cluster unites countries with an increase level of credit risk. Belgium, Ireland, Norway, USA, Albania, Estonia, Ukraine, and China entered this cluster.
In 2008, regulation of the banking systems took place in the conditions of global financial crisis. This situation tested governmental authorities for ability to notice the negative influences of external and internal threats (Figure 7).
The average values of indicators of the formed clusters that represent the level of efficiency of the banking systems in 2008.
Cluster 1 has the lowest indexes of the average level of problem loans in the general loans of the banking system and the highest average indexes of the share of coverage by high volume of insured problematic debt for obtained loans. It means that the Cluster 1 might be considered the most financially resistant to the credit risks. This cluster unites Hong Kong, Korea, Luxemburg, Singapore, Slovenia, Bulgaria, Turkey, Indonesia, Philippines, and China. Notice that China, being at first among outsiders with efficient governmental regulation of its banking system, significantly penetrated into country’s financial sector.
Despite the bank practice, China showed a positive tendency. The share of problem debt of loan operations went down for period 2004-2008 from 13.2% to 2.4%; the share of coverage by insured debt of loan operations grew from 14.2% to 116.4%; ROE increased from 13.7% to 17.1%, ROA grew from 0.5% to 1.0%, sufficiency of regulatory capital increased from −4.7% to 12.0%. This allowed China to enter a Cluster 1 with a higher level of efficiency of governmental regulation than in other countries. In addition, in this cluster appeared other Asia nations: Pakistan, Philippines, India, Malaysia, and Indonesia, which also had an inherent positive dynamics of the indicated indexes. Thus, the banking systems of the Asian countries presented more proofs toward the negative influence for the unfavorable economic state of affairs.
Disadvantages in regulation of the banking systems during a crisis were reduced in the countries that entered Cluster 2—Belgium, Great Britain, Montenegro, and Georgia. This cluster has the lowest average index of ROE. In relative values, for Belgium it formed −36.5%, Great Britain −10.3%, Montenegro −6.9%, and Georgia −12.6%. This indicates the politics for limiting the freedom of banking operations opposed by bank regulators and application for strong regulation of their activity.
As example, the biggest financial company, Fortis, became the first destructive element of the Belgian banking system. The governments of Belgium, the Netherlands, and Luxemburg decided to invest in the Fortis bank 11.2 billion Euros to support a trust to the Belgian bank and stabilize the banking system. However, Great Britain to stabilize its bank sector carried out nationalization (by acquisition of controlling share) of leading financial groups—HBOS (Halifax Bank of Scotland) and Lloyds TSB. In addition, the biggest British bank RBS (Royal bank of Scotland), spending 53 billion U.S. dollars.
For Georgia that had a steadily middle level of efficiency of regulation of the banking system, passing to the cluster with the lowest level of efficiency of regulation is explained not so much by the world financial crisis, as by the consequences of the war in South Ossetia. However, due to the timely acceptance of measures for overcoming negative consequences of the military conflict with Russia and effective use of credit resources of countries-donors, a financial-banking sector renewed its firmness. Already in 2009, the international rating agency of Standard & Poor’s confirmed short-term and long-term credit rating of Georgia at level “B/B”—“stable.”
In Cluster 3 we listed banking systems with financial indicator k6 and index debt higher than average of those represented in Cluster 2. This witnessed a shaky position of the banking systems of countries that entered this cluster. The most typical representatives of this cluster are countries with the shortest distance to the center of cluster in Norway, Latvia, Lithuania, Spain, Ireland, USA, and Albania. The domestic banking systems also belong here. Although the economic crisis in Ukraine began in autumn in 2008, its consequences negatively affected financial indicators: The share of problem loans grew by 4.2% and amounted to 17.4% on the base of year results; ROA went down by 0.5% and made 1.0%; ROE reduced by 4.2% and presented 8.5%. The share of coverage by insurance backlogs of invalid loans in 2008 was equal 29.6%. That is the lowest index among the entire investigated countries (Global Financial Stability Report, 2011).
As a result, in 2009, on the base of outcome of cluster analysis, four clusters were formed. Cluster 4 is represented by one country, Ukraine (Figure 8, Tables 8-13).

The average values of indicators of the formed clusters that represent the level of efficiency of the banking systems in 2009.
As indicated by Cluster 2, in the conditions of development of financial crisis, the governmental regulation of the banking systems in Canada, Turkey, China, Malaysia, and Philippines appeared the most effective. This cluster has the highest average value by the index of ROE and the highest value of the share of coverage of problem debt for loan operations at the lowest average index in the share of invalid loans in the general volume of loan operations at the system of banks.
We noticed that Cluster 2, with the most effective governmental regulation of the banking system, was formed in many Asian developing countries and only in one developed county, Canada. This firmness of the Asian banking systems in financial crises is not random. After the Asian crisis of 1997-1999, the Asian banks purposefully created a system that is orientated on indemnification of influence of macroeconomic fluctuations. Favorable macroeconomic environment, high speed of the economy growth, positive payments balances of countries, considerable volume of gold-value reserves, reforms, and input of the centralized regulation and also supported stable financial resources (deposits) and considerably promoted anticrises immunity of banking industry of Asia.
Financial firmness of the Canadian banking system is explained by balanced state budget, high rates of growing GDP, and conservative politics of banking regulations. Canada strictly controlled profitability on mortgage loans and limited speculative operations with mortgage securities. As a result, none of 21 leading banks of Canada needed governmental support. Nevertheless, in 2009, on the basis of the rating by the Economic forum, the Canadian banking system gained first place.
Cluster 1 has slightly worse indexes compared with Cluster 2, in relation to the financial indicators κ1, κ5, and κ6. It is important to notice that practically all banking systems of countries distributed between Clusters 1, 2, and 3 have close average values by the indexes of κ2, κ3, and κ4. Cluster 1 is characterized by the middle level of efficiency of governmental regulation of the banking systems and unites such countries as Slovakia, Slovenia, Sweden, Hungary, Poland, Czech Republic, and Austria, that experienced almost none negative consequences during the global financial crisis (Tables 8-13).
Cluster 3 united the developed countries and developing countries, whose bank regulators were unable to create the proper protection from the financial risks of global economic environment. This cluster has a low index of ROE. At the same time, a middle level of problem debt is slightly higher than at Clusters 1 and 2, with the lowest average value of level of coverage by the insurance surplus of problem debt for loans. A row of negative macroeconomic factors deepens the problems of the banking systems among countries with the excessive deficits of the state budgets, the considerable volumes of the external borrowing, the negative balances of payments balances, the low rates of increase of GDP, and the high indexes of unemployment rate. The aforementioned characteristics can explain inefficient governmental regulations of the banking systems in Ireland, Spain, Switzerland, Great Britain, USA, Estonia, Lithuania, Latvia, Armenia, Moldova, and Russia.
Cluster 4, which represents the Ukraine, has the lowest average indexes of profitability (κ1, κ2), and the highest problem debt (κ5) at the insignificant size of average value of the share covered with an insurance of inactive loans. This situation indicates the limit of credit activity of bank institutions and realization of capitalization of bank institutions. The level of efficiency of governmental regulation of banks by the selected indexes appeared to be the lowest.
Conclusion
Conducting the cluster analysis based on the indexes of efficiency for a pre-crisis and crisis periods in the 48 countries banking systems, we focused our attention on banking industry of developing countries. If we assume that the level of efficiency of governmental regulation over the banking system can be evaluated by a three-level scale—1 = the lowest, 2 = middle, 3 = the highest—then the dynamics of level of efficiency of regulation of the banking system of Ukraine, Poland, Russia, and China can be represented as indicated in Figure 9.

Trends in the efficiency of banking systems for the period of 2004-2009.
Based on the results of our analytical studies, good success at regulation of banking was shown by the Polish government.
Due to the proper supervision of the government, Polish bankers applied the risky methods of financing and conducting the banking activity far less than their colleagues, leaning mostly against a deposit polices. The Polish banks were careful when crediting mortgages, and this is why they were not grasped by typical problems other foreign banks experienced. Polish government prepared and implemented a chain of legal acts (among others, it is the so-called regulative package), which supported and strengthened the financial system of the country. In addition, National Bank of Poland provided financial stability to the domestic banks (Myrzayan, 2012).
During the period of 2004-2009, the regulation of the Russian banking system had stabilized the middle level of efficiency with the exception of 2005, when the rate reached its highest level. In 2005, the Russian economy, because of its exports income, contributed to a significant increase in budget revenues, which caused an increase the payment of social benefits and development of effective demand for cash. The resource base of the Russian banks was mostly formed due to the profit of exporters. The passive resources of the bank sector during the period of 2004-2007 grew approximately 40% annually (Navoj, 2009).
As a result, in 2008, the Russian banking system came with deep structural disproportions, which were caused by the increase of bad quality portfolio of credited consumers and instability of passive basis, dependent on export revenues, preserving segmentation and illiquid market loans. And only the rapid reaction of the government, represented by the Central Bank of Russian Federation and Government of Russia, allowed saving the middle level of efficiency in the banking system during the years of 2008 and 2009.
To regulate the liquidity level, the Central Bank of Russia applied the following measures: an increase of terms of the pawnshop crediting up to 30 days and 3 months; an increase of size of correcting coefficients at the calculation of cost of providing; a decline of requirements due to the rating of enterprises whose assets are set off as providing; a weakening of rules for extra charge of backlogs for coverage of possible losses for loans operations, a grant of blank credits to the banks on the term of 6 months; a crediting of banks under providing of credit portfolios and bills; an indemnification of losses at the interbank market during the recall of licenses from banks, a grant of the subordinated credit to Sberbank of Russia in the amount of 500 billion Russian rubles, an allocation of 50 billons U.S. dollars as sponsorship of banks (Morgunov, 2010, p. 41).
The best dynamics for the development of efficiency in regulation of the banking system was shown by China. During the period of 2004-2007, China by results of cluster analysis was included in clusters with the lowest level of efficiency of governmental regulation of the banking system. However until 2008, China managed to create the proper system of firmness in the banking sector that allowed them not only to resist a crisis but also to considerably improve the financial indicator indexes. Proof of this is the fact that in 2009 six banks in China, according to Global Finance magazine, made the list of the 50 largest banks in the world. The total asset of these banks was 6.9 billion U.S. dollars, representing more than 10% of the assets in the 50 largest banking institutions.
The China Banking Regulatory Commission (CBRC) plays a crucial role in development of the banking system of China. After its appearance in 2003, the reform in China banking system had a more dynamic development. While reforming, the Commission focused on the following aspects: enhancing the effectiveness of banking supervision, creating the conditions for a balanced and sustainable development of the country’s banking system, facilitating the introduction of financial innovation, providing quality services, and improving social responsibility.
In regards to Ukraine, by September 2008, the banking sector of Ukraine was developing rapidly and the rate of growth of bank assets was following: in 2005, 159.2%; in 2006, 159.1%; in 2007, 176.2%; and in 2008, 154.7%. Rates in the increase in credit operations are as follows: in 2005, 161.2%; in 2006, 171.7%; in 2007, 180.9%; and in 2008, 163.2%. It was assisted by the high rates of GDP increase (in 2005, 102.7%; in 2006, 107.3%; and in 2007, 107.9%), considerable pace of increase of real salary (in 2005, 120.3%; in 2006, 118.3%; and in 2007, 112.5%). Positive balance of payments, considerable inflow of foreign investments in a bank sector, where the share of foreign capital in total bank assets in 2004 presented 9.6%; in 2005, 19.5%; in 2006, 27.6%; and in 2007, 35.0% (National Bank of Ukraine, 2013).
However, an absence of structural reforms in the country, a growing credit risks, a lack of formation of backlogs for possible losses on loan operations, and an inconsistency of bank assets and liabilities because of their volumes, terms, and profitability, led to the situation that in the fall of 2008, Ukraine entered the liquidity crisis of the banking system. It was confirmed by the cluster analysis that an efficiency of the banking system went down to the lowest level, which is kept until today.
The performed analysis proved the level of efficiency of governmental regulation in the banking system, which still must be increased through implementation of wide reforms in financial sectors. The state regulators who are responsible for the banking sustainability must take efforts to improve procedures by applying the monetary instruments to regulate the banks liquidity, developing an effective mechanisms of restructuring of problem assets, and constructing a new paradigm for realization of the bank regulations and banking sector supervision.
Footnotes
Declaration of Conflicting Interests
The author(s) declared no potential conflicts of interest with respect to the research, authorship, and/or publication of this article.
Funding
The author(s) received no financial support for the research and/or authorship of this article.