
Abstract
President Obama’s goal is for America to lead the world in college graduates by 2020. Although for-profit institutions have increased their output of graduates at ten times the rate of nonprofits over the past decade, Congress and the U.S. Department of Education have argued that these institutions exploit the ambitions of lower-performing students. In response, this study examined how student characteristics predicted graduation odds at a large, regionally accredited for-profit institution campus. A logistic regression predicted graduation for the full population of 2,548 undergraduate students enrolled from 2005 to 2009 with scheduled graduation by June 30, 2011. Sixteen independent predictors were identified from school records and organized in the Bean and Metzner framework. The regression model was more robust than any in the literature, with a Nagelkerke R2 of .663. Only five factors had a significant impact on log odds: (a) grade point average (GPA), where higher values increased odds; (b) half time enrollment, which had lower odds than full time; (c) Blacks, who had higher odds than Whites; (d) credits required, where fewer credits increased odds; and (e) primary expected family contribution, where higher values increased odds. These findings imply that public policy will not increase college graduates by focusing on institution characteristics.
Keywords
Introduction
Problem and Significance
In his January 2011 State of the Union address, President Obama reiterated his goal for America to lead the world in college graduates by 2020. In July 2011, U.S. Department of Education (USDE) Undersecretary Martha Kanter (2011) confirmed that reaching this goal means graduating 47 million students from U.S. colleges by 2020. As USDE projects all U.S. colleges will produce only 37 million graduates during this timeframe, meeting the president’s goal will require a significant increase in higher education capacity.
In 2004, data from the Integrated Postsecondary Education Data System (IPEDS) confirm that over 2.7 million people completed an associate’s degree or higher at a U.S. higher education institution. 1 The 6 years from 2005 through 2010 saw a steady increase in degrees conferred of 3.6% each year. Of the nearly 2 million incremental graduates above 2004 levels, 28% came from for-profit institutions. 2 Graduates from these schools have grown at an average rate of 12.8% each year from 2004 through 2010. During this same period, private nonprofit college graduates grew at an average rate of 2.7%, while the rate for public nonprofit colleges was 3.0%. The growth in for-profit institutions demonstrates a latent demand for college education that is not met by nonprofit colleges. Nonprofits mostly serve full-time students who recently graduated from high school and live on campus. While they have some of these kinds of students, for-profits largely serve adult students who are not recent high school graduates but who still need a college degree. Given their share of graduates and growth, for-profit institutions are an essential element of U.S. higher education capacity.
Khanna and Khemka (2012) have noted that governments who encourage private investment have grown higher education capacity significantly more than governments who restrict such investment. They provide an example by comparing China and India. China has encouraged for-profit companies to participate in higher education since 2001. In the period from 2000 to 2008, college enrollments across China grew by 21%. During this same timeframe, as it pursued a strategy that essentially bars for-profit institutions altogether, India has seen enrollment growth of only 7%.
Despite the contributions of for-profit institutions to higher education capacity, government regulators have expressed concerns about processes and practices at these schools. Their concerns have led to an all-out war in the media that grew to a fever pitch within the first 2 years of U.S. President Barack Obama’s administration (Gramling, 2011). Media coverage showed violent swings between dichotomous views of for-profit institutions as either (a) proponents of the poor who provide a pathway to the middle class or (b) predators who exploit the ambitions of lower-performing students.
Given the importance of federally guaranteed student loans in funding higher education, it is vital for federal policymakers to account for how much for-profit institutions contribute to the total number of U.S. college graduates. Their ultimate policy decisions about the availability and amount of student loan funding will rest in part on whether they believe students or institutions have the largest impact on graduation from college. The stakes are quite high. Over 2 million students choose to pursue college degrees at for-profit institutions each year. 3 And over US$146.5 billion is loaned to students and paid on their behalf to higher education institutions each year under Title IV of the U.S. Higher Education Act (National Association of Student Financial Aid Administrators, 2011). Despite these high stakes, few studies have examined student persistence at for-profit institutions and even fewer have identified specific factors that predict graduation from for-profit institutions (Boggs, 2007; Fernandez, 2011; and Sauchuk, 2003). In addition, several researchers have found that the literature concerning graduation from nonprofit institutions 4 most often features survey-based studies that have high selection bias (Attewell, Heil, & Reisel, 2011; Jones-White, Radcliffe, Huesman, & Kellogg, 2010; and Lassibille, 2011).
Purpose of the Study
The purpose of this study was to determine how student background, academic program, finances, and academic outcomes impacted the odds of graduating from a for-profit institution. The study campus was one of several in a large, regionally accredited, midwestern for-profit institution. It qualified as large under the definition of Floyd (2005), who used this term to describe for-profit higher education institutions that are publicly traded with at least US$100 million in annual revenue.
The combination of presidential priorities and latent demand from adult students has placed significant pressure on higher education institutions to produce more graduates. Policy driven by Congress and the U.S. Department of Education has rested on an underlying assumption that tax status of an institution (i.e., nonprofit vs. for-profit) is the primary determinant of student graduation. This study tests that underlying assumption, with the potential to demonstrate that graduation from college can be predicted with high accuracy based solely on student characteristics known before they begin their studies.
To the extent that student characteristics reliably predict graduation, federal policymakers and for-profit institutions would find themselves in a difficult situation. On the one hand, increased federal regulation of for-profit institutions would reduce their output capacity and thereby cripple U.S. efforts to make large increases in the number of college graduates. And on the other hand, the best and most fervent efforts of for-profit institutions would not improve the odds of graduation for individual students. Increasing the number of graduates would require either (a) increasing the total number of students, despite the fact that all would not graduate or (b) restricting admissions to students with characteristics that indicate higher odds of graduation. Results from the first option would trigger political forces to increase federal regulation (such as outlined in Gramling, 2011), which ultimately would reduce output capacity. The second option would drive a direct reduction of such capacity. In summary, neither policy makers nor institutions would be able to increase the number of college graduates.
Research Questions
This study posed two research questions:
Theoretical Framework
The seminal study of nontraditional students was conducted by Metzner and Bean (1987). This study used a mixed methods approach. Researchers surveyed over 600 part-time students at a primarily commuter university with 13,000 undergraduates. Questionnaire responses were combined with select academic information to create a regression on 26 variables. The variables were grounded two sets of theories. First was role socialization theory, in which higher education is a socialization process operating on students to secure their acceptance by society and to build their competence in societal roles (Bean, 1985; Merton, 1957; Weidman, 1979). Second was behavior theory and models of how past behavior impacts attitudes, intentions, and ultimately, future behavior (Bean, 1985; Bentler & Speckhart, 1979; Lewin, 1935; Locke, 1975; Pascarella, 1980; and Tinto, 1975).
The regression model for dropout yielded R2 of .29 with only three variables significant at the p < .001 level: intent to leave, GPA, 5 and hours enrolled. They concluded that the dependent variable dropout was a direct function of academic performance, expressed as GPA and commitment to the institution, expressed as intent to leave and credit hour enrollment. Indirect effects on dropout were found in two areas: the influence of age on intent to leave, and the influence of age and race on GPA. Metzner and Bean’s model is summarized graphically in Figure 1, with the most significant factors highlighted.
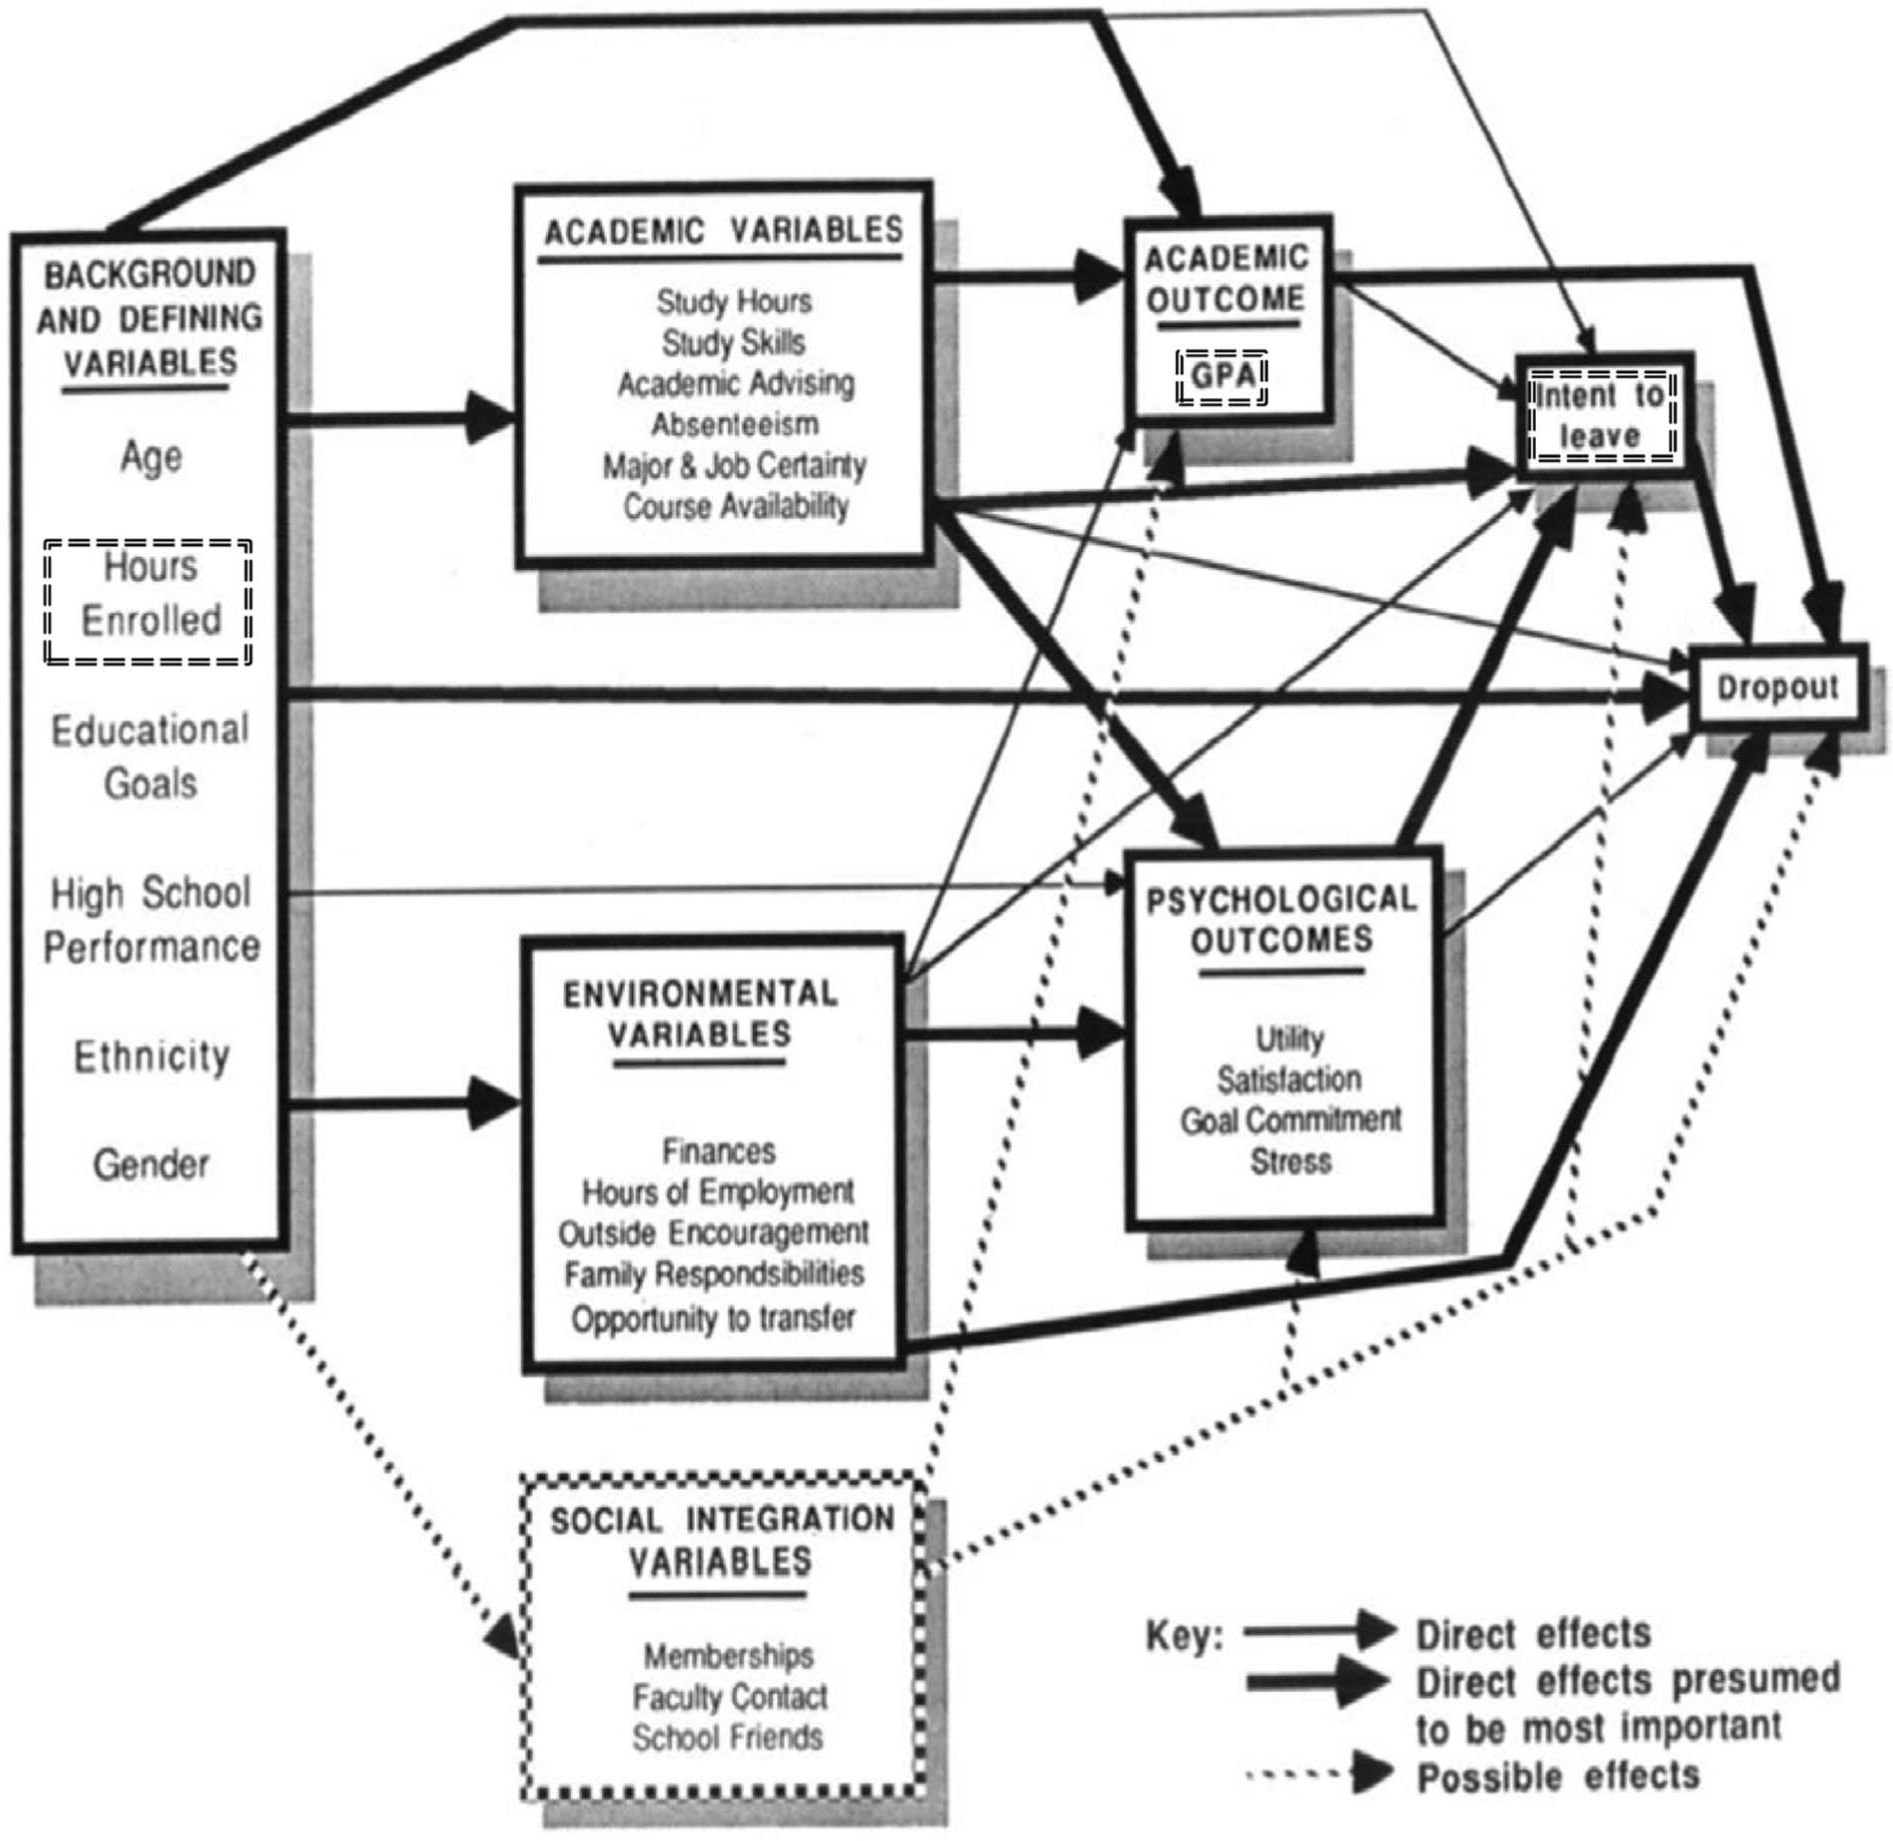
Bean and Metzner’s model of student dropout.
The Bean and Metzner model provides several broad categories that guided the logistic regression models in this study. First was the category for background and defining variables, which represents a number of factors that emanate from students and are independent of the college they attend. In this model, demographics represent true independent variables that are not limited to an intervening role. Bean and Metzner took this approach because the literature did not show conclusively that student success in college was independent of underlying demographic factors. Instead, the model provided for a direct effect of demographics on the dependent variable. Next are academic variables, which summarize how the student pursues their studies. Also included are environmental variables that describe the financial and family context in which students live every day. Finally, there is the academic outcome category. Limited to GPA, this captures the result of student academic efforts in school. While Bean and Metzner used a dependent variable that determined the likelihood a student would drop out of college, this study used a dichotomous dependent variable that determined whether or not a student would graduate.
Research Design
The research design featured five logistic regression models that predicted a dichotomous dependent variable with values graduate or not graduate. The data followed from secondary research of academic records at the study institution. The data included a combination of 10 continuous and 5 categorical variables. Each of the five regression models isolated a group of variables in the secondary research dataset that matched constructs in the Bean and Metzner framework.
The design was focused on discovering a model of student graduation that had very high predictive power. Because it included the full population of students, the study had the potential to demonstrate that its predictive power was not limited to a carefully constructed sample. In the relatively sparse literature on graduation predictors, most relied on a sample or survey methodology. These studies explained little of the variation in graduation, with R2 values between .129 and .363. There were only two studies that analyzed the full-population of students; one had an R2 value of .145 and the other was .541. Strong predictive power was not present in the literature. In contrast, this study intended to produce logistic regression models with accuracy over 80%.
Literature Review
Student-Level Research on Graduation Factors
By the late 2000s, the literature began to accumulate on student-level factors that influence their success in graduating from college. Though the research focused on nonprofit institutions, an extensive literature review by Kuh, Kinzie, Buckley, Bridges, & Hayek (2007) confirmed the presence of several risk factors that threaten college graduation. These included part-time college attendance and being a single parent. These themes emerged from a combination of studies that examined student outcomes at a single school. The school types included residential 4-year nonprofit institutions and nonresidential nonprofit institutions.
An early study at a residential 4-year nonprofit institution was conducted by Radcliffe, Huesman, and Kellogg (2006). Researchers collected data for 9,890 first-time, full-time freshman at a large midwestern state university during the 1990 and 2000 fall semesters. A logistic regression model was constructed to predict graduation within 6 years. The model was 71.8% accurate, correctly identifying graduates 87.5% of the time and nongraduates 46.1% of the time. Of the 15 variables in this study, the several that were significant at the p < .001 level included Pell eligibility, Cs and Ds earned, and Ws earned. Gender was significant at the p < .01 level; females were more likely to graduate than males. American Indians were less likely to graduate than Whites, though the result was significant at the .05 level. All other races had significantly similar graduation results to Whites.
These three researchers joined with another to analyze graduation of students who enrolled at a large, midwestern state university between 1999 and 2001 (Jones-White et al., 2010). While the authors conducted a binary logit model, a multinomial logit model, and a multinomial probit model, they did not publish the R2 or pseudo-R2 results. Furthermore, their research was limited to students attending colleges for the first time who were enrolled on a full-time basis. Still, they found that students who were eligible for the Pell grant program to assist low-income undergraduates had lower probability of graduating than students who were not Pell eligible.
Examination of nonresidential nonprofit institutions is typified by Metzner and Bean (1987). This seminal research effort surveyed over 600 part-time students entering as freshmen in 1982 at a primarily commuter university with 13,000 undergraduates. Questionnaire responses were combined with select academic information to create a regression on 26 variables. The regression model for dropout yielded R2 of .29 with only three variables significant at the p < .001 level: intent to leave, GPA, and hours enrolled. They concluded that dropout was a direct function of academic performance (GPA) and commitment to the institution (intent to leave and credit hour enrollment). Indirect effects on dropout were found in two areas: the influence of age on intent to leave, and the influence of age and race on GPA.
Metzner and Bean (1987) did not find significant direct impacts from student characteristics. But other researchers have found that these characteristics play a role in predicting graduation. Stinebrickner and Stinebrickner (2003) conducted a study of Berea College, a liberal arts institution in Kentucky dedicated to serving economically challenged students. Their research question was how a number of variables impacted GPA, as GPA was such a large factor in graduation for this group of students. Independent variables were the number of hours worked for each semester, the type of work assignment, race, and gender, along with ACT math and verbal scores. Regression analysis of the full population of full-time students who matriculated from 1989 to 1997 (n = 2,372, R2 = .145) found that working during the first semester of attendance had a negative impact on GPA. Race (Black) and gender (male) had similar negative impacts.
In summary, the literature on student-level factors that impact graduation reported a consistent set of findings about the impact and significance of GPA, race, and age. Still, this line of research did not deliver strong predictive power for nonprofit institutions. As a result, policies based on the findings of this research are not likely to benefit more than a small minority of students. As for-profit institutions have become more popular in the past two decades, there has been an increasing need for studies that focus on these schools and their student populations. To the extent that the research delivers weak predictive models, it will engender policies that have little impact on college graduation.
Literature on Predicting Graduation From For-Profit Institutions
As recently as 2011, researchers have found the literature concerning factors that impact graduation from for-profit institutions to be quite sparse. One of the earliest known studies came from Kinser (2006). He conducted an extensive review of the literature, and he reviewed National Center for Education Statistics data concerning graduation from for-profit institutions. He found that for-profit institutions led students to complete associates degrees successfully, but they were less successful with bachelor’s degrees. He conceded that this finding did not account for either student intent to complete a bachelor’s degree or structural barriers to completion such as transfer credit limitations.
Five years later, Fernandez (2011) conducted an extensive literature review concerning persistence at for-profit institutions. He found only a handful of studies about for-profit institution student persistence and graduation. These four studies of persistence did not yield useful graduation predictors, because they only considered factors that impacted whether students remained in school beyond their first academic term (Baughman, 1997; Clehouse, 2000; Dyer, 2006; Piazza, 1996). Fernandez’s research shared this focus on persistence beyond the first term rather than graduation.
One of the two studies noted by Fernandez to consider individual student factors that predict graduation was by Sauchuk (2003). This research was a case study of a single location based on student records, researcher notes from staff meetings, and interviews with staff, faculty, and students. Sauchuk found that prior academic preparation was a strong predictor of graduation.
The only other study noted by Fernandez was by Boggs (2007). This researcher conducted a regression analysis of three for-profit institution locations based on student records and demographic information. He found that the most significant independent variables included credit hours attempted in the third term, age, financial aid required, ethnicity, SAT score, credits earned in the second term, and entrance testing score. The full model with all significant variables yielded R2 = .541. Results indicated that age and credit load were positively correlated with graduation. They also indicated that Whites were more likely to persist to graduation than other races.
Summary
The research on student success as demonstrated by college graduation largely focused on student-level research at individual nonprofit institutions. While they have yielded a consistent set of graduation predictors, models from this research lack predictive power.
The literature on graduation from for-profit institutions is sparse and generally limited to analyzing what factors lead to students persisting beyond their first academic term. Extensive literature reviews have found only three studies that researched individual student factors that predict graduation. The findings from these studies were not contradictory. Together, they suggest that prior academic preparation, age, and credit load are significant predictors of individual student graduation from for-profit institutions. Furthermore, the Boggs study provided explanatory power that far exceeded student-level research at nonprofit institutions.
As federal policymakers consider policy choices about student loan funding availability and amounts, the present study adds to a growing line of reliable research. With its strong predictive models, this research confirms the dominant role student characteristics play in the odds of graduation. The present study adds a model that has stronger predictive power than any in the literature. This model can help policymakers find more effective ways to distribute limited student aid funds. It also can help policymakers avoid focusing solely on institutional factors, which play a small role in the odds of graduation.
Research Findings
Characteristics of Study Database
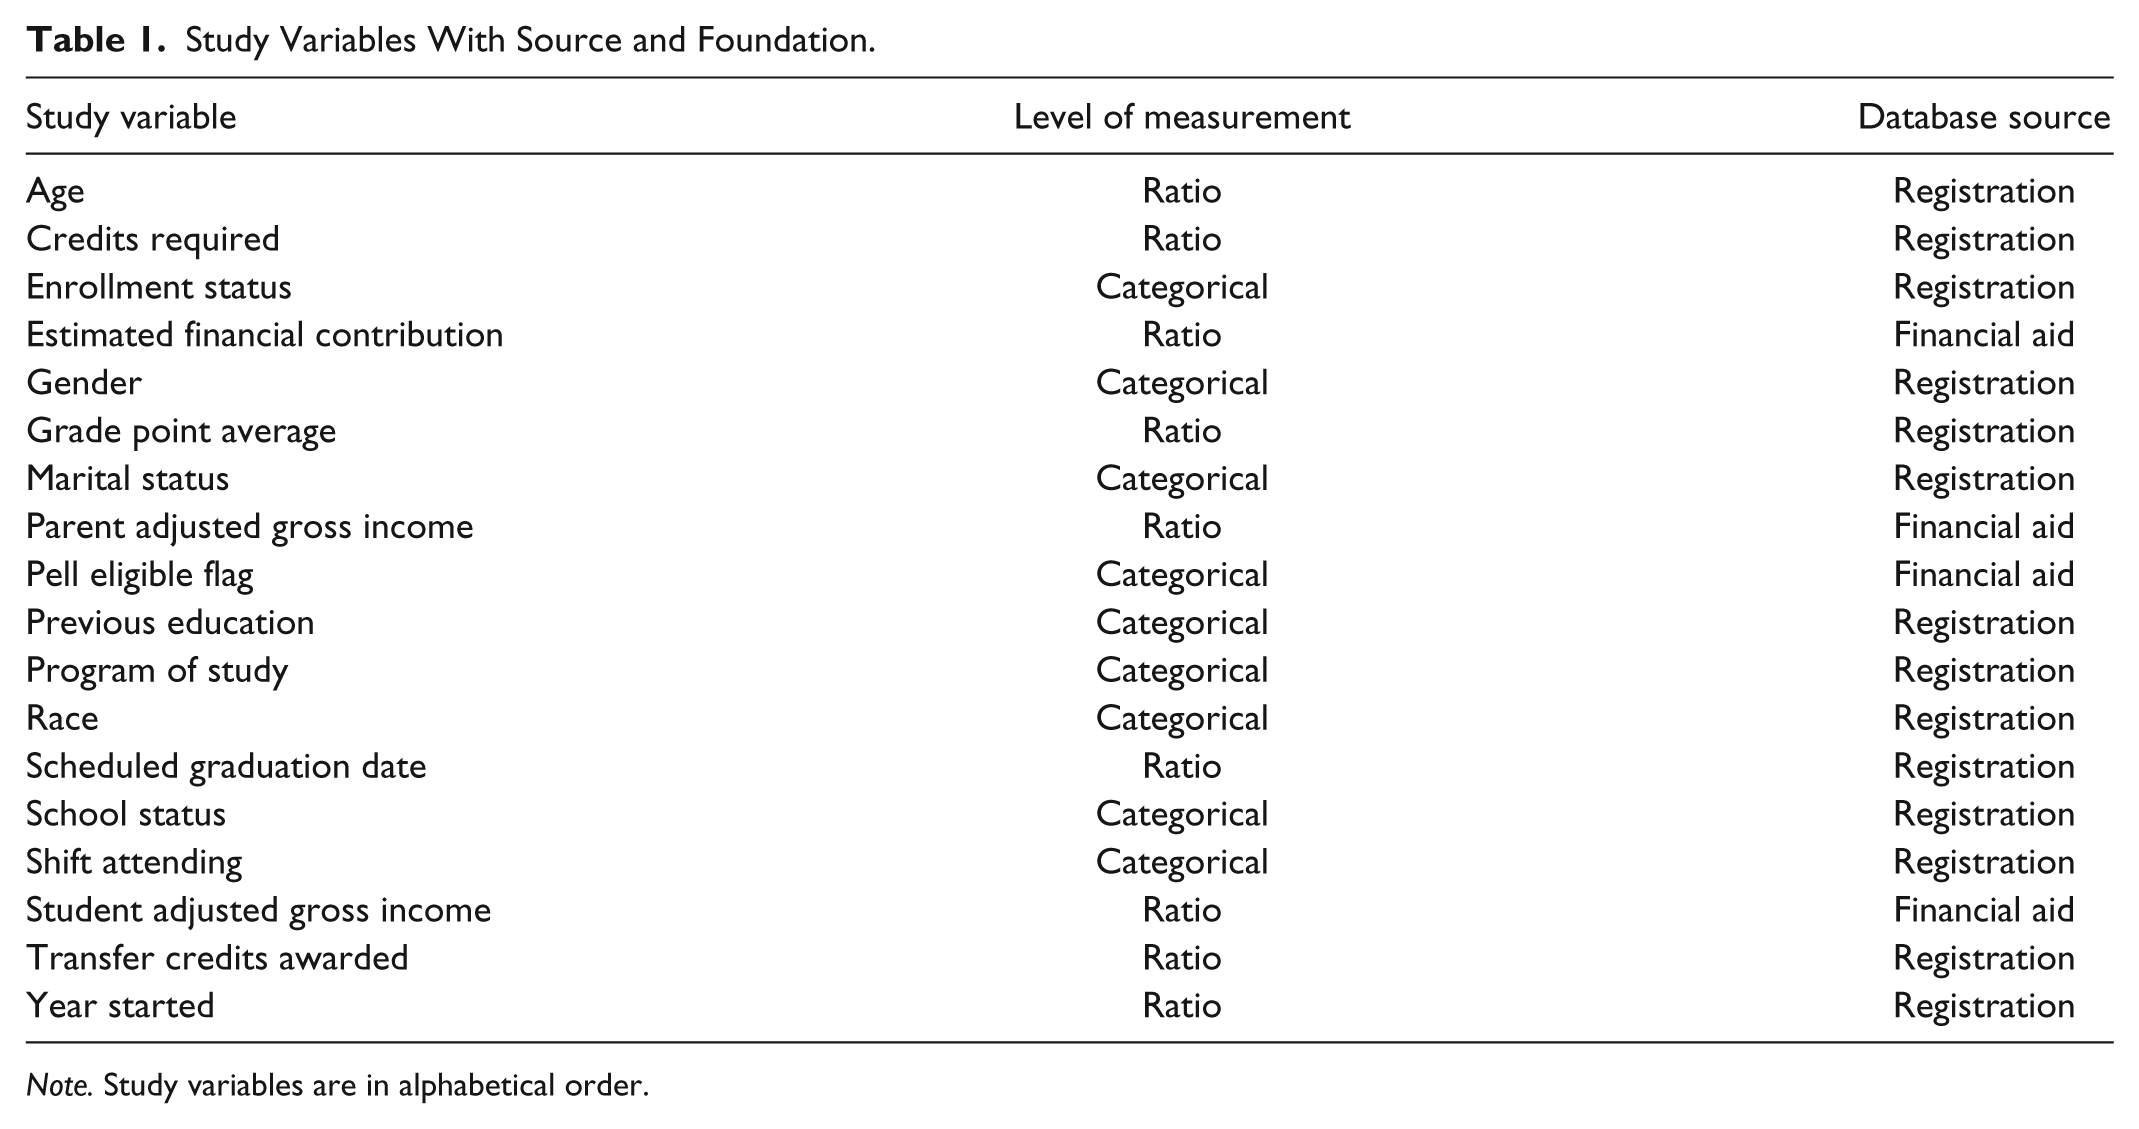
This study included the entire population of new undergraduate students who enrolled at a single for-profit university campus from 2005 to 2009 with a scheduled graduation on or before June 30, 2011. There were 2,548 such students, each of which had a corresponding record in the study database. Each record included the fields illustrated in Table 1 as independent variables along with (a) a dichotomous dependent variable to indicate school status and (b) the year of enrollment as an independent control variable. The independent variables were organized using the Bean and Metzner framework into four categories: background and defining variables, environmental variables, academic variables, and academic outcome.
Study Variables With Source and Foundation.
Note. Study variables are in alphabetical order.
Background and Defining Variables
Background and defining variables included the continuous independent variables age (AgeCalc) and transfer credits awarded (TransferCredits). The mean age was 28.6 with standard deviation 8.8; the range was 15 to 68. A histogram of the age variable follows in Figure 2. Eight students had no birth date in the dataset, so their age could not be calculated. Transfer credits ranged from 0 to 140; the mean was 8.4 with standard deviation 17.9. Because the study used a logistic regression analysis, which does not require independent variables to be normally distributed, no tests for normal distribution were conducted.

Distribution of study age variable ageCalc.
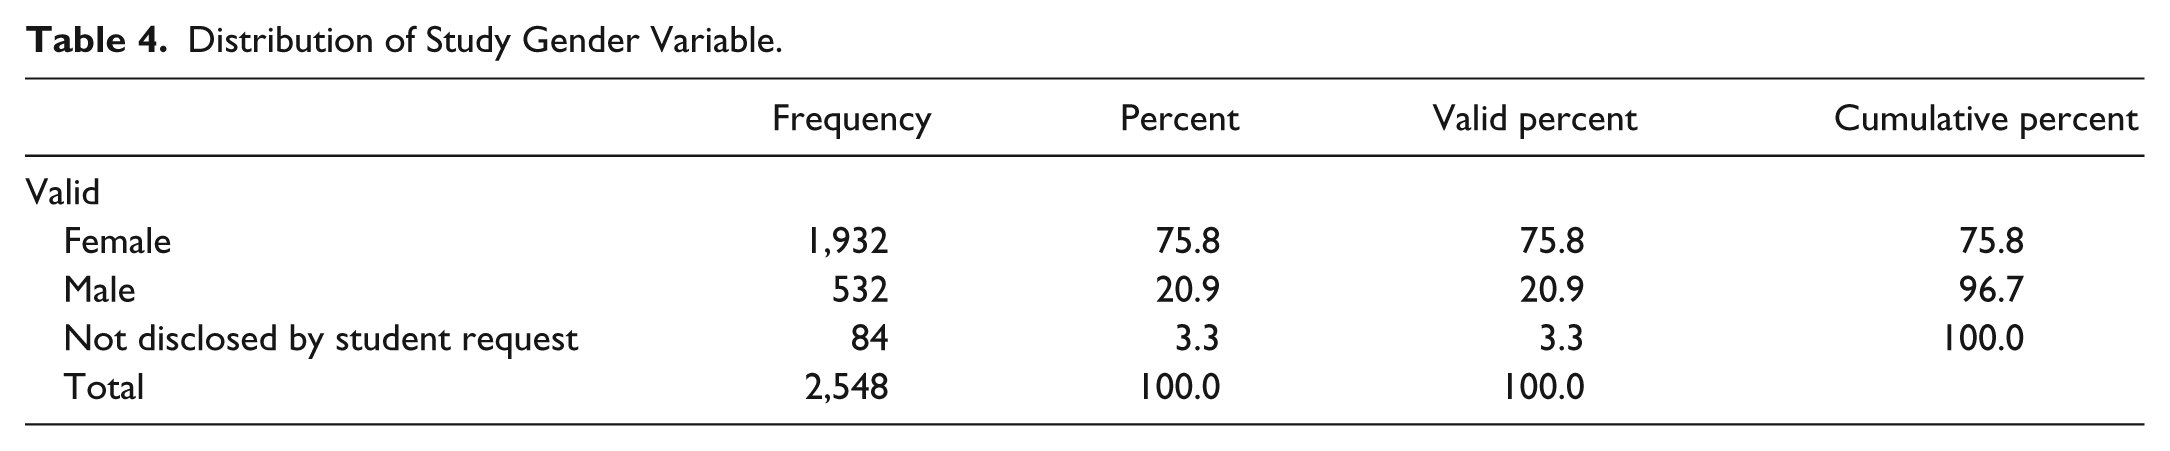
A histogram of transfer credits appears below in Figure 3. This category also included the several independent variables enrollment status (LstTrmCode), race (RaceCode), gender (SexCode), program of study (ProgramCode), and previous education (PrevEducCode). The distribution of values among these variables is shown in Table 2 through Table 6. While 25.2% of race values were missing, none of the other variables had missing values.

Distribution of study transfer credits variable.
Distribution of Study Enrollment Status Variable.

Distribution of Study Race Variable.

Distribution of Study Gender Variable.
Distribution of Study Program of Study Variable.

Distribution of Study Previous Education Variable.

The logistic regression required a reference value for each categorical variable. The reference values for this category were full-time enrollment status, White, females who enrolled in an Allied Health program with a high school diploma. This derives largely from the IPEDS measure of first time, full-time students. For the study campus, as with many across the United States, females outnumbered males among the student population. This suggested that female gender would be the most appropriate reference value. Similarly, while it offered other programs, the study campus featured Allied Health programs throughout its history.
Academic Variables
Academic variables included the continuous independent variable credits required (CreditsReq) and the dichotomous variable shift attended (Shift). Credits required ranged from 66 to 186; Figure 4 illustrates the distribution for this variable. Some 66.8% of students attended during the day and 33.1% attending during the evening. There were two missing values for the shift attending variable, which represented 0.1% of the records. The reference value for shift attending was day, which corresponds with the full time reference value for enrollment status.
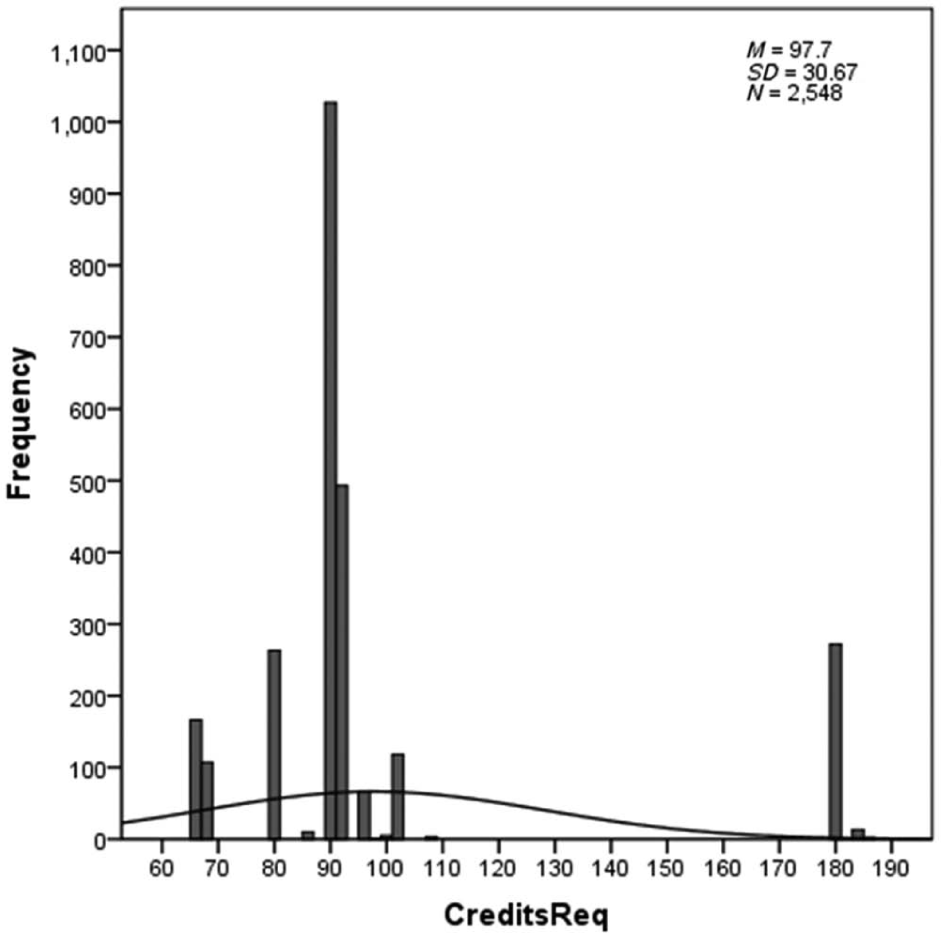
Distribution of study credits required variable.
Environmental Variables and Academic Outcome
Environmental variables included three continuous independent variables, one dichotomous independent variable and one categorical independent variable. The three continuous variables each had 103 missing values. First was primary estimated financial contribution (PEFC), 6 which was the average amount determined by the USDE across each student’s loan applications during their time of enrollment. Next, were the student adjusted gross income (StudentAGIr) and the parent adjusted gross income (ParentAGIr). As mentioned in the section above, these three variables were divided by US$100 to ensure the regression coefficient was larger than .0005. Table 7 summarizes the descriptive statistics for these three variables before the division by US$100.
Distribution of Study Variables for Finances, Before Division by US$100.
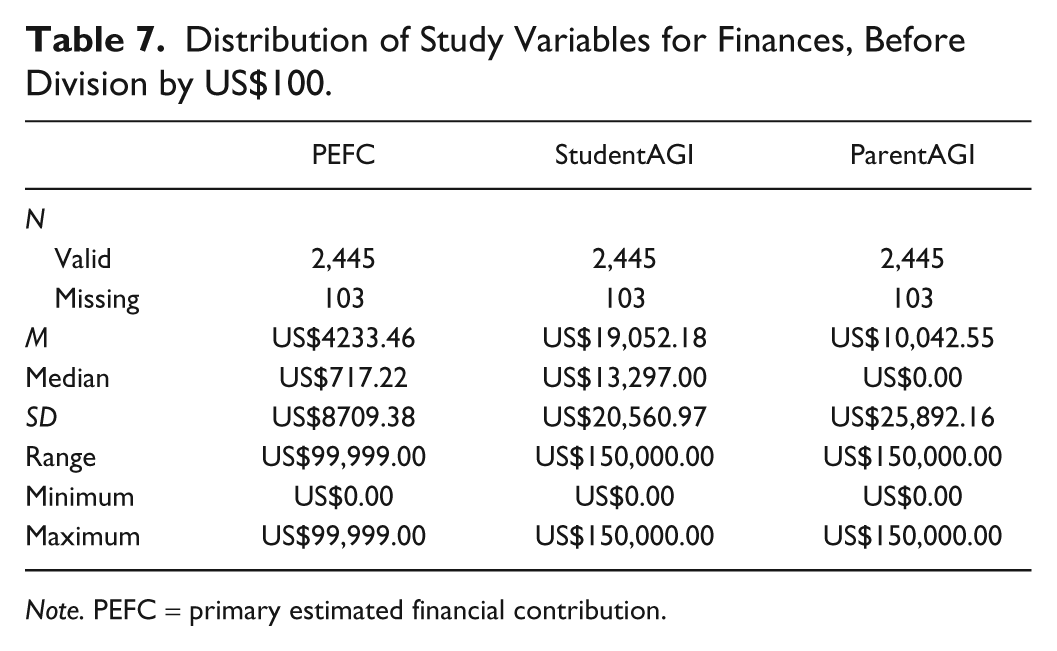
Note. PEFC = primary estimated financial contribution.
The Pell eligible flag (PellEligible) indicated whether student income was low enough to quality for the federal Pell grant program. This flag had two values: 34.1% of students were Pell eligible and 65.9% were not. The categorical variable was marital status (MaritalCode) for which 35.2% of the values were missing. Some 45.8% were single, 14.5% were married, and 4.6% were separated, widowed, or divorced. The reference value for marital status was single, which matches the IPEDS first time full-time measure.
The academic outcome variable was GPA. There were no missing values for this variable. The mean was 2.48 with a standard deviation of 1.27. The GPA ranged from .00 to 4.00.
Correlations
Before finalizing the analysis, a test of correlations was performed to determine interaction among the variables. There were two instances of high correlations. One instance included the correlations of PEFC with studentAGI (−.603) and parentAGI (−.649). To address these correlations, studentAGI and parentAGI were removed from the regression analysis. This aligned with the USDE’s PEFC calculation, which accounts for the adjusted gross income of the student and their parent (if applicable). As a result of this change, PEFC displayed a .567 correlation with the Pell eligible flag. As Pell eligibility is a categorical representation of a student’s finances, it was removed from the regression in favor of the continuous variable PEFC.
A second instance was a correlation of −.440 between transfer credits and credits required. The regression analysis removed transfer credits, as this variable is embedded in the credits required for each student to complete their degree program. The result of addressing these two instances was that no variables had correlation absolute values .4 or higher, only two variable pairs had correlation absolute values between .3 and .4, and all other variable pairs had correlation absolute values less than .3.
The absolute value of correlations between independent variables and the dependent variable all were lower than .2. Only two pairs of independent variables had correlations with absolute values between .3 and .4; both were tolerable. One was a correlation of −.309 between GPA and enrollment status less than half time. This reflected the scenario where unsuccessful students would withdraw from or fail most of their classes in their last enrolled term. The other correlation was −.360 between credits required and the shift attending. This reflected the program mix at the study campus. Allied health programs, which required fewer credits, all were offered during the day shift. As a result, the average credit requirement was higher for students attending the evening shift.
Multiple Logistic Regression Analyses
After correcting for high correlations, five regression analyses were conducted on a total of 12 independent variables. A summary of these models follows in Table 8. The fifth model was powerful, correctly predicting graduates 85.0% of the time and nongraduates 88.2% of the time. This model was 87.1% accurate overall with a Nagelkerke R2 of .663 (χ2 = 931.860, df = 22, p < .001).
Log-Odds Coefficients Exp(B) for First Round Regression Models.

Note. For α = .05. GED = general education development; PEFC = primary estimated financial contribution; GPA = grade point average.
p < .05. **p < .01. ***p < .001.
In all of the models in which enrollment status appeared, two values were significant with p < .001. Students attending half time had 62.2% lower odds of graduating than those attending full time. Students attending less than half time had 97.6% lower odds of graduating. Students attending three quarters time had 110.9% higher odds of graduating, though these odds were significant only at the p < .05 level in the most robust model.
While enrollment status results were similar across models, results for program of study and race were not. Specifically, the criminal justice program became less statistically significant with successive regression models. Significance decreased from p < .001 in Models 2 and 3, to p < 0.01 in Model 4, and p = .897 in Model 5. This suggests that the role of environmental variables, academic variables, and academic outcome overrides the impact of academic program on graduation odds.
In contrast, none of the race values were significant in Models 2 through 4, though they all showed Blacks with lower odds of graduating than Whites. But in Model 5, where the regression accounted for GPA, Blacks showed 165.4% higher odds of graduating than Whites with p < .001. In addition, GPA was significant with p < .001. The regression coefficient showed that with each increase of one point in GPA, graduation odds increased by 855.6%. To further investigate how GPA impacted odds for Black students, analysis was conducted on the GPA for graduates by race. The results illustrated in Figure 5 suggest that on average, Black graduates had lower GPAs than White graduates. The odds of graduation were higher for Blacks because a larger proportion of these graduates had GPAs between 2.0 and 2.5.

Distribution of study GPA for White graduates and Black graduates.
PEFC (divided by US$100) was significant in Model 4 with p < .001. With the addition of GPA in Model 5, PEFC remained significant but with p < .05. The results for both models were quite similar; for each US$100 increase in PEFC, odds of graduation increased by 0.3% to 0.4%.
Once the five significant factors were identified, a second round of logistic regression analysis was conducted. This round maintained variables in categories that matched the Bean and Metzner framework. The regression models follow in Table 9 below. These models produced two salient results. First was that using only the predictors of enrollment status, race, credits required, and PEFC (Model C in the table) produced 74.3% overall accuracy. This model was equally accurate for nongraduates (76.2%) and graduates (71.0%). It was noted that all of these predictors could be identified before a student began their program at the study institution. Second was that using the predictor GPA alone (Model E in the table) produced 74.7% overall accuracy. Unlike the results above, this model was much more accurate in predicting nongraduates (81.3%) than graduates (61.7%).
Log-Odds Coefficients Exp(B) for Second Round Regression Models.
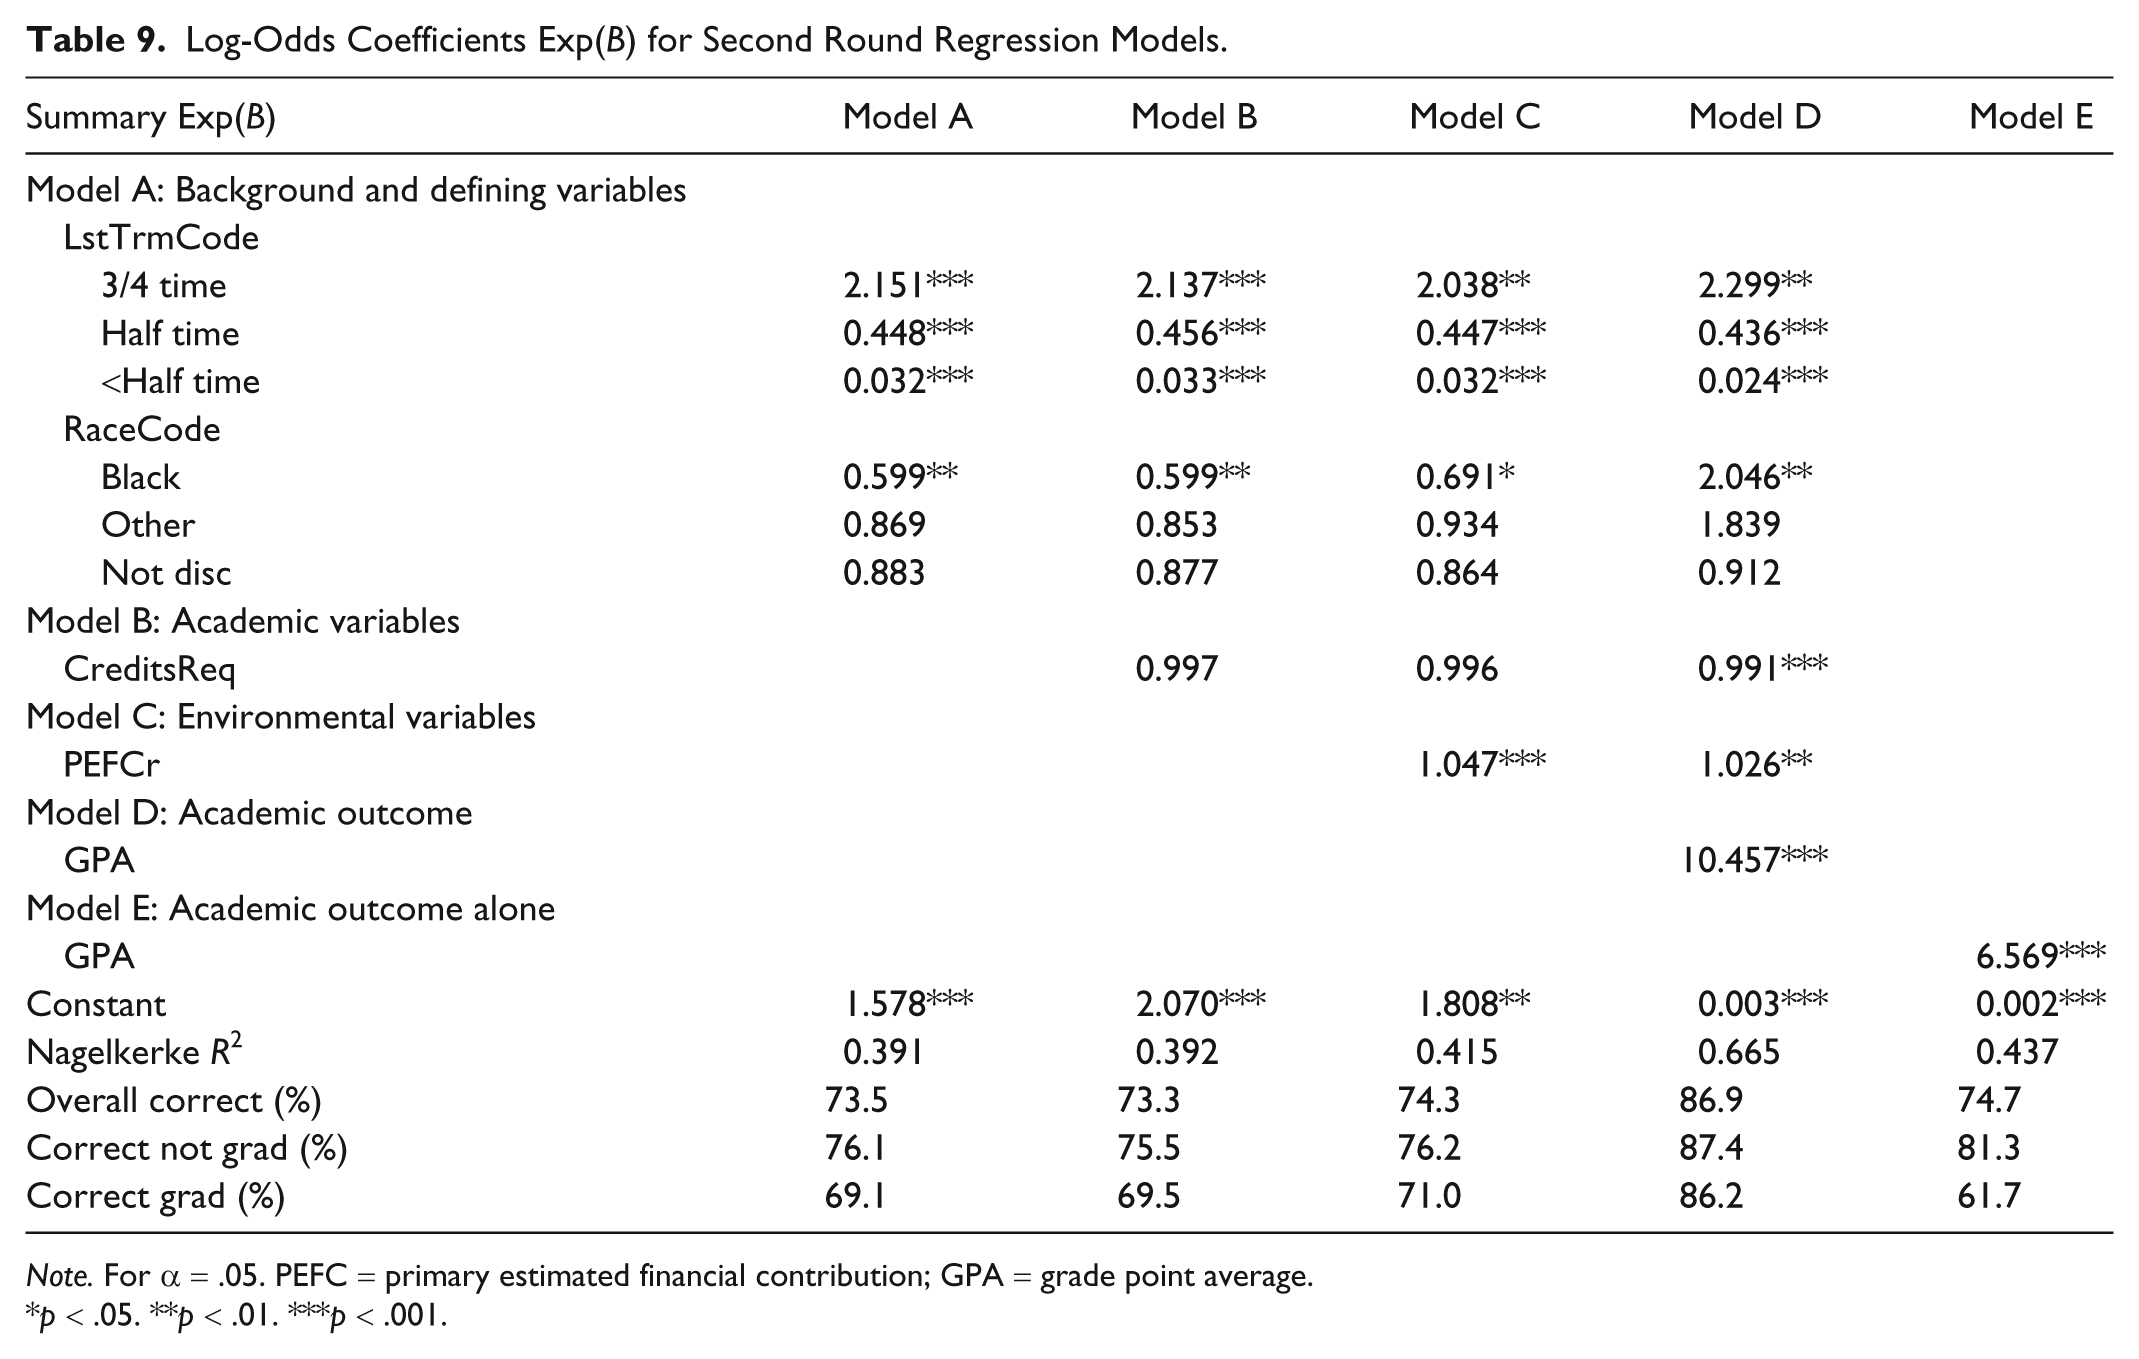
Note. For α = .05. PEFC = primary estimated financial contribution; GPA = grade point average.
p < .05. **p < .01. ***p < .001.
Summary
This study included the entire population of new undergraduate students who enrolled at a single campus from 2005 to 2009 with a scheduled graduation on or before June 30, 2011. There were 2,548 such students. Using the Bean and Metzner framework to categorize independent variables, the study used multiple logistic regression models to predict the dichotomous dependent variable indicating whether each student graduated or not. These models were adjusted to remove three variables that were highly correlated with other variables. After these adjustments, no independent variable had significant correlations with the dependent variable. Furthermore, only two variable pairs had correlations with absolute values between .3 and .4; both were expected based on operations at the study campus.
The study definitively answered both research questions. The first question was: How accurately do student characteristics predict the odds of graduation from the study for-profit institution? Based on the regression model, the answer is with 87.1% accuracy overall, correctly predicting graduates 85.0% of the time and nongraduates 88.2% of the time. The Nagelkerke R2 was .663.
The second research question was: Which characteristics weigh most heavily in predicting graduation odds at the study for-profit institution? The regression models found five such characteristics; taken together, these predicted graduation with 86.9% accuracy. The significant factors in the order of highest impact on log odds of graduation were (a) GPA, where higher values led to better odds; (b) half time enrollment status, which had much lower odds than full time; (c) Black race, which had higher odds than Whites; (d) credits required, where lower values increased odds; and (e) PEFC, where higher values increased odds.
Discussion and Implications
Discussion
This study largely validates the Bean and Metzner framework in the specific context of a for-profit institution. Figure 6 highlights the portions of this framework that the study found to be significant, which include GPA, enrollment status, race, credits required, and PEFC. This study also provides ground-breaking results with the highest predictive power on record in the literature. With 86.9% accuracy and a Nagelkerke R2 of .663, this study’s predictive power flows from its strong internal validity.

Study findings in the Bean and Metzner framework.
Still, there are two findings that run contrary to current policymaking assumptions. First is that four of the five significant predictors are facts that could be known about a student before they began their studies at the for-profit institution. Specifically, the regression model predicts graduation with 74.3% accuracy based solely on a student’s enrollment status, race, credits required for their degree program, and PEFC. For the study campus, institution characteristics and student attitudes only could provide another 13.1% accuracy to the prediction. 7 This places policymakers and higher education institutions in a difficult situation. On the one hand, increasing regulation of for-profit institutions would reduce their capacity and thereby cripple U.S. efforts to make large increases in the number of college graduates. And on the other hand, because student characteristics have such a dramatic impact on graduation odds, for-profit institutions would see little change in student graduation despite their best and most fervent efforts. In this situation, federal policymakers would find their efforts frustrated by the fact that student characteristics have a far larger impact on graduation than institution factors such as tax status and quality.
This finding is not surprising given the conventional wisdom about graduation success factors. In a February 2012 report advising the U.S. Secretary of Education on how to increase college completions, the Advisory Committee on Student Financial Assistance (2012) identified three studies that the typified barriers adult learners face in higher education. The first was by De Vito (2009), who found that lack of time causes adult learners to struggle with their studies. This finding is confirmed by the present study, which found that half-time enrollment led to much lower odds of graduation than full-time enrollment. One effective way to change this situation would be a policy that provided increased funding for lower income students, which would provide incentives for them to attend school full time.
This report also referenced a study presented by Kazis et al. (2007) to the U.S. Department of Labor. They found that long program duration was problematic for adult learners. The present study had similar results, with higher credits required leading to lower odds of graduation. Third, this report mentioned the Western Interstate Commission for Higher Education and its 2010 summary of a six-state, funded research project that identified barriers to adult student success (Michelau & Lane, 2010). That project found that financial aid concerns were among the most significant barriers. The present study also found that financial aid played an important role through the PEFC variable and its positive correlation with graduation odds.
A second finding contrary to current policy relates to GPA. Graduates from the study institution had to maintain a minimum GPA that range from 2.0 for Business and Criminal Justice programs to 2.6 for its several Allied Health programs. This is consistent with nonprofit institutions; for example, 2.0 is the minimum GPA for continued participation in NCAA sports programs (National College Athletic Association, 2011). Despite the overall power of this variable, which predicted failure to graduate with 81.3% accuracy, it was much less accurate at predicting successful graduation (only 61.7% accuracy). It is counterintuitive and unexpected that student background and environmental variables would more accurately predict graduation than their performance in school. Schneider and Ingram (1993) described situations where policy making is made more difficult because of the participation behavior of target populations. For profit, higher education appears to be just such a situation, where school performance does not necessarily indicate likely graduation. An example of this comes from Black students at the study institution. As discussed above, these students were much more likely than Whites to graduates with a GPA between 2.0 and 2.5. Public policies that rewarded high GPA and punished low GPA would disproportionately impact Black students; this certainly would not be the desired policy effect.
Policy Implications
There are two major policy implications of this study. The first relates to public policy emphasis. Student characteristics were sufficient to predict graduation from the study campus with at least 85% accuracy. This strongly suggests that individual student success was not related to the characteristics of the institution they attended. As a result, Title IV loan programs should continue to be available for students despite the kind of institution they choose to attend. The Government Accountability Office recently found that nonprofit institutions are receiving less support from state governments each year (Government Accountability Office, 2012). This creates a need to secure higher education capacity across public and private institutions. Researchers have found that for-profit institutions have stepped in to fill this need in multiple countries, including Brazil and the United States (Douglass, 2012).
Some policy makers have pointed out that negative externalities and societal costs have resulted from some for-profit institutions (Gramling, 2011). But a significant body of research has shown that there are far more societal benefits than costs to expanding the number of U.S. college graduates. For example, Pascarella and Terenzini (2005) conducted an exhaustive review of the literature on college success that spanned three decades. They concluded that higher education has a long intergenerational legacy, where the odds of future generations graduating from college depend greatly on college success of the current generation. Furthermore, given the results of this study, student graduation may have little to do with institutional factors.
More recently, Belfield, Henry, and Rosen (2012) developed a detailed cost-benefit analysis of higher education. In 2011, approximately 6.7 million young people ages 16 to 24 were projected never to engage in higher education or training beyond high school. The authors estimated that over their lifetimes, each individual in this age group during 2011 would cost taxpayers US$231,454 (net present value). The aggregate cost for all these individuals would be US$1.56 trillion (net present value). This figure included lost taxes from lower wages earned, additional health care expense shifted from this group to taxpayers, criminal justice system spending, and welfare payments. The aggregate cost figure included offsetting benefits of lower education spending, though the impact of this benefit was quite small.
But more is at stake for society than the costs and benefits of higher education. A reporter enrolled at a large U.S. for-profit institution in late 2011 (Beha, 2011). He was surprised by what he called the genuine warmth and enthusiasm of the admissions staff. Noting the weak college readiness of many high school graduates across the United States, he made an interesting observation: “If the system fails these students, it does so in many cases long before they step into a college classroom.” He summed up his experience with the story of a student who had at first struggled with her classes. Some months after he met her, she was carrying a relatively low GPA but still working hard on fulfilling her degree requirements. He asked whether she thought her experience at the institution was worth the struggle. She replied, “Oh, definitely. . . When I get my degree, it’s going to be a whole different ball game.” This individual’s experience typifies the policy implication: Students are much better than policy makers at deciding their education prospects.
A second major policy implication follows from the fact that Blacks had higher odds of graduating than Whites at the study campus. USDE should explore how for-profit institutions can benefit Black students, especially as the literature does not suggest that Blacks have higher (or even equal) odds of graduating than Whites at traditional institutions. Some insights into why Blacks were so successful at the study campus can be found from an unusual source. Rev. Jesse Jackson provided this quote at the January 2012 National Newspaper Publishers Association conference: “If the playing field is level, the goals are defined, the rules are clear and the adjudication is fair and transparent; we (Blacks) can win. That’s why so many Black athletes excel. The same is true for all aspects of our lives” (Rivercity Xaminer, 2012).
Similar perspectives are offered from traditional academic research as well. Harper (2012) found that while they tend to perform lowest on traditional achievement measures, Black men still find success in graduating from institutions where they found engaging college activities outside the classroom. Such activities included student organizations and building meaningful relationships with faculty and staff.
Study Limitations
The study is limited primarily by its focus on internal validity. Given this focus, the study results must be interpreted with care. There are two approaches that policymakers can use to overcome the study limitations. First is to combine the findings of this study with others that build on the Bean and Metzner framework (or its predecessor from Tinto, 1975). In particular, combining results from this study with the separate research by Sauchuck (2003) and Boggs (2007) yields a set of findings that are largely consistent. The strongest predictors of college graduation across all three studies including prior academic preparation, enrollment status (also known as credit load), age, financial aid required, race, and entrance test scores. Second, study application can be made to other institutions by implementing weights in the logistic regression model. Folsom and Singh (2000) provided a procedure for such implementations.
The study is also limited by its quantitative research design. Frameworks like Bean and Metzner have included a combination of quantitative and qualitative research techniques. These frameworks present a more rounded perspective of effects and their underlying causes. However, this limitation is not fatal to the study conclusions; no research on record has produced higher predictive power than the present study.
Proposed Future Research
Given the high predictive accuracy of this study’s regression model, the primary recommendation for future research is to replicate the study at other institutions. This study focused on a for-profit campus that delivered courses predominantly on ground. Using weights would be useful in extending the findings to other ground-based campuses, whether they are for-profit or nonprofit. Along these same lines, future qualitative research could identify why Black students find greater odds of graduation at the study for-profit institution than White students.
It will be important to conduct further research factors that impact graduation from predominantly online institutions as well. Given the rise of online delivery across for-profit and nonprofit institutions, such research would be vital for effective higher education policymaking. For example, if other institutions also found that student characteristics were highly predictive of graduation odds, policies would need to place much more emphasis on social, financial, and academic preparation for college study. Early results have been discussed at various industry conferences by participants in the Predictive Analytics Framework. As part of an April 2011 grant from the Bill and Melinda Gates Foundation, the Western Interstate Commission for Higher Education Cooperative for Education Technologies has undertaken an expansive data aggregation project using the framework. This cooperative has built an impressive dataset with several million records across two for-profit institutions (American Public University and University of Phoenix), two large state universities (University of Illinois, Springfield, and University of Hawaii), and two community colleges (Colorado Community College System and Rio Salido College at Tempe, Arizona). Wagner, Iboshi, and Okimoto (2011) from the University of Hawaii have documented the framework’s intent to facilitate research on factors impacting loss, progression, and completion for the age 26 and under demographic among U.S. college students. Eventual peer review and publication of analyses on this dataset could provide helpful insights into policymaking.
A third recommendation is to explore how the potential for replicating results from the study institution, which showed greater graduation odds for Blacks. In 2011 testimony to the U.S. Congress Advisory Committee on Student Financial Assistance, researchers noted that the federal government can encourage best practices in this area by making research grants to institutions under the Title III of the Higher Education Act (Choitz & Strawn, 2012). Title III typically has focused on Historically Black Colleges and Universities. However, given the graduation odds for Blacks at the study campus, effective policymaking about Black students would require more study of how this group fares at a broader set of institutions, including for profits.
Footnotes
Declaration of Conflicting Interests
The author(s) declared no potential conflicts of interest with respect to the research, authorship, and/or publication of this article.
Funding
The author(s) received no financial support for the research and/or authorship of this article.