
Abstract
The reliability and validity of course grades as measures of general education learning outcomes were assessed using the multitrait-multimethod (MTMM) proposed by Campbell and Fiske. Convergent validity and discriminant validity were assessed on college undergraduate students over a 12-year period. Two procedures were used to test the MTMM. The first procedure was a nested confirmatory factor analysis proposed by Widaman. The second procedure, proposed here, was a direct method to assess discriminant and convergent validity. The analyses were calculated on two different data sets. The data sets included discipline majors and general education categories. Convergent validity and discriminant validity were supported.
Keywords
Despite considerable agreement among educational researchers that course grades have a place in assessing general education (GE) learning outcomes, concerns about their usefulness still remain. Over time, course grades have been utilized in educational settings to provide information and feedback to the student and the institution about overall progress and student learning outcomes (Burns, 2011). “Grading is one of the fundamental facets of education” (Schneider & Hutt, 2014, para. 1). Course grades in higher educational institutions have been pivotal in terms of assessing student knowledge, skills, and competency in awarding degrees and specialized certifications. Although grading has been a primary practice throughout educational systems, there are proponents who disagree with their use, relevance, validity, and reliability. The criticism is most often leveled at outcome evaluation.
Many of the most important educational decisions we make about young people concern summative, often irreversible, judgments regarding entry to or exit from programs or institutions . . . Grades and test scores are the two types of evidence most commonly used in supporting these judgments. (Willingham, Pollock, & Lewis, 2002, p. 1)
Course grades are most often depicted using the traditional “letter grade” system (A, B, C, etc.). Most schools and institutions throughout the United States, at elementary, secondary, college, and university levels, use this seemingly universal grading system. Educational and teacher training programs also provide instruction on the use and assignment of course grades as values instructors must be able to assign to students. Programs and instructors often find course grades helpful in understanding student’s ability, skills, and knowledge (Berrett, 2012) and in making educational admissions decisions (Sternberg, Bonney, Gabora, & Merrifield, 2012).
At many U.S. universities, course grades are assigned by professors at the end of most courses. The grading systems in place may vary to some degree by institution, in terms of what constitutes an A+, an A, an A–, and so on, which lends itself to criticism by those who feel course grades are more arbitrary and not useful in their evaluation of student learning. This is further exacerbated by the variation of grading and marking systems within institutions, among instructors, across and between disciplines, and even among the various program levels of education (undergraduate, graduate, certificate, and post-graduate). Based on the variations, critics of course grades question the validity and reliability of assigning course grades for the purpose of outcome and evaluation (Clayson, 2009).
Part of the contention between those who support and those who oppose the use of course grades includes the method by which the grade is derived. Some programs and teachers may use various methods to assess student learning (Sternberg et al., 2012). The course grade could include extraneous assessment of participation, attendance, and assessment not related to the target GE category. The variation in instructor’s grading criteria and grading emphases contributes to a nonstandard system of determining course grades (Knapp & Hamilton, 1978; Rogers, 2003; Straight, 2010). Critics propose that course grades are based on the assessment of one instructor; therefore, there is no check for reliability, nor is there any relationship to future achievement (Hoyt, 1965). It is also unclear what specific learning outcomes in the course are relevant to the grading process. In addition, it is often unknown what a grade for a specific course means concerning the learning outcome (Maki, 2004; Penn, 2011; Rogers, 2003; Suskie, 2009).
Authors Fenwick and Parsons (2000) proposed in their book on The Art of Evaluation that evaluation itself is both an art and a science. The authors proposed that assessment and evaluation are important aspects in providing students with feedback about their progress (Fenwick & Parsons, 2000). Furthermore, they provided a multitude of ways instructors may provide students with feedback. They inferred that there is a distinct difference between the terms “evaluation” and “assessment.” They explained that assessment is both formal (e.g., tests, assignments) and informal (e.g., class activities, question and answer as a part of post-assessment at the end of a lesson; Fenwick & Parsons, 2009). In addition, they explained that evaluation aims to provide the outcome across the entire course or program, such as a course grade or student grade point average (GPA; Fenwick & Parsons, 2000).
This is similar to other suggestions in the description and attempts to distinguish between the terms “assessment” and “evaluation” in educational contexts. Purdue University’s Center for Instructional Excellence expands further on these concepts. Assessment is presented as a combination of methods aimed to inquire about and assess student learning (Palomba & Banta, 1999). Meanwhile, evaluation is explained as an organized process for making decisions about the value and worth of someone (i.e., a student; Purdue University, n.d.).
The field of education and higher education strives to promote best practices in marking, grading, and reporting practices. In efforts to challenge the assumptions and address concerns of students and interested others, teacher education programs have included more materials devoted to these topics (e.g., Cartwright, Weiner, & Streamer-Veneruso, 2010). It is evident throughout the literature that the attribution of course marks and student grading is an issue of considerable discussion; all one need do is Google “student grades” or “the use of course grades” and the volume of information is astounding to the researcher. Evident in the findings is that course grades are still a contentious issue.
Some criticize the use of grading in general, indicating that faculty members appear to have different grading criteria (Rogers, 2003). However, others will contend that the course grade is based on the assessment of one faculty member only; inferring there is no check, or cross-check, on reliability and validity of the assigned mark value. Overall, these remarks put into question the utility of testing as a form of determining the student’s course grade (Walstad & Becker, 1994).
Overall, many of the limitations imply that there is a lack of reliability and validity for the use of course grades in assessing student learning outcomes. This study was designed to test reliability and validity of instructors assigning course grades, as well as to demonstrate a relationship among course grades in GE and related major courses. This study examined the strength of relationships within categories of GE and major courses—including significant differences—with the intention of providing educators with greater confidence in course grades.
Previous researchers have applied multitrait-multimethod (MTMM) in their examination of the concept of validity and reliability of tests and assessment measures. The previous research has examined the validity of tests as applied in elementary school achievement, with youth, and in the use of preparatory post-secondary examinations (Amrein & Berliner, 2002; Shermis & Long, 2009; Tindal & Nolet, 1990). Marsh (1992) examined self-concept and achievement (grades) with boys in Grades 7 to 10 and used MTMM to test the hypothesis that “the relations between academic self-concepts and academic achievement will exhibit both convergent and discriminant validity” (p. 37). There is limited research applying MTMM in the examination of course grades at the undergraduate level. This research contributes to the awareness of the validity and reliability of course marks and grading in undergraduate university settings through the use of two MTMM based procedures; one established method (Campbell & Fiske, 1959; Widaman, 1985) and the other, a relatively novel method proposed as an alternative approach using MTMM analysis.
Method
Course grades were selected from a pool of 2,400 courses for undergraduate students who were enrolled between fall 2000 and fall 2013 at a university in New York with an undergraduate enrollment between 5,000 and 6,000 students. Two different data sets were obtained: (a) one set for analyzing disciplines (departments; majors; these words are used interchangeably in this article), and (b) another for analyzing GE categories. Courses were identified by discipline, GE category, and course number. A course could be entered into either data set or both data sets if it met the criteria; the criteria for discipline (department; major) were a sufficient number of courses and students enrolled, while the criteria for GE were that it was designed by the GE committee as being a GE course. A criterion for both sets was that the grading system was A, B, C, D, and F. Grades entered as pass/fail or satisfactory/unsatisfactory were not used in the analysis. There were a total of 1,793 courses in the discipline sample and 334 in the GE category sample. Not all disciplines were used because some disciplines (departments, majors) contained a small number of students. In addition, not all designated GE categories were used (see below). Courses were randomly assigned to either Method A or Method B within the GE categories and were also randomly assigned to either Method A or Method B within the disciplines (majors). For example, all courses with the name beginning with SOC (“Sociology”) were randomly assigned to either Method A or Method B. The same was true for each of the other discipline courses (Biology, Math, etc.). Likewise, the courses in the GE category “Presentation Skills” (for example) were randomly assigned to Method A or Method B, and the other GE categories were assigned in the same manner. Overall, two completely distinct analyses were conducted based on data extrapolated from the same data set.
A student’s data were entered into the data set when they were enrolled in a course in Method A and Method B in a specific discipline, such as Biology (BIO). For example, a student could be selected if they took BIO111 (Method A) in their first year on campus and BIO307 (Method B) in their third year on campus. If a student took more than one course in either Method A or Method B (within BIO), then the mean value of that student’s grades for those courses taken in that discipline and Method was used. For example, a student may have taken BIO110 (Method A) in their first year and then taken both BIO202 (Method B) and BIO304 (Method B) in their second and third year. Consequently, the measurement used in the Method B for that student would be the mean grade value for the courses BIO202 and BIO304. A student would have only one pair of grades for each discipline or GE category. However, a student could be selected for any number of different disciplines or GE categories if the criteria were met for that discipline or GE category. It was these pairs of grades that were used in the correlation matrix. There were two such correlation matrices: one for GE categories and one for disciplines.
An analysis was completed for each data set (discipline and GE category). Each course was identified as one of the 1,793 courses and only represented once, even if it was delivered numerous times during the period of analysis. The first three letters of each course identified the department (or discipline) delivering the course, and the associated course number identified the specific content area of the course. For example, PSY101 (Psychology), HIS100 (History), and ATH201 (Art History) would indicate separately identified courses. The data in the current study represent 33,352 students.
As indicated within the above categorizations, some courses were designated as GE courses. Course designations for 11 GE categories were analyzed in the current study and are specified as follows: (GE1) quantitative skills, (GE2) natural sciences, (GE3) social sciences, (GE4) United States history and society, (GE5) western civilization, (GE6) contrasting cultures, (GE7) humanities, (GE8) the arts, (GE9) foreign language, (GE10a) basic communication, academic writing, (GE10b) basic communication, presentation skills, and (GE11) prejudice and discrimination.
This article presents two methods of analysis, among many, that have been used to assess MTMM. First, it applies the Widaman (1985) method, frequently used and applied in MTMM analyses. Second, it presents an alternate approach: a direct comparison method of traits to non-traits. The outcomes of these two methods of analyses will be compared in terms of the best model fit.
The MTMM procedure, developed by Campbell and Fiske (1959), guided the analyses of the current data using two different procedures. Although designed more than 50 years ago, this procedure is still widely utilized in psychometrics for assessing convergent and discriminant validity. A summary of the MTMM process follows. A correlation matrix is divided among variables into three categories: (a) relationships among the variables of the same trait (referred to as the validity diagonal), (b) relationships among variables using similar measuring instruments or procedures (methods), and (c) relationships that had neither traits nor methods in common (Byrne, 2006; Campbell & Fiske, 1959; Widaman, 1985).
The criterion for convergent validity is that correlations with the same trait should be higher (correlations in the validity diagonal), whereas the criterion for discriminant validity is that the within trait correlations should be larger than the within method correlations and that both of these should be larger than all of the other correlations within the matrix (Campbell & Fiske, 1959). An expanded description of this procedure is provided throughout the psychometric literature (Byrne, 2010; Campbell & Fiske, 1959; Furr & Bacharach, 2008; Marsh & Hocevar, 1983; Trochim, 2006). Trochim (2006) described having a methods factor is not a requirement needed to meet the specifications of convergent and discriminant validity in assessing construct validity as previously prescribed (Campbell & Fiske, 1959; Cronbach & Meehl, 1955). Trochim proposes trait correlations of a matrix (convergent validity) must be larger than all of the other correlations of the matrix (discriminant validity).
If the mathematics course grades are correlated with other mathematics course grades and the biology course grades are correlated with other biology course grades, then these within discipline correlations should be the highest and are designated as trait correlations. When course grades from biology are correlated with course grades from mathematics, the correlations will be lower than the trait grades and designated as non-trait correlations. These low non-trait course grades indicate discriminant validity. Note that method correlations and non-trait correlations are combined in this study.
The first criterion specified by Campbell and Fiske (1959) is that trait correlations should be high and statistically significant. When the trait correlations are high, convergent validity is supported. The second and third criteria are that method and non-trait-non-method courses should be significantly lower than trait correlations, alone. When method and non-trait-non-method correlations are significantly lower than trait correlation, discriminant validity is supported.
The two different data sets used in the following analyses are: one representing discipline courses, and the other representing the GE categories courses. In the first analysis, traits were identified by the discipline of the course. The disciplines identified are art, biology, English, history, mathematics, foreign language, psychology, and sociology. The courses within each discipline were randomly assigned to either Method A or Method B. Trait correlations were computed when same discipline courses of Method A were correlated with same discipline courses of Method B. Non-trait correlations were computed when the disciplines were different and methods could be the same or different. The number of students represented in each correlation of the analyses ranged from approximately 254 to 12,822 with an approximate mean equaling 2,335. Approximate numbers are given because of differences among the analyses as different correlations were calculated.
The second data set of traits includes GE courses that were randomly divided into two groups (Method A and Method B) of the same trait that correlated with each other. For example, presentation skills course grades were correlated (Method A) with other presentation skills courses (Method B) resulting in a trait correlation as well as a correlation with quantitative skills course grades resulting in a unique (non-trait) correlation.
As Marsh and Hocevar (1983) and Byrne (2010) described, there are a large number of different confirmatory factor analysis (CFA) procedures proposed to accomplish the MTMM process of Campbell and Fiske (1959). The method employed in the current study was operationally defined by Byrne (2010). As Campbell and Fiske suggested in their original proposal, when the methods are similar or identical, then the study becomes one of reliability and as the methods or conditions are dissimilar, the study becomes one of validity. In the present study, the two “methods” are obtained by random assignment to Method A or Method B and, consequently, one would argue that the traits would be similar and the study would be designated as a reliability study. Yet, our argument coincides with Trochim (2006) that the methods are not required and that the present study is a validity study. We leave it to the reader to decide whether the study is a reliability or validity study.
A more direct method of comparing traits is presented here. Embedded within the non-traits are at least three different methods: (a) essay types of exams, (b) multiple choice types of exams, and (c) term papers. Even though these “methods” are not identified in this study, they may account for correlations across the non-trait courses. The parameters of the relationship of the trait factor to the course grades could be compared with the corresponding parameters relating the non-trait factor (Method) to the same course grades. These parameters will be referred to as the trait-factor-CG (CG = course grade) parameters and the method-factor-CG parameters, respectively.
The Inequalities procedure of EQS (Bentler, 2006) allows for the direct comparison of trait-factor-CG parameters to method-factor-CG parameters (see above for a description of these parameters). That is, the relationship of traits to non-traits can be assessed by constraining the trait-factor-CG parameters to be larger than method-factor-CG parameters and determining the χ2 difference of the models. If the traits are larger than non-traits, then the difference in the χ2 should not be significant. It is argued here that if the overall model fits and the trait-factor-CG parameters are larger than the method-factor-CG parameters, then both convergent and discriminant validity are supported.
One may argue that the challenge presented with this method of comparison is that there is no change in the degrees of freedom and, consequently, none available to be used in the χ2 table, and the change cannot be assessed. Typically, when there is a constraint of a parameter, then there is a degree of freedom gained. The number of degrees of freedom can be computed in the following manner: if a non-trait parameter is .75, then the trait parameter constrained is greater than .75; for example, one-quarter of a degree of freedom is gained. As a result, each inequality is set so that the trait parameter is larger than its corresponding non-trait parameter (Method). Thereafter, the χ2 values can be assessed by comparing the new test model with the original full model. The degrees of freedom were determined by taking each inequality (described above) and subtracting it from 1 and adding the results. For those values that were negative, they were set to absolute values. The total is then the degrees of freedom to be used in the χ2 table.
Results
The results are presented by data set; first, the outcomes of the analyses with data from the disciplines identified as Art (ART), Biology (BIO), English (ENG), History (HIS), Language (LANG), Mathematics (MAT), Political Sciences (POL), Sciences (SCI), and Sociology (SOC) are presented as analyzed by both the traditional MTMM method (Campbell & Fiske, 1959; Widaman, 1985) and the proposed direct comparison method. Then, the results from the analyses with the second data set, which consisted of the GE categories of Quantitative Skills (Quant), Natural Sciences (NatSci), Western Civilization (WesCiv), Contrasting Cultures (ConCul), Humanities (HumanT), Arts (Art), Foreign Languages (Lang), Presentation Skills (Pres), and Prejudice and Discrimination (PreDis) are presented as analyzed by both of the aforementioned methods.
The first of two (MTMM) analyses was performed on course discipline grade outcomes using the nested CFA described by Byrne (2010). The characteristics of the samples used below were described in the section “Method” above. Table 1 shows the correlation matrix with approximately 33,352 cases used in this analysis. The number of cases is approximate because the number of cases for each correlation varied.
Multitrait-Multimethod Matrix of Two Non-Traits and Nine Discipline Traits.

Note. The bolded numbers represent the validity diagonal. Art = Art courses; Bio = Biology courses; Eng = English courses; His = History courses; Lang = Languages courses; Mat = Mathematics courses; Pol = Political Sciences courses; Psy = Psychology courses; Soc = Sociology courses.
The model was first run including political science and was found to not meet the criteria. An inspection showed that the courses in political science would be given credit in other disciplines such as history, sociology, and economics. Because the courses would appear in other disciplines, the correlations across disciplines would be increased. In addition, students may take courses in other disciplines such as history, sociology, and economics that can be counted toward the political major.
In MTMM, the validity diagonal is represented by bolded italicized numbers shown in Table 1. The correlations in the validity diagonal should be higher than any correlations in the off-validity diagonal in the same column and row (Byrne, 2010). These numbers address both convergent and discriminant validity; the larger numbers (validity diagonal) show convergent validity, and the off-diagonal smaller numbers show discriminant validity.
Figure 1 shows the graphic CFA model analysis. Four models comprise this analysis, however, to conserve space, only “Model 1” as described by Byrne will be graphically presented here. All models are described below.

Full model for disciplines.
In Figure 1, the two non-trait (methods) factors on the left represent grades in discipline courses designated Method A and Method B. The factors on the right represent trait factors in the eight disciplines. The procedure described by Byrne (2010) involves four different analyses. The MTMM procedure described by Byrne (2010) is accomplished by assessing the χ2 comparison of four computer models. The first model (the full model) represented in Figure 1 contains all relationships and the comparison to each of the other three nested models supports either convergent or discriminant validity. In Model 2 (not shown to save space), the trait factors are removed and consequently any loss (difference from Model 1—the full model) is attributed to convergent validity. If the χ2 difference between Model 1 and Model 2 is significant, then the convergent validity is supported.
At the same time, when the relationships among different trait factors are low, then discriminant validity is supported. In Model 3, the relationships among the different trait factors are set to 1 (indicating high relationships among traits) and if the resulting χ2 differences from Model 1 are high (they should be low), then discriminant validity is supported. A significant χ2 difference between Model 1 and Model 3 supports discriminant validity.
Finally, when the method factors are not related, discriminant validity is indicated. In Model 4, if the relationship among the method factors are set to 0 and a χ2 comparison to Model 1 is not significant, then discriminant validity is supported. The results from these four analyses are in Table 2.
The χ2, Degrees of Freedom, and CFI for Each of the Four Discipline Models.

Note. CFI = comparative fit index; RMSEA = root mean square error of approximation.
Convergent and discriminant validity are assessed by two different non-traits: one non-trait uses the χ2, the other the comparative fit indexes. Both non-traits included differences among these indexes in the four models. Table 3 shows the differences among the models and which kind of validity is assessed by the difference.
Comparison of Goodness-of-Fit of the Four Discipline Models.

Note. Model 1 vs. 2 = convergence; Model 1 vs. 3 = discriminant validity. CFI = comparative fit index.
Indicates significance at the .05 level of probability. **Indicates significance at the .01 level of probability.
The significant difference between Model 1 and Model 2 as evidenced by the significant χ2 (2427.276 with 54 df and p < .01) and the comparative fit index (CFI) change greater than .01 is indicative of convergent validity. The significant difference between Model 1 and Model 3 as evidenced by the significant χ2 (2131.221with 36 df and p < .01) and the CFI change index greater than .01 is indicative of discriminant validity. Also indicative of discriminant validity is the lack of significant difference between Model 1 and Model 4 (χ2 = 14.385 with 1 df results in a p < .01). However, this analysis shows there was significance in the comparison between Models 1 and 4, thus not supporting discriminant validity. This result does not support the application of Widaman’s (1985) method for this particular type of analysis.
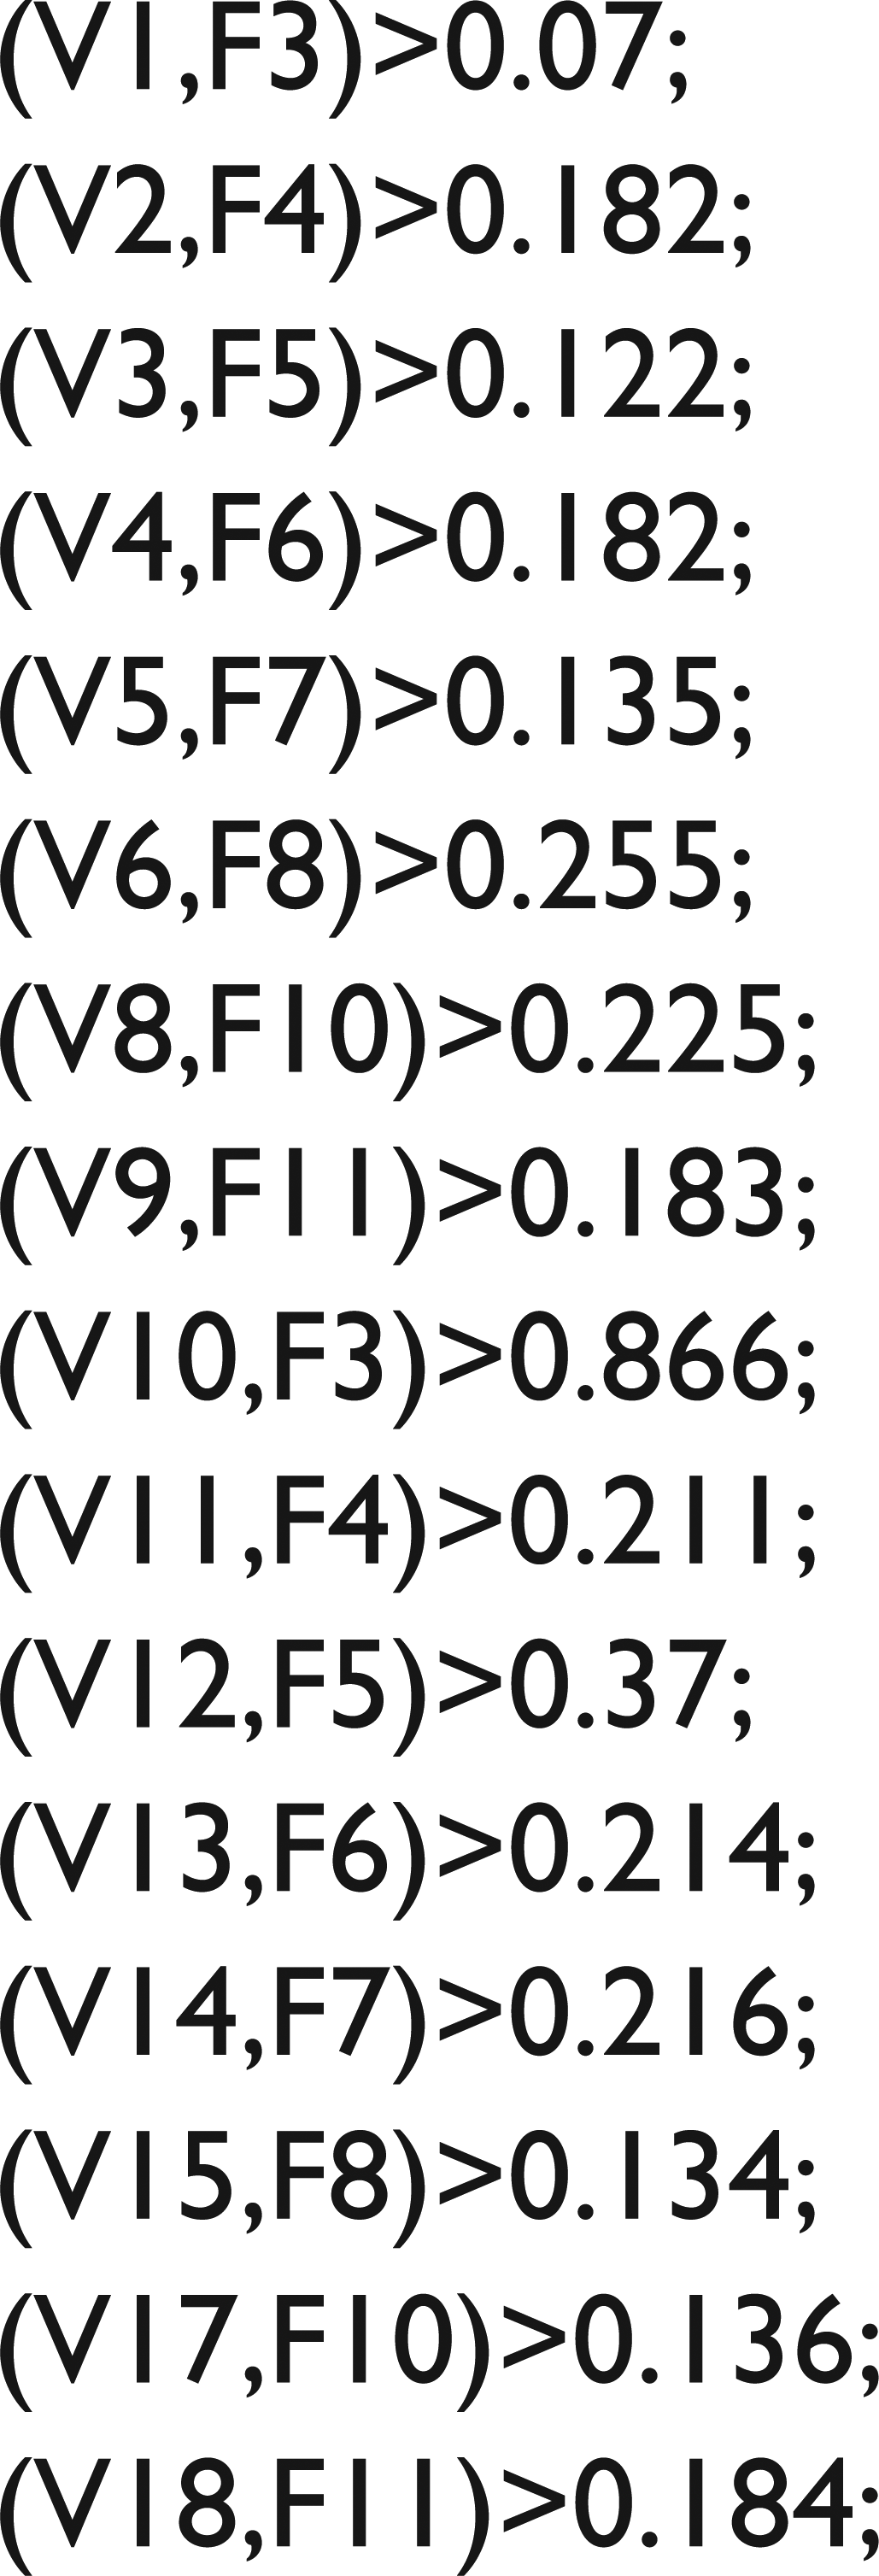
Additional analyses were conducted using a direct comparison of traits to non-traits. This approach is proposed here as an alternative method for statistical investigation. This model is run by constraining the trait-factor-CG parameters to be larger than method-factor-CG parameters (see description above). The process of setting constraints ensures that the traits are larger values than non-traits (and methods). In addition, the process serves as a procedure for identifying the degrees of freedom in this proposed method. The sample shown below is the formula for setting the constraints used within this analysis (see Figure 2) using Bentler’s (2006) formula notation. The values come from the parameter of the non-trait factors and the course grades (method-factor-CG parameter). For example, method-factor-CG parameter for Method A, ARTa, was 0.22 as shown in the figure (see Figure 2). The matched values of trait and non-trait (method) for the same variable (e.g., Math) are set so that the trait value is constrained to be higher. The resulting outcome value (remainder) is then subtracted from a value of one (1.00) for each paired outcome; thereafter, each is summed to achieve a final single value, which serves to represent the resulting degrees of freedom. This first sample is the model for the disciplines.
For disciplines, the inequalities were set to be the following algorithm indicated above.
Table 4 presents the comparison between the full model and the model where the trait-factor-CG parameters are constrained to be larger than method-factor-CG parameters and determining the χ2 difference of the models. The lack of a significant χ2 difference between full model and constrained model (CM; χ2 = 19.95 with 12 df results in a p > .01) indicates support for convergent and discriminant validity.
The χ2, Degrees of Freedom, and CFI for the Direct Comparison Method and the Full Models.

Note. CFI = comparative fit index; RMSEA = root mean square error of approximation; FM = full model; CM = constrained model.
Indicates significance at the p < .01.
Figure 3 shows the graphic CFA model analysis for the GE categories. Four models comprise this analysis, however, to conserve space, only Model 1 as described by Byrne will be graphically presented here. In this analysis, the traits are GE categories. There were nine pairs of GE categories: GE1—quantitative skills (Quant), GE2—natural sciences (NatSci), GE3—social science (SocSci), GE4—United States history and society (USHist), GE5—western civilization (WesCiv), GE6—contrasting cultures (ConCul), GE7—humanities (HumanT), GE8—Art (Art), GE9—foreign language (Lang), GE10b—basic communication, and presentation skills (Pres), and GE11—prejudice/discrimination (PreDis). GE courses are designated by an institution, in this case by the eastern U.S. university from which the data were obtained. As mentioned earlier in this “Method” section, courses within each GE category were assigned to one of two groups. Courses were randomly assigned into each of the two groups (Method A and Method B) to run statistical analyses. Table 5 contains the correlations for this analysis. All models are described below.
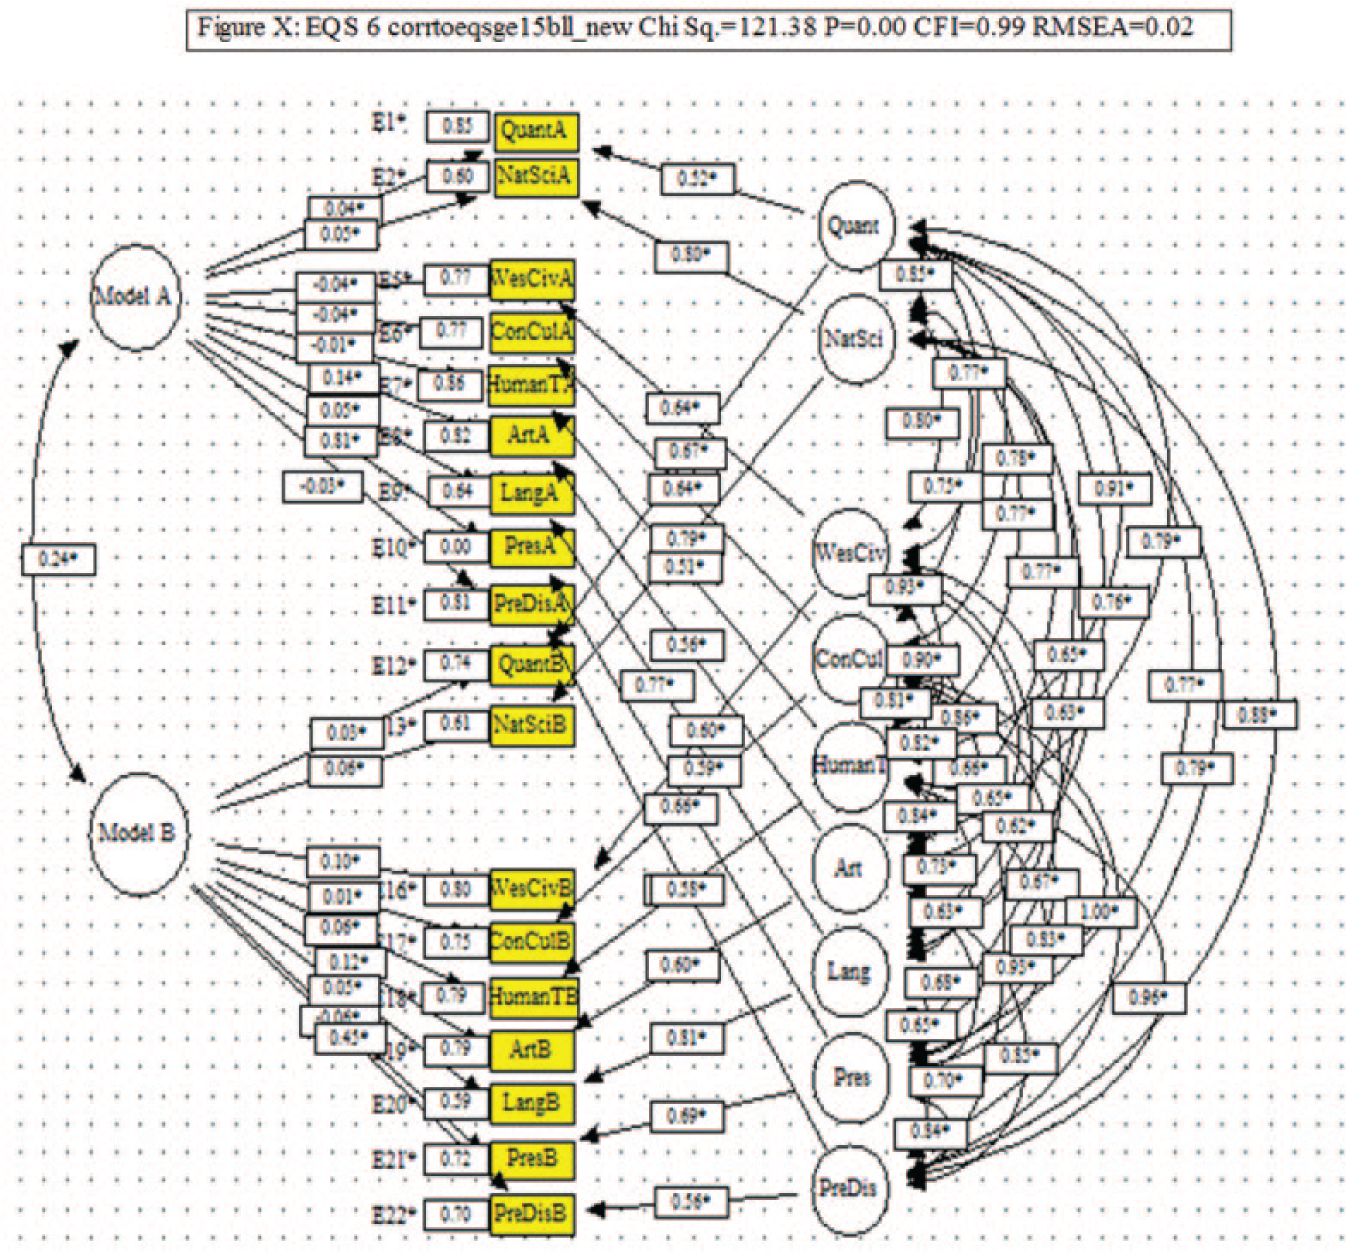
Full model for GE.
Multitrait-Multimethod Matrix of Two Non-Traits and Nine Traits.

Note. The bolded numbers represent the validity diagonal. Quant = Quantitative Skills; NatSci = Natural Sciences; SocSci = Social Science; USHist = U.S. History and Society; WesCiv = Western Civilization; ConCul = Contrasting Cultures; HumanT = Humanities; Art = Arts; Lang = Foreign Languages; Pres = Presentation Skills; PreDis = Prejudice and Discrimination.
Convergent and discriminant validity is assessed by two different methods: One method uses the χ2 and the other the CFI (see Table 6). Both included differences among these indexes in the four models. Table 7 shows the differences among the models and which kind of validity is assessed by the difference. At the same time, notice that the GE category, Art, met the MTMM requirement when presentation skills were not included in the analysis. Overall, this analysis shows there was significance in the comparison between Models 1 and 4, thus not supporting discriminant validity. This result does not support the application of Widaman’s (1985) method for this particular type of analysis.
The χ2, Degrees of Freedom, and CFI for Each of the Four GE Category Models Using the Widaman Method of Analysis Without GE3 and GE4 in the Analysis.

Note. CFI = comparative fit index; GE = general education; RMSEA = root mean square error of approximation.
Comparison of Goodness-of-Fit of the Four GE Models Without GE3 and GE4 in the Analysis.

Note. Model 1 vs. 2 = convergence; Model 1 vs. 3 = discriminant validity. GE = general education.
Indicates significance at the .01 level of probability.
Applying the proposed direct comparison method, Figure 4 illustrates the computation of degrees of freedom for the GE categories used within this analysis.

General education (GE) category analyses formula.
In this case, the degrees of freedom were calculated in the same manner as the discipline analyses conducted above and result in a value of 15. Table 8 indicates the degrees of freedom, the χ2 value, in addition to the comparative fit index and the root mean square error of approximation (RMSEA).
Comparison of Goodness-of-Fit for the Direct Comparison and Full Model for GE Categories.

Note. The χ2, degrees of freedom, and comparative fit index for the direct comparison model without GE3 and GE4 in the analysis. GE = general education; CFI = comparative fit index; RMSEA = root mean square error of approximation; FM = Full Model; CM = Constrained Model.
Indicates significance at p > .01.
Results of the analysis indicate there was no statistical significance in the comparison between the full model and the constrained model, thus supporting convergent and discriminant validity. This finding supports the application of the direct comparison method for this analysis. Outcomes suggest the direct comparison method is an appropriate alternative method for substantiating the use of course grades throughout undergraduate educational institutions.
Westen and Rosenthal (2003) suggest that fit indices of the structural equation modeling type are global, and not readily comparable across studies, while an effect size “. . . in the form of a simple r [is] even more useful . . . [in] that the index and the variables that comprise it are in precisely the same form” (p. 610). The outcomes are also presented as effect sizes to compare the results of this study to other research dealing with validity and reliability. In addition, American Psychological Association (APA) standards recommend publishing effect sizes (American Educational Research Association, 2013). Effect sizes in the form of multiple R and eta computed from variance accounted for within the structural equation model of this analysis are presented in Table 9 for the reader.
Effect Sizes for Discipline and GE Categories.

Note. GE = general education; ES = effect size.
Within the disciplines, multiple factors contribute to the Method effect size such as objectives, books, syllabi, and program culture within the medium range, and account for the variance observed. Meanwhile, the trait effective size of .78 is a large effect size. Within the GE categories, the Method is significant, the effect size is reflecting a medium R and falls within the small to moderate range. This infers, despite criticisms surrounding the multiple methods, the variables are measured in the Method.
Discussion
Although we present the Widaman type MTMM analysis here, we believe that because we have not included certain grading methods (essay exams, multiple choice exams, and term papers) that his fourth criteria of discriminant validity is not upheld. Rather, the variance that would have been taken up by such methods was included in the non-trait factor correlations. Results indicate statistical significance in convergent validity and not in discriminant validity; this infers that although methods of grading may vary, grades are effective student learning outcome evaluation measures.
The novel approach to MTMM, the direct comparison method, proposed within this article has been applied to evaluate the reliability and validity of course grades at the undergraduate level. The direct comparison method is applicable when the methods cannot be included in the analysis. It can also be applied in structural equation modeling when a researcher wishes to investigate methods to traits and is presented with the challenge of obtaining degrees of freedom.
The two MTMM studies presented here indicate support for convergent and discriminant validity for course grades. The findings are significant in that they address the perceived limitations of course grades based upon concerns of the validity and reliability of grades, as discussed in the introduction of this article. If we continue to establish these levels of validity and reliability in class grading, we can assume a greater level of confidence in the use of course grades for discipline and program (e.g., GE or discipline) assessment. The implication is that course grades could be considered as useful and meaningful assessment methods external to the class and instructor. This study also presents a model that may be adapted by individual colleges or systems to assess academic programs with structures specific to their campus and programs.
Contrary to ongoing criticism that course grades are not reliable and valid means of evaluating student learning outcomes, this analysis shows course grades are effective. These findings support the continued use of letter grades (A, B, C, D, etc.) as effective means to evaluate student learning outcomes in undergraduate education.
The results of this study show that trait relationships are greater than cross-trait or method relationships. For example, the math course grades correlated highly with other math course grades (same trait), and sociology course grades correlated highly with other sociology course grades (same trait), and math course grades did not correlate as highly with sociology course grades (different traits possibly same method), indicating that the constructs are shown to be distinct as measured by course grades. The same is true of the discipline and GE courses of this study as shown by the MTMM analysis.
Even though math course grades are measuring the construct of math, and psychology course grades are measuring the construct of psychology, and so on, the question still remains: What is it that is being measured? It turns out that there is an abundance of information about what is being measured by each course and consequently, each department, and finally a student’s complete college program. Furthermore, we know that the construct is being measured by results from the present study; we just need to identify what that is. Information describing the traits (i.e., math, art, sociology, natural history, etc.) can be found in (a) new course applications to the curriculum committee, (b) course descriptions in the course catalog, (c) syllabus of the course, (d) content of the textbook(s) and reading lists, (e) tests administered, (f) minutes of faculty meetings, and (g) vita and publications of faculty members.
The following statements are sample course outcomes taken from some of the aforementioned categories within one of the three different disciplines. In biology, it was found that students were expected to learn, understand, and/or study plant and/or animal anatomy and physiology and, more specifically, were expected to describe basic human-mammalian body structure. In history, we found that the student was expected to learn; understand; and/or study: economic, social, political, and cultural systems, civilizations and their development, institutions and time lines, and types of governments. In psychology, we found that the student was expected to learn; understand; and/or study: theories of personality, animal and human interaction, how organisms learn, what motivates animals and humans, and how people develop relationships. These examples are not meant to be complete but only a glimpse of the discipline. We believe that even with these limited examples, it shows the scope and the differences among them. The short descriptions are presented only to show that there is a definition and coherence within each discipline. The same holds true for the GE categories. These describe learning outcomes that are specific and comprehensive.
Furthermore, at the department level, members (students, faculty, administrators) know what is being taught and that is supported by the data presented. In addition to the aforementioned description, the quantitative results of this study confirm course grades are assessing sociology or math, science, history, and other disciplines. Moreover, the courses in sociology teach and measure some part of sociology; they combine to measure the learning outcomes within the discipline of sociology. From the description above, it becomes evident the information and learning outcomes in sociology are validly measured by separate course grades that combine to measure the entire discipline of sociology. To extend this concept further, a possible analogy is the IQ test. When one examines what an IQ test measures, it includes subtests such as: Block Design, Similarities, and Information. Although the subtests all measure distinct constructs instrumental to the demonstration of intelligence, when combined with other subtests with the result is the Full Scale Intelligence Quotient (FSIQ). Thus, they all measure some aspect essential to IQ and are all related.
We believe the present results show grades do present learning outcomes, which are known to teachers who assign the course grades. Students learn (or demonstrate a lack of learning) and receive course grades, and institutions/companies seek their talents. Although some may wonder whether teachers assign grades based on aspects of subjectivity, quantitative analysis, and in part based on intuition, after years of training in the area of teaching, the data show that grades in math classes correlate more highly with other math grades than they do with classes in any other discipline. These outcomes can be seen in the correlation matrix and are verified in the analysis of the MTMM.
In addition, future analyses could expand on the concept of equating; a procedure that may be applied to more specifically investigate variances on sample populations for different measures used (Han, 2009). Equating may include a variety of sources, such as students, courses, faculty, resources, tests, books, or other methods used in evaluating course information. This is a step that would be useful in program evaluation as it incorporates the process of continuing to improve the teaching process. It may be relevant to investigate and promote information sharing direct to teachers to provide constructive feedback regarding where they are in terms of infusing knowledge as an outcome for course learning. This is important in the development of standardized methods of evaluation and outcome assessment.
Although this study examined a wide breadth of courses offered at a major university in the United States, it is important to note some limitations. The courses outlined in this article are only some of those offered at many colleges and universities and while major courses in GE categories were included in this analysis, others were not. Those with incomplete information, or missing information, could not be included in this analysis. Furthermore, although the method and investigation outlined in this study suggest that grading is an accurate and helpful process, critics may disagree. Some may argue that faculty have an intuitive sense of grading and performance, which, although not within the scope of this study, may be a factor involved that is yet to be considered. In addition, courses were not specified based on faculty or instructor, and this may also limit the scope of information presented; if more experienced faculty were reflected in this study, it may imply grading experience plays a role in outcome evaluation. This would be beneficial for future research investigation.
Although there is limited literature using MTMM in this area, this study seeks to offer additional evidence in support of the sparse available research published. This study offers an alternative method of MTMM application in the hope that more users will apply MTMM to investigate issues such as course grades in the future. The value of MTMM and the scope of this research go beyond examining courses in arts and sciences; future studies may wish to expand the body of research by applying MTMM, and the Direct Method as presented here, to other academic areas. Finally, it is recommended the reader consider the use of the MTMM Direct Method of analysis as proposed within this article; future use may confirm the utility of this method, and criticisms may offer integral suggestions for its future development. It is possible the use of this statistical method of investigation has broader applications than the examination of course grades and learning outcomes and can be applied in various settings and contexts.
Footnotes
Declaration of Conflicting Interests
The author(s) declared no potential conflicts of interest with respect to the research, authorship, and/or publication of this article.
Funding
The author(s) received no financial support for the research and/or authorship of this article.