
Abstract
We present a confirmatory factor analysis (CFA) procedure for computing the reliability of circumplex axes. The tau-equivalent CFA variance decomposition model estimates five variance components: general factor, axes, scale-specificity, block-specificity, and item-specificity. Only the axes variance component is used for reliability estimation. We apply the model to six circumplex types and 13 instruments assessing interpersonal and motivational constructs—Interpersonal Adjective List (IAL), Interpersonal Adjective Scales (revised; IAS-R), Inventory of Interpersonal Problems (IIP), Impact Messages Inventory (IMI), Circumplex Scales of Interpersonal Values (CSIV), Support Action Scale Circumplex (SAS-C), Interaction Problems With Animals (IPI-A), Team Role Circle (TRC), Competing Values Leadership Instrument (CV-LI), Love Styles, Organizational Culture Assessment Instrument (OCAI), Customer Orientation Circle (COC), and System for Multi-Level Observation of Groups (behavioral adjectives; SYMLOG)—in 17 German-speaking samples (29 subsamples, grouped by self-report, other report, and metaperception assessments). The general factor accounted for a proportion ranging from 1% to 48% of the item variance, the axes component for 2% to 30%; and scale specificity for 1% to 28%, respectively. Reliability estimates varied considerably from .13 to .92. An application of the Nunnally and Bernstein formula proposed by Markey, Markey, and Tinsley overestimated axes reliabilities in cases of large-scale specificities but otherwise works effectively. Contemporary circumplex evaluations such as Tracey’s RANDALL are sensitive to the ratio of the axes and scale-specificity components. In contrast, the proposed model isolates both components.
Keywords
Introduction
In the field of personality psychology, the interpersonal circumplex (IPC) has long been recognized as a model for organizing interpersonal behaviors or traits along the axes of status (dominance) and love (affiliation; Wiggins, 1979, 2003). Circumplex models that date back to Wundt and James have also dominated the dimensional assessment of emotions (Carney & Colvin, 2010; Russell, 1980). Furthermore, the structure of personal values (Schwartz, 1992), goals and aspirations (Grouzet et al., 2005), vocational interests (e.g., Holland & Gottfredson, 1992), group behavior, and values (Bales & Cohen, 1979) as well as organizational values and leadership roles (Quinn, 1988) make use of circumplex models.
Although the circumplex is widely accepted as a structural model and has generated various specialized statistical parameters and applications (e.g., Acton & Revelle, 2004; Gurtman & Pincus, 2006), so far a very basic psychometric parameter is missing: the reliability of circumplex axes.
One reason for this research gap might be that empirical papers in the circumplex tradition take two distinctly different approaches. Authors adhering to the first approach evaluate the circumplex structure of the items or scales of a new instrument. Nagy, Marsh, Lüdtke, and Trautwein (2009) called this line of research the variable oriented aspect. In the remainder of this manuscript, we will speak more precisely of the construct-validity approach. Authors adhering to the second approach characterize participants or groups by computing their circumplex profiles resulting in a single location in the (mostly) two-dimensional space. According to Gurtman and Pincus (2006), this commonly used visualization is called “dimensional coordinate summary” (p. 416; person-oriented aspect; Nagy et al., 2009). In the remainder of this manuscript, we will use the brief term application approach.
Information about an instrument’s reliabilities and standard errors of measurement is usually considered a necessary precondition for its application. Relatedly, comparisons of locations in a two-dimensional space require knowledge of the two dimensions’ or axes’ reliabilities. Papers using a circumplex instrument for assessment purposes, however, fail to report axes’ reliabilities because studies following the construct-validity approach do not provide this basic estimator. The main purpose of this study is to close this gap.
The relations between the construct-validity approach and the application approach for the circumplex domain have been explicated by Nagy et al. (2009). Conforming to the integrative perspective chosen in this publication, we extend the fit of the circumplex structure using the conventional structural equation modeling software for the estimation of the axes’ reliability. Consequently, axis reliability estimates can be advantageously used in applications locating participants or groups in the circumplex space.
In this article, we review the functions of a measure for axis reliability in the circumplex metric and explain why it has been neglected in the literature so far. However, there has been a previous proposal for computing axis reliability by applying a formula by Nunnally and Bernstein (1994). But, as we will show, this formula has some specific limitations. We will propose an alternative approach to estimate the reliability of circumplex axes using a restricted confirmatory factor analysis (CFA) variance model. We will demonstrate this method’s superiority by applying it to a variety of instruments and samples. We will present estimates of the reliability and the standard errors of measurement for the axes analyzed and will compare these with results obtained by applying the Nunnally–Bernstein formula to the same data.
The Circumplex Model
Acton and Revelle (2002) gave widely accepted definitions of the characteristics of a circumplex. At the most basic level, we define a circumplex geometrically as a two-dimensional content model of a psychological construct with so-called complex structure items. Usually, Thurstone’s (1954) simple structure items are selected by varimax rotation in exploratory factor analysis (left side of Figure 1). Because each simple structure item measures a single dimension, the difference of factor loadings of each item on both dimensions is maximized. In contrast, the canonical IPC (the structure a in the center of Figure 1) additionally has items displaced in the circle by 45° degrees (interstitial variables), adding equally to both axes of the circle.

Types of circumplexes.
The structure d in Figure 1 consists exclusively of complex structure items. The term complex structure has recently been revitalized by Ertel (2009, 2011). He developed the varimin rotation of factors, which forces each item to express an equal amount of each dimension. Therefore, structure d in Figure 1 along with hexagon structures should be subsumed under the circumplex concept. Figure 1 depicts other types of circumplexes and extensions to three-dimensional content models, that is, spheres (e.g., Bales & Cohen, 1979; Markey & Markey, 2006). In this article, six of these structures will be empirically tested (structures a-f of Figure 1).
The Item Weights on the Axes
For researchers working in the construct-validity approach, the circumplex requirement of no preferred rotation follows from the equal spacing and constant radius requirements (Acton & Revelle, 2002, 2004). But in the applied approach, two theoretically selected axes are conventionally used to describe an individual’s or group mean’s location, for example, the axes communion and agency in the case of the IPC, or the axes of internal/external focus and organizational flexibility/control dominance in the case of the Competing Values Model. The variables, items or scales, thus add to the axes by weights, varying between plus and minus one. The weights are a function of the angular displacement between the scale and the axis. For the canonical IPC (structure a in Figure 1), the interstitial scales at the 45° position assess the combination of agency and communion with respective equal strength and add .707 to the communion axis as well as .707 to the agency axis. Each weight derives from the cosine of the scale’s angular position in the circle. Accordingly, the variables of the structure b in Figure 1, with their equal spacing of 22.5° and 67.5° regarding the axes, were assigned weights of ±.38268 and ±.92388.
Some authors directly used the following formula, some authors reduced the resulting sum with a .30 multiplier, some utilized z-transformed or ipsatized scale scores, and some combined some of the previous options.

The complicating characteristic that weights in the axes’ linear combination differ from 1.0 may have contributed to the fact that the circumplex literature provides almost no reliabilities of an instrument’s axes.
No Reliability Estimators or a Sometimes Insensitive Trial
However, the reliability of the assessments on a dimension would be needed for the inclusion in meta-analyses or for computing standard errors of measurement: standard error of measurement (SEm) = SD × √(1 − Rel). The SEm is used to calculate the confidence interval for the location of a single observation, or for the standard error of change. Accordingly, in the literature on simple structure dimensions, reliabilities are principally reported, and the Cronbach’s alpha coefficient is commonly used. In papers applying a circumplex instrument, reliabilities are regularly reported for the scales (the dots in Figure 1) but not for the circumplex axes. We have checked 15 papers using seven instruments—Interpersonal Adjective Scales (IAS; Adams & Tracey, 2004; Ostendorf & Angleitner, 1998), Interpersonal Adjective List (IAL; Jacobs & Scholl, 2005), Inventory of Interpersonal Problems (IIP; Alden, Wiggins, & Pincus, 1990; Brähler, Horowitz, Kordy, Schumacher, & Strauß, 1999; Horowitz, Strauss, & Kordy, 2000; Slaney, Pincus, Uliaszek, & Wang, 2006), Interpersonal Goals Inventory (IGI; Dryer & Horowitz, 1997), Circumplex Scales of Interpersonal Values (CSIV; Locke, 2000), Organizational Culture Assessment Instrument (OCAI; Cameron & Quinn, 1999/2006; Kalliath, Bluedorn, & Gillespie, 1999; Kluge, 2004; Quinn & Spreitzer, 1991; Strack, 2004); and Customer Orientation Circle (COC; Strack, Boultgen, Kenkmann, & Held, 2004). With the exception of 1 paper, none of them reported an axes’ reliability estimation. Only Markey, Markey, and Tinsley (2005) computed the axes’ reliability of behavioral observations by applying a formula adapted from Nunnally and Bernstein (1994). This procedure was thereafter adapted by Jacobs (2009) and Thomas, Locke, and Strauß (2012), and further applied by Markey and Markey (2006, 2009). The Nunnally–Bernstein formula (Nunnally & Bernstein, 1994, p. 271, Equations 7-17) estimates the reliability of any linear combination score. Adapted for a circumplex axis, the axis reliability was derived from the sum of the squared weights (wi ) of all scales on that axis (e.g., for the circumplex types a and b of Figure 1, Σwi 2 results in 4.00), the scales reliability (Rel_scale i ), and the axis variance (Var_axis).
Nunnally and Bernstein (1994) formula is as follows:
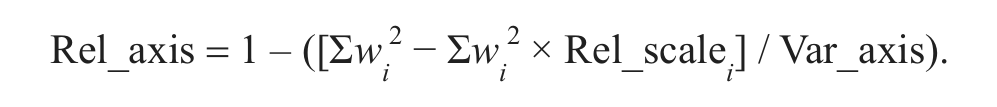
(p. 271)
Note that the axis here had to be computed with z-standardized scales.
Although the Nunnally–Bernstein formula appears appropriate at first glance, we question its completeness and sensitivity for violations of underlying assumptions for the estimation of the circumplex axis reliability. With this formula, low reliabilities might emerge on two levels. On the first level, a low internal consistency of scales would strongly reduce the reliability of the combination score. Unfortunately, in the circumplex domain, the internal consistency of the scales of raw data is immunized by a general factor in the data (i.e., alphas cannot be low if the general factor is high). The general factor and other latent restraining sources operate on the second level by reducing the variance in the axis distribution included in the denominator of the Nunnally–Bernstein formula. We hypothesize that the adaptation of the Nunnally–Bernstein formula is not sensitive to a specific violation of the circumplex requirement, that is, if the scales do not perfectly project onto the circumplex plane. Thus, the application of this formula may in specific cases lead to positively biased reliability estimates of circumplex axes.
The empirical loadings of items or scales on dimensions are necessarily smaller than the perfect loadings, and the empirical angular positions of items or scales always depart a little from the intended positions in the ideal structure. Consequently, there are various sources of measurement error in a circumplex instrument that, taken together, contribute to an (imperfect) estimation of the reliability of the axes: If the scales do not perfectly project onto the axes, they sustain some separate, unintended source of variance to be called the scale-specificity source in the remainder of this article.
The Model
The Variance Components of a Circumplex Item
Our proposed solution for the reliability problem is to decompose the variance of each item used in a circumplex instrument to all the sources of the instrument’s structure: Figure 2 depicts a common 64-item instrument with eight scales arranged in the circumplex type a of Figure 1. The hierarchical CFA resembles a Multitrait–Multimethod model with the circumplex structure and scales as the restricted trait part as well as with blocks and the general factor component as the method part. In tau-equivalent models, the errors stay free (e.g., Graham, 2006).
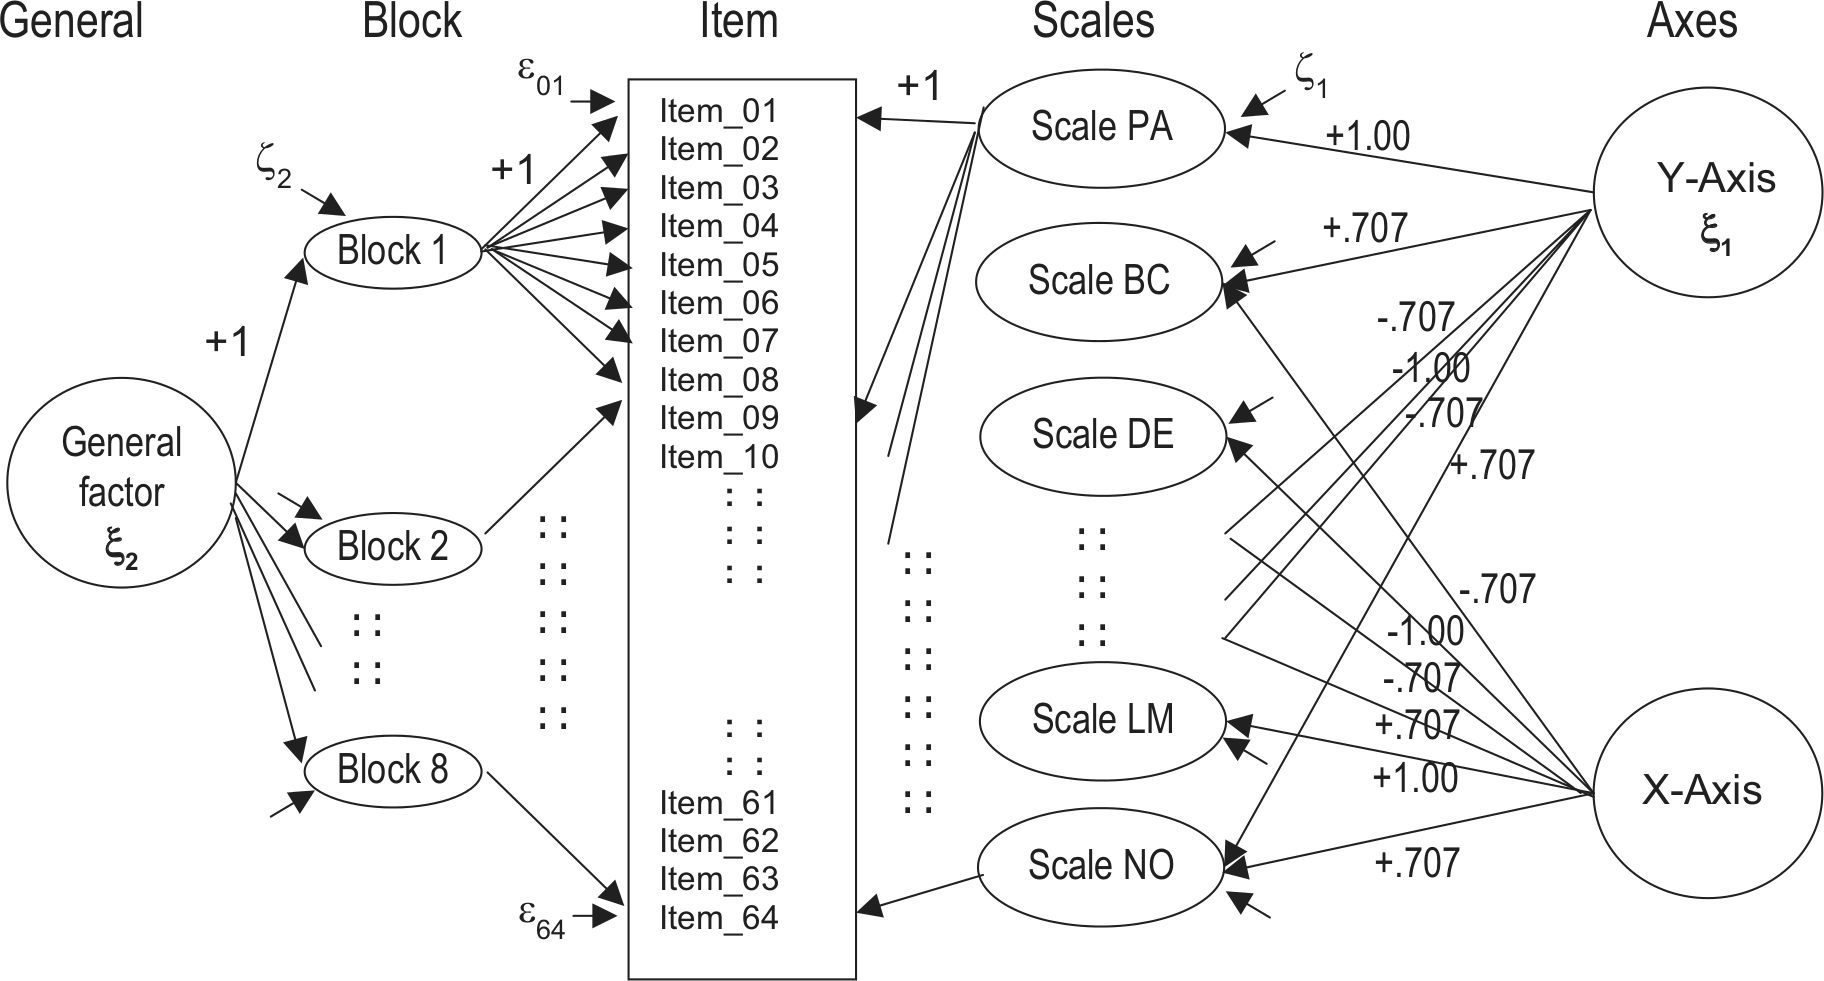
Sketch of the variance decomposition CFA model of circumplex type a instruments including a blockwise item presentation.
Reading the model from the right side, the two axes are forced to be orthogonal. Furthermore, the determination of the scales by the axes is shown by the restricted weights (w = ±.707, 0, and ±1.0 for circumplex type a; for other types from Figure 1, see “Introduction” section). The restriction of the weights corresponds to the fixed loadings of the scales on the axes. As the loadings are fixed by the weights, the variance of the latent variables of the axes is set free (this is a fixed-links model according to Schweizer, 2010). The variance of the latent variables for each axis is estimated in the coefficient ξ
Moreover, a minority of circumplex instruments uses a blockwise presentation of items (e.g., the German version of the CSIV, the Team Role Circle [TRC], and the OCAI, see Table 1). In the example of Figure 2, eight items are presented in each block, one for each scale. In those cases, an additional variance component called block-specificity appears and is denoted by ζ2.
Instruments Examined.
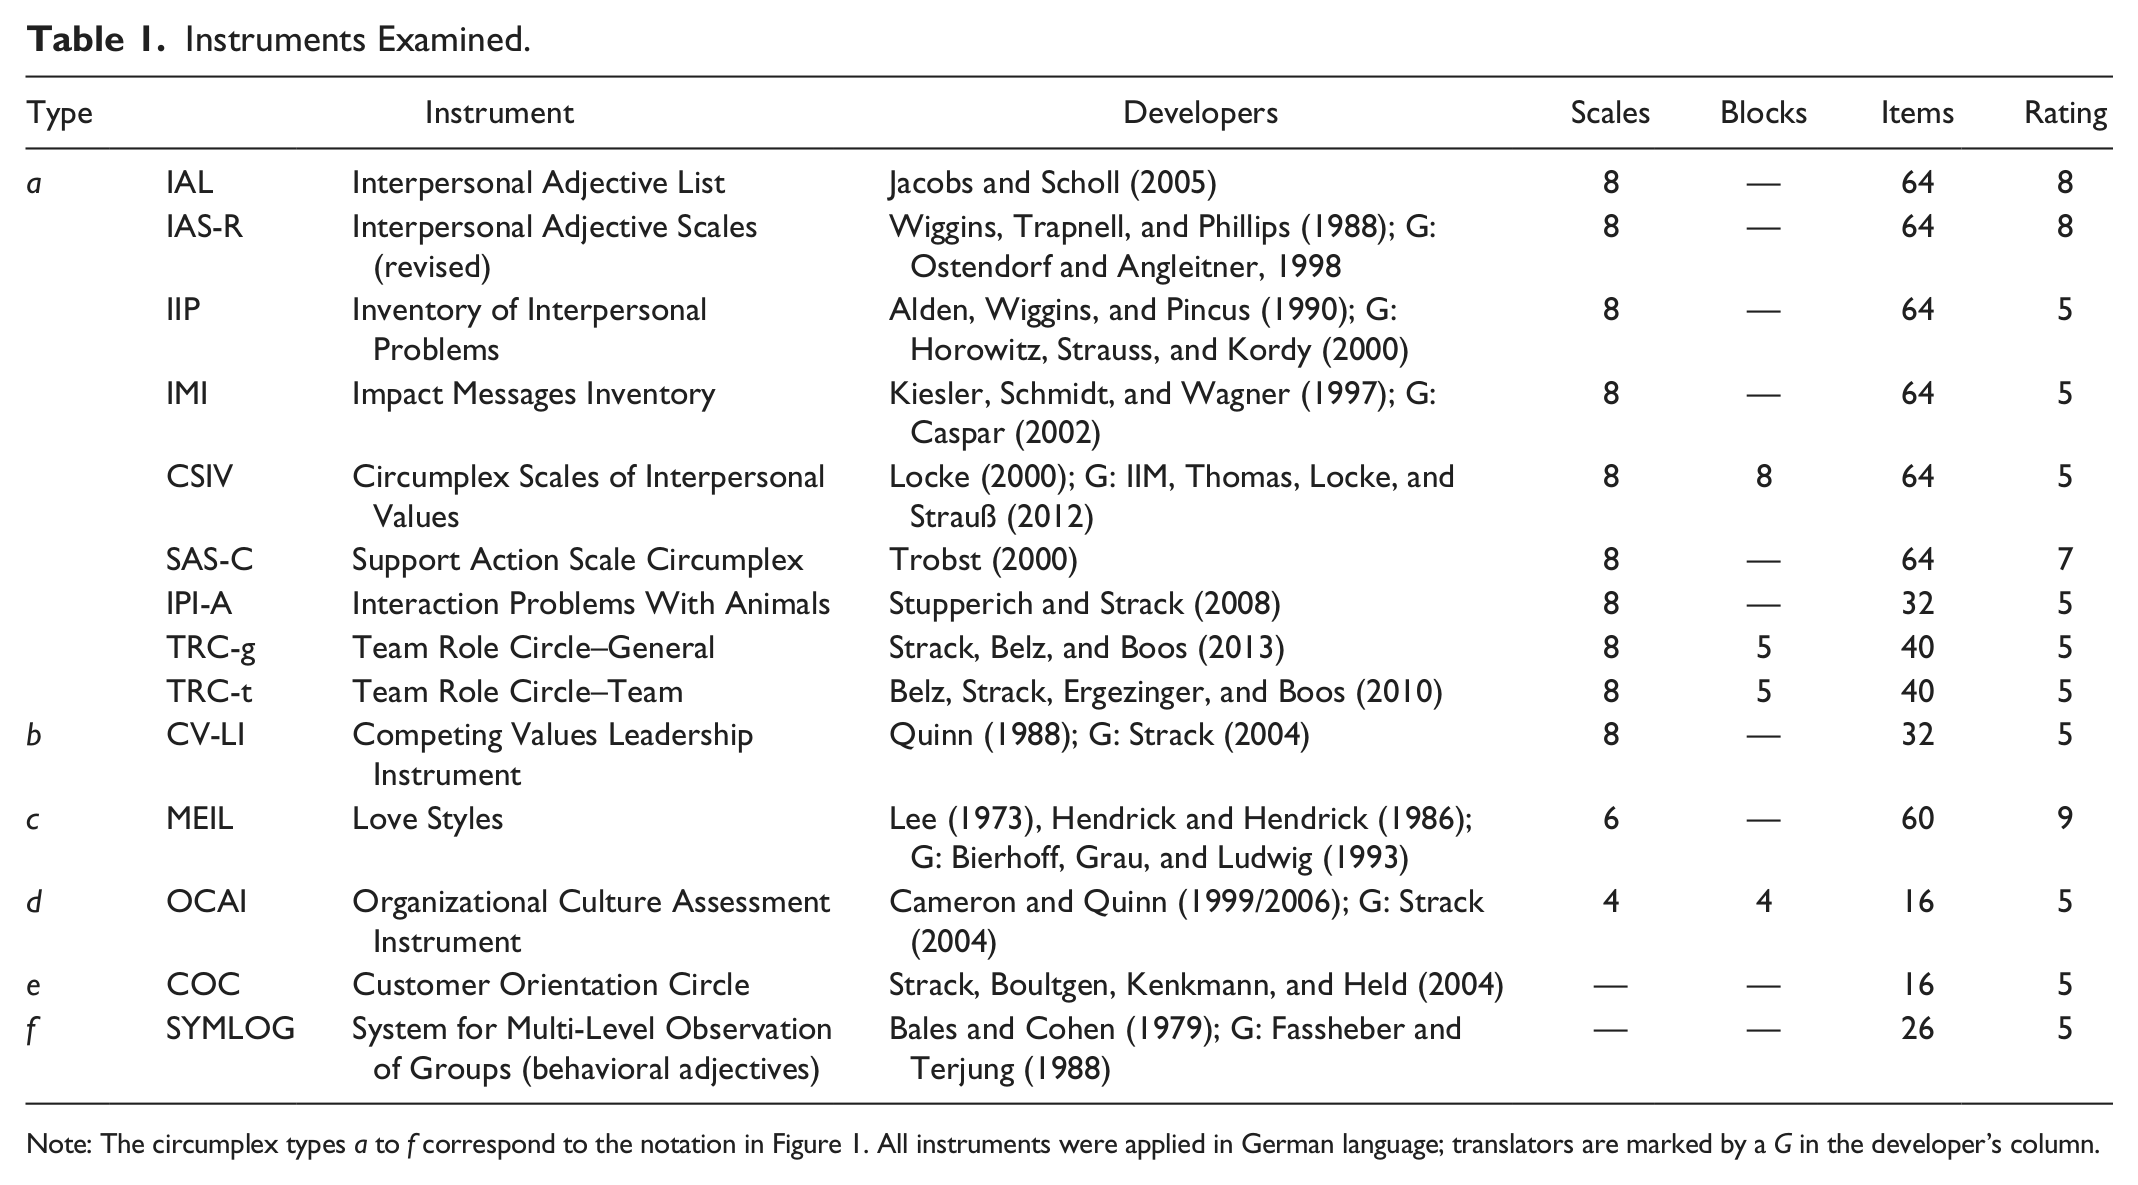
Note: The circumplex types a to f correspond to the notation in Figure 1. All instruments were applied in German language; translators are marked by a G in the developer’s column.
The resulting restricted confirmatory model (Figure 2; a LISREL syntax is given in the supplement material; available at www.sgo.sagepub.com) estimates all the variance components in parallel. Only the variance component of the axes, ξ1, is of interest to subsequently estimate the axes’ reliabilities and the standard error of measurement.
By fitting the restricted CFA model to the correlation matrix of the items, the variance of a latent axis variable, ξ1, exactly estimates the mean correlation of two items caused by a respective axis. The mean correlation of two items caused by the focused construct is the main component in the well-known Spearman–Brown formula of reliability.

Note that ξ1 is the axis variance as estimated by the CFA model, for example, Figure 2 and item_n derives from Σ(wi 2 items per scale)
Applications
Data from various dissimilar instruments were used to conduct the adequate variance decomposition by the restricted CFA for each instrument and to compare its results with the reliability estimation derived by applying the Nunnally–Bernstein formula. To test for the hypothesis of insensitivity of the Nunnally–Bernstein approach to the scale-specificity component, we additionally run Tracey’s (1997) RANDALL program that considers pairwise comparisons of the correlations of scales and therefore is sensitive to scale-specificity.
The Instruments
We analyze 13 instruments (Table 1) representing six types of circumplexes as shown in Figure 1. Half of the instruments assess variants of the IPC, whereas the other half realizes an independently developed value circle, for example, values of team roles, leadership roles, organizational culture, and customer orientation. The Love Styles pretend to be hexagonally arranged, and the System for Multi-Level Observation of Groups (SYMLOG) instrument realizes a sphere. All instruments are designed to be perfectly circumplex structured (equal spacing of scales or items). Quasicircumplex instruments such as the Schwartz (1992) value circle were not included.
Samples
Seventeen German data sets were analyzed (Table 2). Predominantly, self-reports were assessed in university student or patient samples. In some samples, participants were asked for other perception and in four cases for metaperceptions, which are prediction of one’s own image in others. For example, leaders predicted how they were perceived by their team members in the Competing Values Leadership Instrument (CV-LI), and service providers anticipated how their service is judged by customers in the COC. As the perspectives might change the variances of the components, we analyzed each perspective separately and reported the results of the resulting 29 subsamples.
Samples.

Procedure
The data of the 29 subsamples were transformed to correlation matrices of the items. The adequate models (e.g., with fixed weights of .0, ±.707, ±1.0 for the circumplex type a, or fixed weights of ±.38268 and ±.92388 for the circumplex type b, etc.) were specified in SIMPLIS and fitted with the maximum likelihood (ML) procedure in LISREL 8.8 (Jöreskog & Sörbom, 2006). RANDALL (Tracey, 1997; he provided a version capable of 18 variables) used the correlation of scales computed by ipsated items. Further analysis, for example, for the components of the Nunnally–Bernstein formula, was conducted in SPSS 19.
Results
Columns 5 to 9 in Table 3 report the resultant variance components of the circumplex items according to the respective CFA models of the 13 instruments and 29 subsamples. The personality descriptions in the IAL, the IAS, and the Love Styles (Marburger Einstellungsinventar für Liebesstile [MEIL]) as well as the descriptions of significant others in the Impact Message Inventory (IMI) were only marginally affected by the general factor (<5% of variance). In three of these instruments, a large amount of item variance is due to the axes (>20%), regardless of self or other perception instructions. The IIP, the CSIV, and all the value circle instruments show 10% to 35% general factor variance in self-reports. In other reports and metaperceptions assessed with the CV-LI, the OCAI, and the COC, the general factor accounts for more than 35% of an item’s variance (column 5 in Table 3).
Results. Variance components from the restricted CFA model (columns 5-9), estimated axes reliability (column 11) and standard error of measurement SEm (column 13) for 28 sub-samples. Compared with the Nunnally-Bernstein reliability (column 14) and Tracey’s Randall Correspondence Index CI (column 15).

The axes of the respective circumplexes accounted for varying portions of the item variance: More than 20% for the IAL, the IAS, the IMI, and the SYMLOG; but less than 10% for some of the value circles and the Love Styles assessment (column 6 of Table 3). Especially the items of the CV-LI in the field sample (Sample 12) and the COC contained less than 5% axes’ variance.
Given the low number of estimated parameters (besides the free errors: 2, 3, or 4 parameters, see columns 5-8, Table 3) by the tau-equivalent CFA models, the global fit indices are acceptable (M adjusted goodness of fit [AGFI] = .691, SD = .107; M parsimonious goodness of fit [PGFI] = .651, SD = .070; M root mean square error of approximation [RMSEA] = .088, SD = .014). Across the 29 models, the global fit indices were only marginally related to the components explaining the variance. Instead they are associated with the models’ degrees of freedom (AGFI r = −.86; PGFI r = −.81; RMSEA r = −.36), being determined by the item number of the instrument (AGFI r = −.88; PGFI r = −.79; RMSEA r = −.35).
Next, Spearman–Brown’s “list-length–reliability formula” was applied to estimate the axis reliability from the mean correlation of two items attributable to the axes (the % axes’ variance, column 6 of Table 3, divided by 100). The number of items adding to an axis in a circumplex has to be computed by the sum of squared weights among all items (column 10 in Table 3).
The axis reliabilities are excellent, .90, for the IAL, the IAS, and the IMI, but are worse (lower than .40) for the field sample of the CV-LI and the COC. As the ML estimators in LISREL included standard errors (for the axes’ variance, they are added to column 6 of Table 3), a confidence interval for each reliability can easily be calculated.
Column 13 of Table 3 uses the reliabilities in column 11 and the axes’ variance to compute SEm (note that this variance coefficient depends on a researcher’s decision to multiply with a constant or to include z-standardized scores. Column 12 gives the respective raw variance). In instruments with good reliabilities, the standard error of measurement limits itself to a third of a standard deviation, whereas in instruments with low reliabilities (i.e., TRC, CV-LI, OCAI, COC), the 90% confidence intervals of a single location (±1.65 × SEm) exceed the standard deviation of the axis.
In the next step, we compared our results with the Nunnally–Bernstein formula application as proposed by Markey et al. (2005). The Nunnally–Bernstein formula was not applied for analyzing instruments with a single item per spatial position (i.e., the COC and SYMLOG instrument) because of unknown item reliabilities. In case of high axis reliabilities, the estimated CFA reliabilities and the Nunnally–Bernstein formula perfectly match (columns 11 and 14 of Table 3, Figure 3). However, as hypothesized, if the scale-specificity variance component is high (column 7 of Table 3), the CFA reliabilities were more conservative than the Nunnally–Bernstein formula. Overestimation by the Nunnally–Bernstein formula especially emerges for two of the instruments, the Love Styles (MEIL), and the CV-LI, where scale-specificity accounted for more than 70% and the axes for less than 30% of the CFA ipsated scale variance (column 6 over the sum of columns 6 and 7).

Comparison of the CFA reliability with the application of the Nunnally–Bernstein formula (column 11 and 14 from Table 3).
In the last step, we compare our results with one of the contemporary methods to evaluate the circumplexity of scales. Tracey’s (1997) RANDALL’s correspondence index (CI; see the last column in Table 3) is especially sensitive to the scale-specificity (r = −.788, across n = 23 subsamples) and the axes variance (r = .637). Although both variance components are correlated across the subsamples (r = −.405), the axes variance can significantly add to the explained variance of RANDALL’s CI in a stepwise regression, F of change (1, 20) = 9.38, p = .01. A proportion representing the axes variance from the CFA ipsated scale variance (column 6 over the sum of columns 6 and 7 of Table 3) best resamples RANDALL’s CI (r = .903). And vice versa, a low RANDALL’s CI indicates the cases of reliability overestimations by the Nunnally–Bernstein approach visible in Figure 3: The interaction of the Nunnally reliability and RANDALL’s CI add to the Nunnally–Bernstein prediction of the proposed CFA reliability, F of change (1, 20) = 8.08, p = .01.
Discussion
Gurtman and Pincus (2000) urged for the amount of variance accounted for by the axes of a circumplex: Wiggins et al. (1981) argued that any model-testing procedure applied to the circumplex should be able to answer two questions about the set of test variables (scales): “(1) How well do these variables conform to a circular model? and (2) How much of the observed covariance among these variables is accounted for by such a model? (p. 267) However, as with most other analyses of this kind (however, see Wiggins, 1995), we did not specifically address the second question. (p. 382)
In our article, the amount of covariance among the items accounted for by the circumplex model was the core question. We propose to fit a restricted CFA model taken from the tau-equivalence family on raw item intercorrelations to systematically estimate the variance in the components of the circular structure. It uses common structural equation modeling software and does not require specialized circumplex statistics. Nevertheless, the model ensures a close conceptual match and supplies clear numerical information on each source of variance.
The Variance Components
Besides the axes of a circumplex, each the general factor and the scale-specificity additively accounted for the manifest raw scale’s variance. On one hand, individual differences in acquiescence in questionnaires may be merely rooted in loss of motivation; for example, due to exhaustion by completing large batteries of patient-outcome questionnaires (e.g., IIP post-measure in Sample 5) or by answering a series of repetitive questions (e.g., metaperceptions of student group members in the SYMLOG Sample 17 from Fassheber, Niemeyer, & Kordowski, 1990). In the applied approach, acquiescence is usually eliminated by examining ipsated items or scales. However, in some instruments, the variance accounted for by the general factor (ξ
However, only the component of the axes variance effectively locates an individual assessment or a group mean in the two-dimensional space. More than 20% of the item variance can be accounted for by the axes of a “good” IPC (IAL, IAS-R, and IMI; the SYMLOG for a sphere model), but less than 10% is found in some of the value circles being used in applied fields (Table 3). In contrast to traditional circumplex fit indices, the isolated axes variance component allows for the estimation of a dimension’s reliability.
Our considerations and analyses also suggest a possible explanation for the absence of this useful statistic in previous research. We suggest that the circumplex axiom of no preferred rotation (e.g., Acton & Revelle, 2004) had prevented researchers in the construct-validity approach from supplying a measure for the dimension’s validity, whereas the researches in the application approach might have been repelled by circumplex-specific statistics, software, and coefficients. To meet the axiom of no preferred rotation, the CFA model in Figure 2 abandons the option to estimate the variance of each axis separately, but rather restricts the axes to equality. Such stringent restrictions further reduce the required sample size. Nevertheless, future applications might explore relaxing some of the restrictions of the model and might thereby go beyond estimating reliability only. A more modest extension of the procedure may apply the model to quasicircumplex structures merely by adequately adapting the cosine-weights (e.g., for the Schwartz’s value circle, Strack & Dobewall, 2012; Vecchione, Casconi, & Barbaranelli, 2009). We have omitted quasicircumplex instruments from the analysis presented here to allow for a clear test of the Nunnally–Bernstein formula, which needs equal spacing of scales to secure the independence of axis variance and scale-specificity. This scale-specificity component appropriately increases the reliability of the raw scales, but leads to imperfect projections of the scales onto the circumplex axes and thereby decreases the reliability of the circumplex’ dimensions.
Two further comments need to be made on the scale-specificity component. First, this component has previously been the main target of many circumplex-related papers in the construct-validity approach and was commonly examined by visual-inspection procedures (e.g., exploratory factor analysis [EFA] loadings of ipsatized or multidimensional scaling [MDS] positions of raw scales), as well as by specialized circumplex tests (e.g., the randomization test of order relations RANDALL, Tracey, 1997, also used here; and the CIRCUM software, Browne, 1992; Fabrigar, Visser, & Browne 1997; Gurtman & Pincus, 2006). We have shown that the RANDALL correspondence coefficient relates especially to the ratio of scale-specificity and axis variance. One of the instruments suffering from a large proportion of scale-specificity is the Love Styles assessment (MEIL; Bierhoff, Grau, & Ludwig, 1993). In our data, AGAPE was positioned between EROS and MANIA (instead of between EROS and STORAGE). Actually, Bierhoff et al. (1993) as well as Hendrick and Hendrick (1986) did not intend to model a circumplex (hexagon); both groups of authors worked with their instruments as measuring six, more or less orthogonal dimensions. We nevertheless included the MEIL as a realization of Lee’s (1973) hexagon to demonstrate the power of our approach to uncover pseudocircles. In applied sciences (e.g., management and marketing), many figures illustrate attributes or facets of a construct by aesthetically appealing wheels and circles. The inappropriate suggestion underlying a circumplex structure can be unmasked by specific circumplex methods like RANDALL or by the more general and multifunctional CFA approach being presented here. The proposed model isolates the general factor, the axes component, the scale-specificity, and when indicated the block component, as well as the item-specificity within a single equation. The resulting variance components add up to 100% and can be adequately presented within a simple pie graph. This represents a clear improvement in parsimony and commensurability with other common diagnostic methods.
The second comment on the scale-specificity refers to the previously mentioned application of the CFA procedure to quasicircumplex structures. As any large latent source of scale-specificity does, so also a quasicircumplex positioning of scales would change the raw variance estimation for the axes. As the scales are not equidistant, they become artificially correlated with the axes. This is why scale-specificity fails to adequately reduce the dimension variance as being used in the Nunnally–Bernstein formula’s denominator. The Nunnally–Bernstein formula adequately compensates only for the item-specificity and for the general factor. As the variance of the general factor varies by definition equally among all scales, the dimension’s variance is restricted, and therefore, the Nunnally–Bernstein reliability estimator adequately adapts to it. However, the scale-specificity due to this artificial correlation does not perfectly restrict the dimension’s variance and, therefore, the Nunnally–Bernstein reliability overestimates the axis reliability in case of major scale-specificity (see Figure 3). In conclusion, circumplex instruments with significant scale-specificity should not be approached using the Nunnally–Bernstein formula. Second, because the negative relation of the axes variance component and the scale-specificity is not very close, as we have shown across the samples, instruments can be found that fail to reach good indices of circumplexity (e.g., RANDALL-CI) but nevertheless allow for a dimensional coordinate summary, given an acceptable axes reliability. The axes reliability is solely determined by the number of items and the axes variance components, and the latter is additive to the scale-specificity. Therefore, a RANDALL fit is not essential for axes reliability.
Taken together, the presented material clearly speaks for reporting axes reliabilities for circumplex-based instruments in future research. To gain the required axes variance component, the article recommends the tau-equivalent CFA variance decomposition model.
Footnotes
Acknowledgements
We wish to thank the two anonymous reviewers for their recommendations.
Declaration of Conflicting Interests
The author(s) declared no potential conflicts of interest with respect to the research, authorship, and/or publication of this article.
Funding
The author(s) received no financial support for the research and/or authorship of this article.
Author Biographies