
Abstract
Attributing a negative achievement outcome (e.g., failing a test) to causes that are personally uncontrollable and stable elicits a low expectancy of future success, feelings of hopelessness in that domain, and reduced behavioral efforts to succeed. Thus, a tendency to make such attributions (i.e., dysfunctional academic attributional style) is an individual differences variable that puts people at risk. Two studies examine the factor structure and predictive validity of the Academic Attributional Style Questionnaire (AASQ). Study 1 (using two independent samples) found that the AASQ is a factorially valid measure of functional and dysfunctional attributional styles. In Study 2, during repeated failure in an academic task, the success expectancies, hopefulness, and behavioral persistence of students with a dysfunctional attributional style were lower than those of students with a functional attributional style. These findings modify the attributional theory of achievement motivation (Weiner, 1985) by positing an individual differences moderator variable (i.e., attributional style) and extend attributional research on at-risk students.
You get a D in a course required for your Major. Why? “The professor is a hard marker”; I didn’t study enough”; “I was out sick a lot”; “It was a new professor”; “It was too hard for me”; “The prof hates me”; “I didn’t connect with the material—I think I chose the wrong Major.”
Professors hear many versions of causal explanations for poor performance by students. Despite years of experience in crafting and evaluating everyday explanations of events, students (and some professors) typically are unaware of the connection between their causal explanations and future success. Yet the explanations are a window into students’ causal understanding of the world, and, when adaptive, help them to predict and control future events and outcomes (Heider, 1958; Weiner, 1985), as well as protect self-esteem and persist in the face of failure (Weiner, 1985, 1992). Causal explanations (or attributions) play an important role in understanding a diversity of behaviors, such as academic achievement (Craven, Marsh, & Debus, 1991; Follette & Jacobson, 1987; Perry & Magnusson, 1989), sports achievement (Graham, Kowalski, & Crocker, 2002; Le Foll, Rascle, & Higgins, 2006; Spray, Wang, Biddle, Chatzisarantis, & Warburton, 2006), helping behavior (Weiner, 1985), and interpersonal relations (Juvonen & Murdock, 1993).
A key theory of achievement motivation, Weiner’s (1985, 1992) model postulates that causal attributions (i.e., inferences about the causes of events and outcomes)—and specifically dimensions of causes—indirectly determine persistence behavior. The model proposes an “attribution–affect–action motivational sequence, in which thoughts determine what we feel and feelings determine what we do” (Weiner, 1980, p. 676). The attributional model focuses on the causal dimensions that have a distinct theoretical role in achievement motivation: (a) internal–external locus of causality, (b) controllable–uncontrollable causes, 1 and (c) unstable–stable (i.e., temporary vs. long lasting) causes. Specifically, attributing a negative outcome to causes that are personally (i.e., internally) controllable and unstable (e.g., low effort) is considered functional, as such explanations lead to higher expectations of future success in that domain, higher hope, and higher levels of persistence behavior. In contrast, attributing a negative outcome to causes that are personally uncontrollable and stable (e.g., low ability) is considered dysfunctional, as these causes lead to lower expectations of future success in that domain, lower hope, and lower persistence (Weiner, 1985). For example, a personally controllable, unstable cause of failing a math exam would be “I got drunk the night before,” and a personally uncontrollable, stable cause would be “I’m no good at math.” Both causes are internal to the student who failed, but differ in control and stability. Personally controllable, unstable causes of failure elicit guilt and subsequently greater behavioral efforts to improve in that domain, whereas personally uncontrollable, stable causes of failure elicit shame and reduced behavioral attempts to improve in that domain (Weiner, 1985, 1992). The causal dimensions (personal control and stability) and their initiating role in the emotion-mediation of persistence behavior have been substantiated in a wide variety of experimental and correlational studies (e.g., Andrews & Debus, 1978; Carr, Borkowski, & Maxwell, 1991; Craven et al., 1991; Di Paula & Campbell, 2002; Finn & Rock, 1997; Försterling & Rudolph, 1988; Horner & Gaither, 2004; Licht & Dweck, 1984; Mehlman & Snyder, 1985; Mueller & Dweck, 1998; Perry, 2003; Perry, Hechter, Menec, & Weinberg, 1993; Perry & Magnusson, 1989; Perry, Stupnisky, Daniels, & Haynes, 2008; Ruthig, Haynes, Perry, & Chipperfield, 2007; Shell, Colvin, & Bruning, 1995; Struthers & Perry, 1996; Stupnisky, Stewart, Daniels, & Perry, 2011; Van Overwalle, Mervielde, & De Schutyer, 1995; Wong & Weiner, 1981).
Persistence behavior—the tendency to continue to try to improve in spite of difficulties (Bandura, 1986)—is sometimes characterized as “resiliency,” and represents “successful adaptation despite challenging or threatening circumstances” (Martin & Marsh, 2006, p. 267). Persistence is a key behavioral variable to understand, as every individual has experienced low-level performance at some point in their life, and many overcome these experiences (Andrews & Debus, 1978; Di Paula & Campbell, 2002; Finn & Rock, 1997; Försterling & Morgenstern, 2002; Martin & Marsh, 2006). Notably, the tendency to persist under difficulty is strongly related to perceptions of one’s own competence or self-mastery (Pearlin & Schooler, 1978; Perry, 2003). Self-mastery is typically measured as a general belief or orientation reflecting the extent to which an individual feels that he or she has personal control over life outcomes (e.g., “I can do just about anything I really set my mind to do”; Pearlin & Schooler, 1978). In academic settings, the relationships between persistence, self-mastery, and attributions of personal control are revealed in what Perry (2003) referred to as the “paradox of failure,” where “bright, enthusiastic high school students become demotivated and fail once they reach college, seemingly unable to make the adjustment to meet the demands for increased [personal control]” (p. 315). Experiences of low personal control over specific academic outcomes (common in 1st-year university students) may erode a sense of self-mastery and result in giving up (e.g., Menec, Perry, & Struthers, 1995). Perceived personal control is thus a singularly important marker of students’ persistence and ultimate academic success (Perry, 2003). Explaining failures with low ability attributions is demotivating, and if accompanied by an implicit belief that one’s intelligence is fixed or unchanging, will typically lead to avoidance of challenges/difficulty due to a greater concern with looking unintelligent to others (Dweck, 1986). In contrast, students who seem undaunted by challenges/difficulties tend to view their intelligence as improvable (incrementally) and typically focus on explanations for failure that emphasize their personal control (e.g., “I didn’t do well on this exam, but I can see where I went wrong; now I know what I can do differently for the next exam”). The link between perceived personal control and persistence behavior is established early in life, because even very young children who use dysfunctional (e.g., low ability) attributions to describe their failures subsequently put in lower effort on the difficult task (e.g., Dweck, 1986; Mueller & Dweck, 1998).
Heider (1958) anticipated that individual differences in self-perception are important, and incorporation of individual differences in attributions into the study of causal beliefs has been successful, most notably with the Attributional Style Questionnaire (ASQ; Peterson, Semmel, von Baeyer, Abramson, Metalsky, & Seligman, 1982). Research on individual differences in causal attributions about negative achievement outcomes corroborates Weiner’s achievement motivation model, linking a tendency to make dysfunctional attributions with lower achievement in academic settings (e.g., Gibb, Zhu, Alloy, & Abramson, 2002; McKenzie & Schweitzer, 2001; Perry, 2003; Peterson & Barrett, 1987) and in athletic settings (e.g., Gordon, 2008; Le Foll et al., 2006; Miserandino, 1998; Rascle, Le Foll, & Higgins, 2008; Seligman, Nolen-Hoeksema, Thornton, & Thornton, 1990). For example, even after controlling for possible confounds such as ability and depression level (Peterson & Barrett, 1987), or self-efficacy and employment responsibilities (McKenzie & Schweitzer, 2001), freshman students with a tendency to make dysfunctional attributions for academic failures at the beginning of the year had lower grades by the end of their 1st year than students who tended to explain their failures with functional causes.
Studies confirming the link between individual differences in attributions and achievement motivation add to the overall construct validity of the attributional model (Weiner, 1985). Such studies also modify the theory by positing an individual differences moderator variable (attributional style). However, despite research investigating problematic attributional tendencies in academic settings (e.g., Försterling & Rudolph, 1988; Perry et al., 2008; Peterson & Barrett, 1987; Ruthig et al., 2007), there are no studies confirming the factorial and predictive validity of a measure of dysfunctional academic attributional style. We present reliability and factor analysis findings on a new measure, the Academic Attributional Style Questionnaire (AASQ; cf. Higgins & MacGregor, 2005) and new evidence of the AASQ’s predictive validity. Our purpose was to determine (a) whether the attributional dimensions measured by the AASQ would emerge as reliable and cohesive factors, discriminable from one another; (b) whether dysfunctional academic attributional style was linked to lower success expectations, hope, and behavioral persistence in a difficult academic task, as predicted by Weiner’s (1985) model; and (c) whether dysfunctional academic attributional style predicted differences in perceptions of self-mastery, beliefs about intelligence, and a broad behavioral marker—end-of-term grades.
Method
Participants and Procedure
All participants were drawn from introductory psychology courses at a Canadian university and received research credit for participating.
Study 1
Sample 1
One hundred and eight (81 females, 27 males) undergraduates completed the AASQ in groups of 10 to 15 students. The mean age of respondents was 19.96 (SD = 3.31) years. Participants were informed that the study involved filling out a paper-and-pencil questionnaire about their perceptions of a number of possible academic outcomes. Individual completion time of the AASQ averaged 15 min. After completing the questionnaire, participants were partially debriefed. The purpose of Sample 1 was to explore the reliability and factor structure of the AASQ.
Sample 2
On validating the reliability and factor structure of the AASQ, a separate sample of 104 (73 females, 31 males) undergraduates with a mean age of 20.51 (SD = 4.13) years completed the AASQ. The procedure for both the samples was the same (i.e., the AASQ was administered in a small group setting, and questionnaire instructions and partial debriefing were identical). For Sample 2, it was also explained that some students may be asked to return to a lab setting within a few weeks for a further test of their performance on an academic task. The purpose of testing the second sample was to cross-validate the reliability and factor analysis results from the first sample and to provide a pool of participants for a subsequent experiment (Study 2, described below) on academic persistence and performance.
Study 2
Approximately 15 days after Sample 2 testing was completed, testing began on 32 undergraduates (22 females, 10 males) from Sample 2. Participants were tested one at a time in a laboratory setting. The mean age of participants in Study 2 was 20.16 (SD = 4.57) years. Attributional style scores were calculated as the mean of the Personal Control and Stability subscales. To examine individuals with relatively unambiguous attributional styles, participants in the top 15% and bottom 15% of the attributional style score distribution in Sample 2 were classified into a functional attributional style group (N = 16; high scorers) and dysfunctional attributional style group (N = 16; low scorers), respectively. Those participants who were mixed in their attributional style (N = 72; middle scorers) were considered indeterminate and excluded from the experiment. 2 Until the end of Study 2 testing, students who participated believed they were randomly chosen to take part. Study 2 testing took approximately 45 min per person and 2 weeks for all participants to be tested. Participants were informed that Study 2 involved several typing trials of 4 min each, during which they were to try to meet a typing performance goal provided by the experimenter. They were also informed that testing involved filling out several paper-and-pencil questionnaires about their reactions to the typing trials and their performance before and after some of the typing trials. Participants were informed the typing trials would be videotaped (only the computer monitor and their hands on the keyboard/mouse) and that the trials, questionnaire completion, and breaks between the trials meant that testing would take approximately 45 min. Prior to the typing trials, participants indicated their typing experience, consent to access their university transcript for end-of-term grades (grade point average [GPA]), and half of the participants completed two short questionnaires measuring self-mastery (feelings of competence) and their beliefs about intelligence (described below). The other half completed the self-mastery and beliefs about intelligence questionnaires after their typing trials were completed. At the completion of their lab session, each participant received a partial debriefing. Full debriefing of all participants in both studies occurred at the completion of Study 2 testing.
At the beginning of the lab session, the experimenter set the video camera to record, making sure that the participant was aware the recording had started. After explaining the typing task and describing the performance goal, there was a 2-min practice session to “warm up.” The practice session was immediately followed by a 4-min typing trial (Trial 1) in which participants were given four short paragraphs in succession and asked to correctly type each paragraph in a 1-min period. Different paragraphs were used on each trial, and a Latin Square ordering of the test paragraphs ensured the presentation was random across trials and participants. Participants were told that the goal was to type each paragraph completely and correctly in the time limit (to earn one full point each), or completely and with five or fewer typing errors in the time limit (to earn one-half point each). Anything else would receive zero points. However, the typing task was created at a level of difficulty (in pretesting with an expert typist) that ensured all participants would receive zero points on all of the trials. The overt “failure” (visible assignment of a zero score by the experimenter) on each trial was to ensure that the typing task was experienced (at least outwardly) as a failure by the participants.
As shown in Figure 1, upon finishing Trial 1, participants completed scales rating their causal beliefs about their typing performance on that trial, and scales rating their expectation of success and hopefulness about the next trial. After completing the post-trial questionnaires, participants were told the experimenter had to go into an adjacent lab room “for a few minutes,” ostensibly “to make sure the computer data file recording their typing updated correctly.” During the free period, the experimenter was out of the participant’s sight. As in the method used by Le Foll et al. (2006) and Rudisill and Singer (1988), in the testing room, several magazines were left on a table beside where the participants worked on the typing task, and before leaving the room the experimenter pointed to these and to a stack of “practice” paragraphs. Each participant had been informed at the outset about the “break” between trials and was aware they could use the free period to read the magazines, practice their typing, or do nothing. To be able to observe, a posteriori, the activity of participants (i.e., persistence behavior) during the 4-min free period, a video camera filmed each participant’s entire session in the laboratory. This technique has been used in other studies (e.g., Le Foll et al., 2006; Martin-Krumm, Sarrazin, Peterson, & Famose, 2003; Orbach, Singer, & Murphey, 1997; Orbach, Singer, & Price, 1999; Rudisill, 1988). The purpose of starting the videotape recording at the beginning of the testing session was to minimize reactivity of participants during the “free period.”
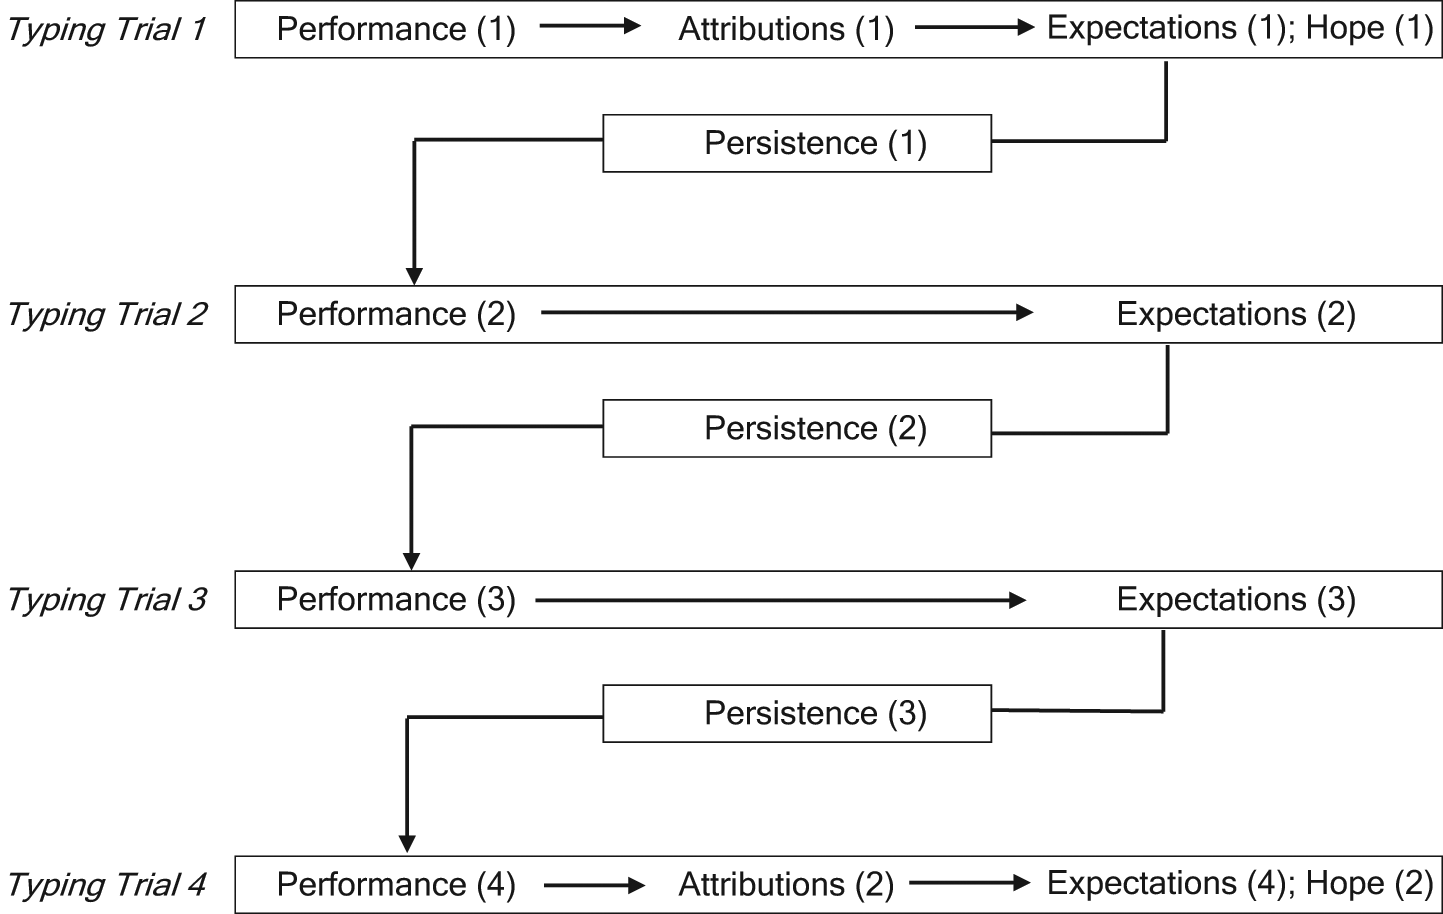
Trial by Trial timeline and measures in Study 2
Following the 4-min free period, Trial 2 began and was identical to Trial 1 in both length and nature, using different paragraphs. Before each trial, the goal “to type each paragraph completely and correctly in the time limit” was repeated to the participants. Upon completing Trial 2, the “failed score” was provided by the experimenter, and the expectations questionnaire was again administered and followed by a 4-min free period where short-term persistence was again measured while the experimenter had to go to the adjacent room, ostensibly to check the data file update. At the end of the 4-min free period, Trial 3 began (again using different paragraphs). Upon completion of Trial 3, the experimenter again gave the participant a “failed score,” and the Expectation and Emotion scales were administered, followed by a 4-min free period where short-term persistence was once again measured while the experimenter was out of sight. Finally, Trial 4 was started and was the same format and length as the three previous trials (with different paragraphs being used). Following Trial 4, the “failed score” was again provided by the experimenter, and participants completed scales rating their attributions about typing performance on that trial, and scales rating their expectation of success and hopefulness about the next trial. However, after the questionnaires were completed, participants were told the trials/testing was finished, and were thanked for their participation and partially debriefed.
Ethical considerations
Several steps were taken to ensure that this study met American Psychological Association (APA) ethical guidelines. First, approval was obtained from the institutional ethics board before the study began. Second, we obtained written (and informed) consent from all participants. The informed consent form explained the nature of the task in each study, the approximate amount of time involved, and, in Study 2, the video recording and the use of end-of-term grades. Sample 2 participants in Study 1 were aware that they may be contacted for follow-up testing in a lab setting and were provided with an option of “no further contact” if they wished not to participate. None of the participants declined to be contacted. Study 2 participants were given the opportunity to refuse being video recorded and had the option of viewing their recorded session, if so desired, as well as having their recording destroyed and omitted from the results of the study. None of the participants chose any of these options. The experimenter asked for permission to access end-of-term grades (GPAs), to which all of the participants consented. All participants in both studies were told they had the option of having their questionnaire(s) destroyed and omitted from the results of the study and also were told that they may leave the study at any time without the loss of any research credit. None of the participants chose either of these options. Third, participants were partially debriefed immediately after their participation, and, after the investigation, all participants were provided a full debriefing in which the purpose of the study was explained to them, with a brief lesson about the attributional theory of achievement motivation. It was also explained that the typing task was created to induce failure, and the hypotheses and results of the investigation were provided. Their attributional style was not divulged and only aggregate results were made available.
Materials
Study 1
AASQ
Designed to measure dysfunctional academic attributional style, the AASQ is based on the Causal Dimension Scale–II (CDS-II; McAuley, Duncan, & Russell, 1992). Similar to other attributional style measures such as the Attributional Style Assessment Test (ASAT; Anderson, 1983, 1985), the ASQ (Peterson et al., 1982), or the Extended Attributional Style Questionnaire (EASQ; Metalsky, Halberstadt, & Abramson, 1987), the AASQ is comprised of hypothetical negative outcomes. The six negative outcomes on the AASQ were drawn from Peterson and Barrett (1987), who found good internal consistency across the negative outcomes (α = .84).
3
Moreover, Peterson et al. (1982) found good internal consistency (α = .72) and test–retest reliability (α = .76) for similar negative outcomes. The AASQ instructions include the following:
For each item, think about how such a thing could likely happen to you and then write down one plausible (likely) reason that comes to mind. After writing down a likely cause for a misfortune, then rate that cause on each of the 12 scales provided by circling one number on each scale. When doing the ratings, be sure to focus on the cause (that is, the reason for the onset) of the problem, not on the problem.
As shown in the appendix, for each negative outcome on the AASQ, the attributional dimensions (“locus,” “internal control,” “stability,” “external control”) are each measured by three ratings scales (see appendix footnote). The rating scales are 9-point, Likert-type scales, bipolar and anchored so that, after reverse scoring the stability items, internal (locus), internally controllable, externally controllable, and unstable attributions receive higher scores. Scores for each scale (e.g., Locus-1) are averaged or summed across the six negative outcomes, resulting in 12 continuous scale scores. In a pilot study (N = 60), AASQ scales had good internal consistency (Locus: α = .78, Personal Control: α = .91, Stability: α = .70, and External Control: α = .90; Higgins & MacGregor, 2005). Internal consistencies of the AASQ scales were α = .76 to .81 (Locus); α = .87 to .88 (Internal Control), α = .77 to .89 (Stability), and α = .87 to .89 (External Control) in the present study. The appendix illustrates one of the AASQ negative outcomes (“You fail a final examination”) and the rating scales.
Study 2
Typing performance
A performance score was computed for each participant on each trial. Within a trial of four paragraphs, each paragraph had a unique character total. The sum of the correct characters typed by the participant (across all four paragraphs in a trial) divided by the sum of unique totals in a trial yielded a percent correct score on each trial. Correlations among the four performance scores ranged from r = .94 to .98 (all ps < .001) in the present study.
Causal beliefs
As shown in Figure 1, after the first and the last typing trials, the CDS-II (McAuley et al., 1992) evaluated causal attributions about performance. The first question on the CDS-II assessed the perception of success or failure on a binary rating scale that asks participants to choose whether they consider their performance “more like a success” or “more like a failure.” As described in the AASQ above, the CDS-II then asks the participant to write down a likely cause of his or her performance and then rate the cause on 12 rating scales designed to measure the attributional dimensions “locus,” “internal control,” “stability,” “external control.” As with the AASQ, each causal dimension is measured by three ratings scales (see “Note” section of appendix). The rating scales are 9-point, Likert-type scales, bipolar and anchored so that, after reverse scoring the stability items, internal (locus), internally controllable, externally controllable, and unstable attributions receive higher scores. The CDS-II scales have acceptable levels of internal consistency (α = .65-.92, McAuley et al., 1992; α = .79, Matthews & Moran, 2011; α = .70-.90 in the present study).
Expectations of success
Expected success on the next typing trial was measured after each typing trial. Participants were asked to “Think about your performance just now on the typing task. On a scale of 0% to 100%, please indicate how much better you expect to do on the next typing trial (compared with the last trial).” Participants filled in a blank “I expect to do _________% better in the next trial”. This measure is based on Le Foll, Rascle, and Higgins (2008) and is similar to other measures of success expectations (e.g., Biddle & Hill, 1992; Orbach et al., 1999; Rudisill, 1988, 1989; Rudisill & Singer, 1988). Correlations among the four success expectation scores ranged from r = .69 to .91 (all ps < .001) in the present study.
Hope
Hopefulness was measured after the first and last typing trials. Participants were asked to “Think about your performance just now on the typing task,” and to then indicate how hopeful they felt on a 9-point Likert-type scale. The scale anchors were (1) “not at all hopeful about doing well on this task next time” and (9) “very hopeful about doing well on this task next time.” This measure, based on Le Foll et al. (2008), is similar to other measures of hopefulness in attribution research (e.g., Biddle & Hill, 1992; McAuley & Duncan, 1990; Orbach et al., 1999; Rudisill & Singer, 1988; Weiner, 1985). The correlation between the two hopefulness scores was r = .75 (p < .001) in the present study.
Persistence
Typing Trials 1, 2, and 3 were followed by a 4-min free period (see Figure 1). Persistence was measured a posteriori by reviewing the videotaped free periods. A persistence score in each free period was defined, for each participant, as the number of seconds spent typing material from the practice paragraph(s) (i.e., fingers on the keyboard typing) during the free period of 4 min. Scores could range from 0 s to 240 s. The 4-min free period was chosen so that there would not be a time difference between the typing trial length and the free period, and is comparable with other studies of short-term persistence behavior (e.g., Le Foll et al., 2006, 2008; Rudisill, 1988, 1989; Rudisill & Singer, 1988). We assumed that a 4-min free period would produce an adequate measure of short-term persistence behavior, compared with long-term persistence (such as withdrawing or continuing in a course). Correlations among the three persistence scores ranged from r = .44 to .84 (all ps < .01) in the present study.
Self-mastery
The Self-Mastery Scale (SMS; Pearlin & Schooler, 1978) evaluated participants’ general beliefs about control over events in life. The SMS includes seven statements (e.g., “I can do just about anything I really set my mind to do”) and each statement is rated on a scale from 1 (strongly disagree) to 6 (strongly agree). After reverse scoring the negatively worded items (e.g., “I often feel helpless in dealing with the problems of life”), an overall average score is created with higher scores representing higher perceived self-mastery. The SMS has acceptable internal consistency (α = .70, Seeman, 1991; α = .83 in the present study). Pearlin and Schooler (1978) found a close relationship between self-mastery and affective states such as hopefulness. Other research has found self-mastery is related to academic performance (Richard & Pals, 2002) and persistence more generally (Carr et al., 1991).
Beliefs about intelligence
The Beliefs About Intelligence Scale (BIS; Dweck, Chiu, & Hong, 1995) measured participants’ beliefs about whether intelligence is fixed or changeable. The BIS includes three statements and each statement is rated on a scale from 1 (strongly disagree) to 6 (strongly agree). After reverse scoring the negatively worded items (e.g., “You have a certain amount of intelligence and you can’t really do much to change it”), an overall average score is created with higher scores representing a stronger belief in the malleability of intelligence. The BIS has excellent internal consistency (α = .94-.98, Dweck et al., 1995; α = .92 in the present study).
GPA
End-of-term GPA was acquired from the Registrar’s office at the end of the academic year (Fall, Winter, and Intersession terms) for each participant, with scores ranging between 0.0 (F) and 4.3 (A+).
Analyses
Study 1
Factor structure
AASQ responses were factor analyzed in each sample. As an overall summary of our factor analysis method, principal components analysis was initially used as a pointer to determine the number of factors, and when the number of factors was determined, principal axis factor extraction was then used to fit the factor model. Therefore, in the initial step of the analysis of each sample, the number of factors were determined by (a) eigenvalues greater than 1.0 of unrotated factors (Kaiser, 1961) and (b) a scree test (Cattell, 1966) of the eigenvalues of the correlation matrix. Once the number of factors was determined, principal axis extraction was used with oblique rotation (Promax). If the interfactor correlations were small (less than .30; Tabachnick & Fidell, 2007) then to achieve simple structure of the extracted factors, we used orthogonal rotation (Varimax). Factor loadings equal to or greater than .40 identified salient items. To investigate whether the findings cross-validate, we examined the degree of congruence in the factor solutions in the two samples using Cattell’s (1978) congruence coefficient.
Study 2
Experimental design
Attributional style is a quasi- experimental variable. Participants were in one of two attributional style groups (Functional AS; Dysfunctional AS). The variability of attributional style scores within each group was comparable (i.e., Levene’s test indicated no variability differences between the groups on any of the AASQ causal dimensions).
Results
Study 1
Descriptive Data
Correlations, means, standard deviations, range (minimum–maximum), and coefficient alpha reliabilities for AASQ scale items are presented in Table 1 (Sample 1) and Table 2 (Sample 2). Coefficient alpha reliabilities of the AASQ CDSs were good (range = .76-.90) and were comparable in the two samples. The obtained reliabilities for the AASQ compared well to results of other attributional style measures (e.g., Anderson, 1985). For example, Anderson and Riger (1991) reported coefficient alpha reliabilities for the ASAT-IV CDSs that ranged between .56 and .63. Reliabilities of the AASQ scales were also in the range of those reported by McAuley et al. (1992) who found, in four separate studies on the CDS-II (the basis of the AASQ), alpha reliabilities that averaged .67, .80, .68, and .82 for the Locus, Internal Control, Stability, and External Control scales, respectively. As shown in Tables 1 and 2, AASQ items also had an average range of 6.19 scale points in Sample 1 and 6.54 scale points in Sample 2, indicating a good spread of scores.
Correlations, Means, Standard Deviations, Minimum/Maximum Scores, and Coefficient Alpha Reliabilities of the Causal Dimension Scales on the AASQ in Sample 1 (n = 108)

Note: AASQ = Academic Attributional Style Questionnaire. Correlations >.15 and >.22 are significant at p < .05 and p < .01, respectively.
The AASQ causal dimensions are rated on 9-point Likert-type scales, anchored at either end.
Correlations, Means, Standard Deviations, Minimum/Maximum Scores, and Coefficient Alpha Reliabilities of the Causal Dimension Scales on the AASQ in Sample 2 (n = 104)

Note: AASQ = Academic Attributional Style Questionnaire. Correlations >.15 and >.22 are significant at p < .05 and p < .01, respectively.
The AASQ causal dimensions are rated on 9-point Likert-type scales, anchored at either end.
Factor Analyses
In both samples, three factors (and only three) had initial eigenvalues greater than 1, and a clearly identifiable “scree” occurred after three factors. As shown in Table 3, in the analysis of each sample, three factors were extracted that clearly corresponded to the three causal attributional dimensions (“Personal Control,” “External Control,” and “Stability”). Cross-loading of items (e.g., of External Control items on the Stability factor) was negligible. For the Personal Control, External Control, and Stability factors, the average cross-loading of nonfactor items in Sample 1 was −.03, −.18, and .06, respectively, and in Sample 2 was −.08, −.12, and .03, respectively.
Rotated Factor Loadings of Causal Dimension Scale Items on the AASQ in Sample 1 and Sample 2
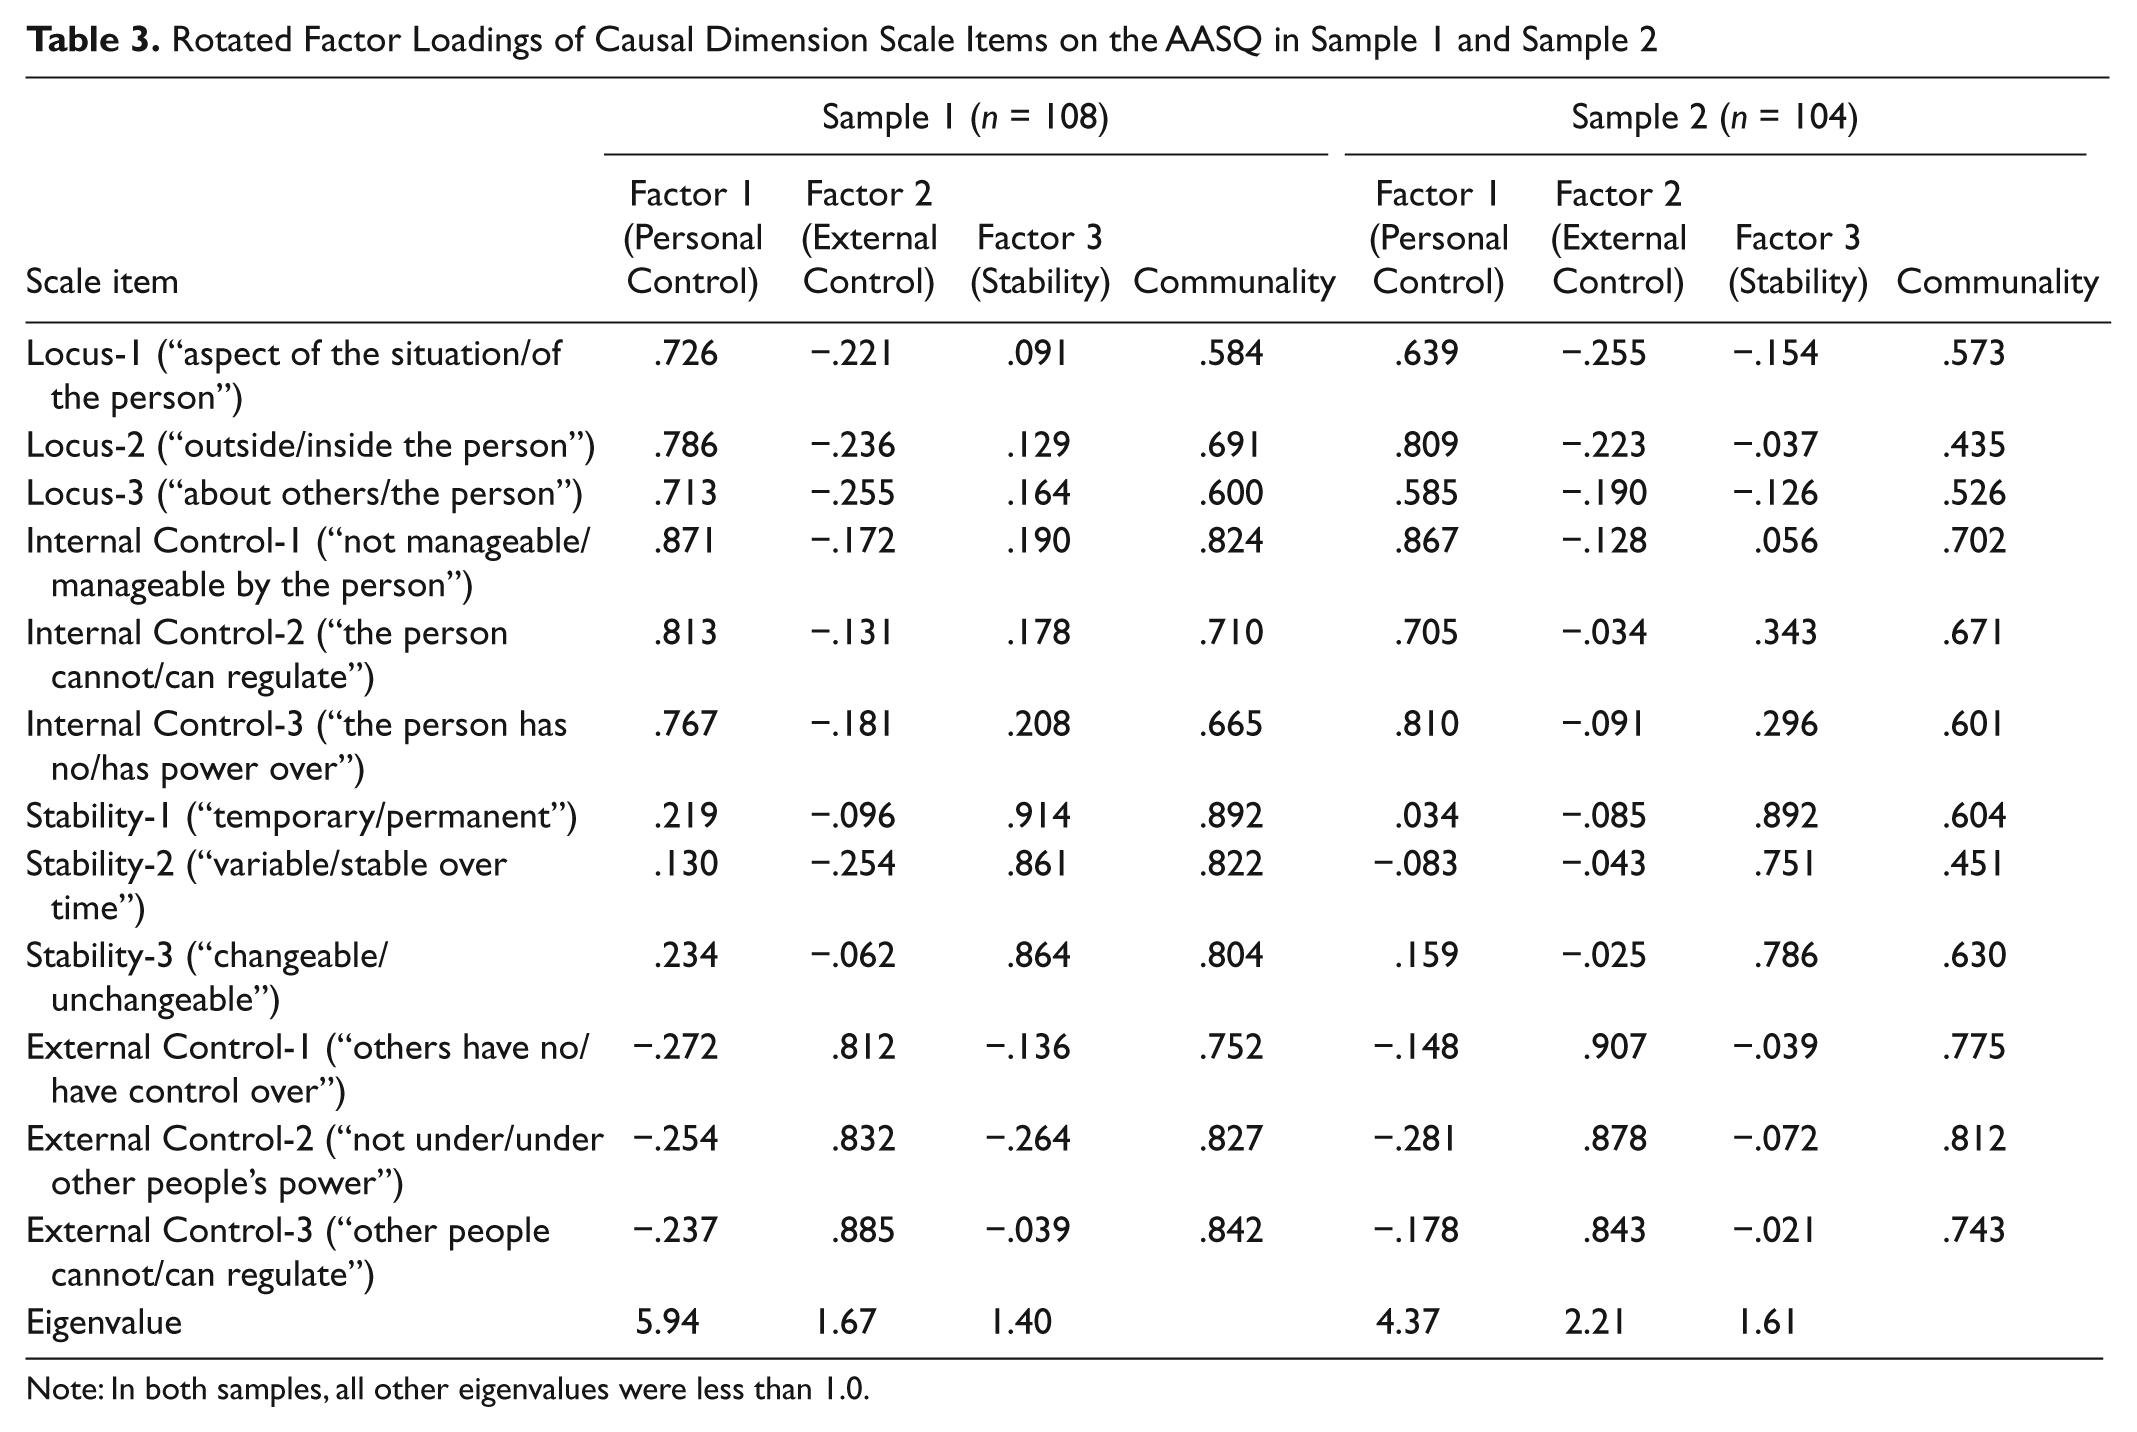
Note: In both samples, all other eigenvalues were less than 1.0.
The factor structure was highly similar in the two samples. In Sample 1, Factors 1 (Personal Control), 2 (External Control), and 3 (Stability) accounted for 33.13%, 21.46%, and 20.52% of the total variance, respectively (75.11% of total variance overall). In Sample 2, Factors 1 (Personal Control), 2 (External Control), and 3 (Stability) accounted for 28.95%, 20.75%, and 18.61% of the total variance, respectively (68.32% of total variance overall). Moreover, and consistent with the negligible cross-loadings, average factor intercorrelations were .16 in Sample 1 and .09 in Sample 2, indicating that the factors were unique. Congruence coefficients (Cattell, 1978) of the factor structure in the two samples ranged from .921 to .982.
Study 2
Significant univariate effects were followed up with t tests when necessary. Measures of effect size (η2 p ) for univariate analyses, and population point biserial correlation (ρpb) coefficients for t tests were examined for all significant effects. Based on the criteria outlined by Kirk (1996), η2 p values of .010, .059, and .138, and ρpb values of .10, .24, and .37 were taken as corresponding to small, medium, and large effect sizes, respectively. The probability of Type I error was maintained at .05 for all analyses.
Mean typing performance, causal beliefs (about typing performance), success expectations, hope, and persistence were examined separately using ANOVA, with attributional style as a grouping factor and time as a repeated-measures factor. Performance and expectations were each measured 4 times, attributions and hope were measured twice (after the first and last typing trial), and behavioral persistence was measured 3 times (free-time periods between trials). Thus, the structure of each repeated-measures ANOVA was determined by the dependent variable. Because internal and internally controllable causes (a combined perception) of failure have a distinct theoretical role in achievement behavior, a combined score (CDS-II Personal Control) was created for each participant by averaging the Locus and Internal Control rating scales on the CDS-II. Means and standard deviations for all of the dependent variables at all measuring points are shown in Table 4.
Means and Standard Deviations (in parentheses) for the Dysfunctional and Functional Academic Attributional Style Groups at all Measuring Points for Each of the Dependent Variables in Study 2

Note: CDS = Causal Dimension Scale–II; GPA = grade point average.
n = 16 in each of the attributional style groups.
Typing performance
Average typing performance per trial (percent correct) was examined using a 2 (Academic Attributional Style: Functional AS, Dysfunctional AS) × 4 (Time: Trial 1, Trial 2, Trial 3, Trial 4) ANOVA, with repeated measures on the last factor. The analysis revealed no main effect for Time or for Attributional Style, and no interaction effect (all Fs < 1.0). As shown in Table 4, typing performance of the two attributional style groups was comparable, and the difficult task ensured no performance improvement over trials in either group. The lack of significant improvement or deterioration in performance over trials in either group indicates that task failure was adequately induced. Notably, on the CDS-II Question 1 (binary choice perception of success or failure on the typing task), 66% of participants indicated their performance on the typing trials was “more like a failure” after Trial 1, and 73% of participants indicated their performance on the typing trials was “more like a failure” after Trial 4. Using Attributional Style as a grouping factor, a chi-square analysis of CDS-II question one indicated that after Trial 1, 81% of Dysfunctional AS participants viewed their performance as a failure, compared with 50% of the Functional AS participants, χ2(1) = 3.46, p = .06. However, after Trial 4, the attributional style groups were comparable in viewing their performance as a failure (75% vs. 70% for the Dysfunctional AS and Functional AS groups, respectively), χ2(1) = .15, p = .69.
Causal beliefs
Perceived personal control and stability scores on the CDS-II were examined separately using a 2 (Academic Attributional Style: Functional AS, Dysfunctional AS) × 2 (Time: Trial 1, Trial 4) ANOVA, with repeated measures on the last factor. The analysis revealed a significant main effect of Attributional Style, for CDS-II Personal Control, F(1, 30) = 6.64, η2 p = .18, p = .015, and for CDS-II Stability, F(1, 30) = 5.45, η2 p = .15, p = .026, and no other effects. Participants with a Functional AS (measured by the AASQ approximately 15 days prior to the typing trials) viewed their typing performance as more personally controllable (M = 7.24, SD = 1.57) and unstable (M = 6.82, SD = 1.38) than participants with a Dysfunctional AS (Personal Control M = 5.91, SD = 1.24; Stability M = 5.59, SD = 1.06).
Expectations of success
Expected success scores were examined using a 2 (Academic Attributional Style: Functional AS, Dysfunctional AS) × 4 (Time: Trial 1, Trial 2, Trial 3, Trial 4) ANOVA, with repeated measures on the last factor. The analysis revealed a significant main effect of Attributional Style, F(1, 30) = 2.62, η2 p = .08, p = .05 (one-tailed), indicating that participants with a Functional AS had higher success expectations overall (M = 23.48, SD = 26.27) than participants with a Dysfunctional AS (M = 11.53, SD = 17.89). The analysis also revealed a significant main effect of Time, F(3, 90) = 18.49, η2 p = .38, p < .01. Participants’ expectation of success was higher after Trial 1 (M = 25.47, SD = 24.86) than Trial 2 (M = 19.56, SD = 23.89), which was higher than after Trial 3 (M = 14.59, SD = 23.32) and Trial 4 (M = 10.40, SD = 19.79). There was no difference between Trials 3 and 4 in expectations of success. The interaction of Attributional Style and Time was not significant (F < 1.0).
Hope
Hopefulness scores were examined using a 2 (Academic Attributional Style: Functional AS, Dysfunctional AS) × 2 (Time: Trial 1, Trial 4) ANOVA, with repeated measures on the last factor. The analysis revealed a significant main effect of Time, F(1, 30) = 12.59, η2 p = .29, p = .001. Participants were less hopeful after Trial 4 (M = 5.03, SD = 1.85) than after Trial 1 (M = 5.91, SD = 1.67). There was no main effect of Attributional Style (F < 1.0), but there was a significant interaction between Attributional Style and Time, F(1, 30) = 7.78, η2 p = .21, p = .009. As shown in Figure 2, the two attributional style groups did not differ in their level of hopefulness after Trial 1 (M = 5.69, SD = 1.70, and M = 6.13, SD = 1.66, for the Functional AS and Dysfunctional AS groups, respectively), t < 1.0. Whereas the Functional AS participants were able to maintain their hopefulness (Trial 4: M = 5.50, SD = 1.31), t < 1.0, those with a Dysfunctional AS were significantly less hopeful by Trial 4 (M = 4.56, SD = 2.20), t(15) = 3.93, ρpb = .58, p = .004. No other differences were significant.
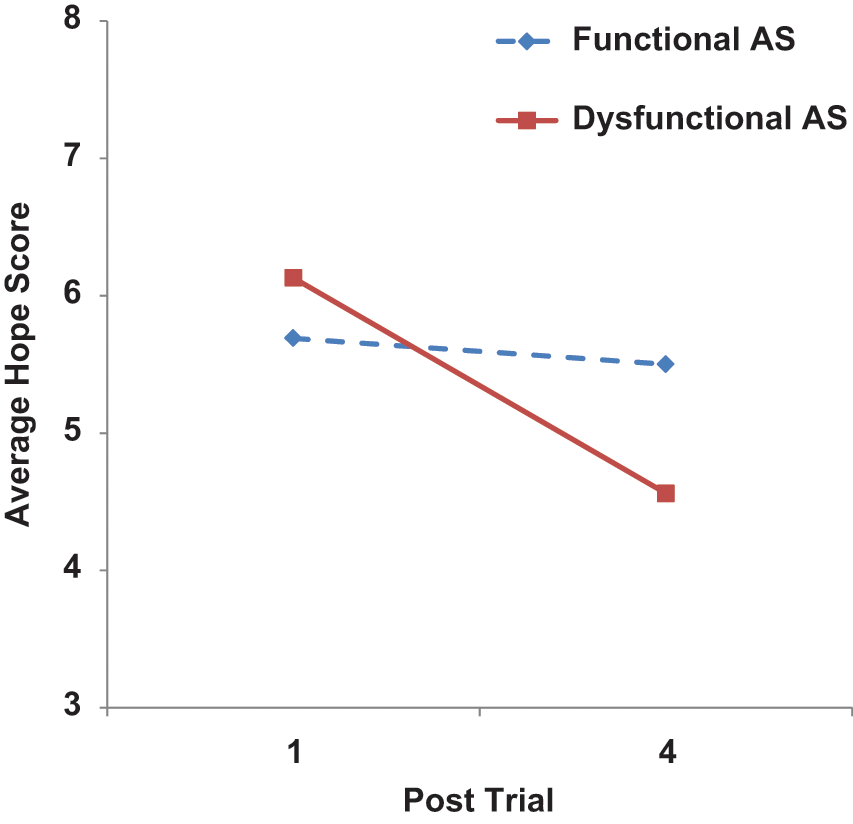
Average Hope score after Trial 1 and after Trial 4 for each of the academic attributional style (AS) groups in Study 2
Persistence
Persistence behavior was examined using a 2 (Academic Attributional Style: Functional AS, Dysfunctional AS) × 3 (Time: Trial 1, Trial 2, Trial 3) ANOVA, with repeated measures on the last factor. The analysis revealed a significant main effect of Attributional Style, F(1, 30) = 11.96, η2 p = .29, p = .002. Participants with a Functional AS practiced more overall (M = 109.9, SD = 101.7) than those with a Dysfunctional AS (M = 25.5, SD = 47.2). There was no main effect of Time (F < 1.0), but there was a significant interaction between Attributional Style and Time, F(1.7, 53.1) = 5.05, η2 p = .14, p = .01. As shown in Figure 3, the interaction was best fit by a quadratic function, F(1, 30) = 7.18, η2 p = .19, p = .012. There was no difference between the two attributional style groups in their level of practice after Trial 1 (Functional AS M = 84.6, SD = 100.1; Dysfunctional AS M = 44.8, SD = 65.0), t(25.7) = 1.33, p = .19. However, compared with Trial 1, the Functional AS participants practiced more after Trial 2 (M = 125.6, SD = 102.4), t(15) = 2.27, ρpb = .38, p = .03, and after Trial 3 (M = 119.4, SD = 102.5), although that difference was not significant, t(15) = 1.48, ρpb = .26, p = .16. In contrast, compared with Trial 1, the Dysfunctional AS participants practiced less after Trial 2 (M = 12.3, SD = 32.1), t(15) = 2.07, ρpb = .34, p = .05, and after Trial 3 (M = 19.4, SD = 44.5), although that difference was not significant, t(15) = 1.46, ρpb = .26, p = .16. Within each attributional style group, differences in practice after Trials 2 and 3 were not significant. However, between the groups, participants with a Functional AS practiced more than those with a Dysfunctional AS after Trial 2, t(15) = 4.22, ρpb = .60, p < .01, and after Trial 3, t(15) = 3.57, ρpb = .53, p < .01.
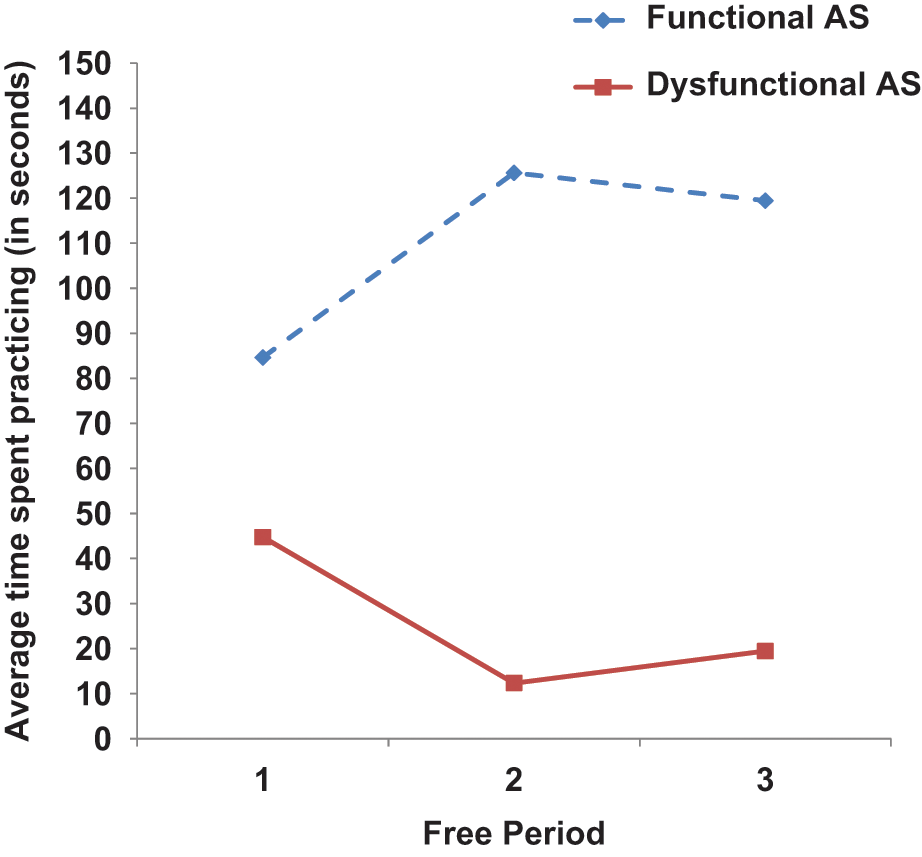
Average time spent practicing (behavioral persistence) per free period (in seconds) by each of the academic attributional style (AS) groups in Study 2
Self-mastery, beliefs about intelligence, end-of-term GPA
Self-mastery, beliefs about intelligence, and end-of-term GPA were first examined using a one-way (Academic Attributional Style: Functional AS, Dysfunctional AS) MANOVA. The analysis revealed a significant multivariate effect of Attributional Style, F(3, 27) = 6.96, η2 p = .43, p = .001, and the individual measures were subsequently examined in a series of univariate analyses. Each univariate analysis revealed a significant effect of Attributional Style. Participants with a Functional AS were higher in self-mastery (M = 4.86, SD = .65) than those with a Dysfunctional AS (M = 4.27, SD = .87), F(1, 30) = 4.64, η2 p = .13, p = .039. The Functional AS participants also held a stronger belief that intelligence is malleable (M = 4.90, SD = .83) compared with participants with a Dysfunctional AS (M = 3.69, SD = .95), F(1, 30) = 14.12, η2 p = .32, p = .001. Moreover, participants with a Functional AS had higher end-of-term GPAs (M = 3.27, SD = .48; maximum GPA is 4.3) than participants with a Dysfunctional AS (M = 2.68, SD = .76), F(1, 31) = 6.81, η2 p = .19, p = .014.
Discussion
Factor Structure of the AASQ
The findings of Study 1 confirm the factor structure of the AASQ. Three attributional dimensions (personal control, external control, stability) emerged as cohesive and distinct factors. In two separate samples, the AASQ showed good scale reliabilities and essentially perfect congruence of the factor structure. AASQ scale reliabilities were comparable with CDS-II scale reliabilities (McAuley et al., 1992), and substantially better than the reliabilities of other attributional style scales, such as those on the ASQ and EASQ (Metalsky et al., 1987). For example, the “Internality” scale on the ASQ and EASQ yielded reliability coefficients of only .33 (Cutrona, Russell, & Jones, 1984) and .46 (Peterson et al., 1982), respectively. Joiner and Metalsky (1999) did not report coefficient alpha reliabilities for the “internality” dimension in a validity study of the EASQ, but the 12 “Internality” items showed an average factor loading of only .40 (range = .22-.56). By comparison, in the present Study 1, reliabilities for the personal control dimension on the AASQ were .90 and .85, for Sample 1 and Sample 2, respectively, and the average factor loadings for that dimension were .78 and .74 for Sample 1 and Sample 2, respectively.
Predictive Validity of the AASQ
Attributional styles shape not only the way we view challenges in the present but also the way we approach challenges in the future. Today’s explanations of successes and failures, linked to our attributional style, lead to success or failure tomorrow (Abramson, Seligman, & Teasdale, 1978; Anderson, 1991; Le Foll et al., 2006; Weiner, 1985). The findings of Study 2 demonstrate the predictive utility of the AASQ. Although individuals with different attributional styles faced the same difficult academic task, they did not respond identically. Two weeks after completing the AASQ, attributional styles were linked to differences in causal beliefs about performance, success expectancies, hopefulness, and behavioral persistence in the typing task. First, dysfunctional and functional attributional styles of explaining hypothetical negative events on the AASQ were consistent with student participants’ explanations of their actual typing performance during failure in the lab approximately 2 weeks later, indicating the short-term stability of academic attributional style. Second, and supporting Weiner’s (1985) attributional model, a Dysfunctional AS predicted lower expectations of success, lower hope, and less behavioral persistence during repeated failure. Indeed, all participants’ expectations of success dropped considerably from Trial 1 to Trial 4, indicating that the prospect of completing another typing task became more daunting over time. However, participants with a Functional AS had higher expectations overall than the Dysfunctional AS group, showing a more optimistic approach to the challenge they faced. Moreover, participants with a Functional AS maintained their hopefulness from Trial 1 to the end of the trials and practiced more during the intertrial “breaks.”
Because there were no significant increases or decreases in performance scores across trials in either group in the present study, differences between the attributional style groups in success expectancies, hopefulness, and persistence cannot be attributed to differences in typing performance but can be traced to differences in the participants’ explanations of their poor typing performance. Those with a Functional AS viewed their typing performance failures as personally controllable and unstable, referring to strategic reasons such as “I wasted time deleting mistakes” and “I have to warm up to type well.” In comparison, participants with a Dysfunctional AS viewed their poor typing performance as more personally uncontrollable and stable, using low-ability explanations such as “I’m not capable of typing that fast” and “I can’t read and type at the same time.” This finding is consistent with previous research indicating that individuals who persist also tend to make functional attributions for their successes and failures (Andrews & Debus, 1978; Di Paula & Campbell, 2002; Le Foll et al., 2006). Because those with a functional attributional style explain failures with personally controllable and unstable causes, they are more apt to believe they can change the outcome of future challenges. The belief that one’s performance can get better encourages the desire to get better, to try harder, and to persist despite adversity. Individuals with a dysfunctional attributional style tend to attribute failure to personally uncontrollable and stable causes and are more inclined to believe that they cannot improve their outcomes despite trying harder. Dysfunctional attributions did not encourage practice/persistence in the face of adversity in Study 2.
Also consistent with previous research was the finding that participants with a Dysfunctional AS had lower end- of-term GPAs, viewed their self-mastery as lower, and tended to hold an “entity” theory of intelligence (i.e., that intelligence is a fixed trait), compared with the Functional AS participants. Mueller and Dweck (1998) also found that those who tend to give up in the face of failure are more likely to be entity theorists. Failing at a task and believing one’s capability to be a “fixed” amount means no amount of practice will improve performance. In addition, because an entity belief in intelligence raises evaluation concerns (Dweck, 1986), the risk of being viewed as “unintelligent” by others (in Study 2, the experimenter) likely influenced the Dysfunctional AS students’ decision to not bother to practice. In the lab study, there were no performance implications of the Dysfunctional AS students’ lack of practice—the typing task was rigged. However, the lower end-of-term GPAs of the Dysfunctional AS students may be a signal that lower persistence during challenge is affecting their academic success. The finding that attributional styles predicted differences in achievement motivation variables, such as persistence, as well as differences in actual achievement (GPA), demonstrates the utility of considering individual differences in causal perceptions in models of achievement motivation.
Conclusion
Individual differences in self-perception are important, as Heider (1958) anticipated. The present findings reveal the potential of individual differences in attributions to affect achievement motivation. Weiner’s (1985) attributional model, with multiple sources of empirical support, clearly delineates the central role of individuals’ causal perceptions of negative achievement outcomes. According to the model, attributing a negative outcome to causes that are personally uncontrollable and stable (such as low ability) reduces expectancies of success and hopefulness, which in turn adversely affects the willingness to keep trying to improve (i.e., persistence behavior). Thus, a tendency to make such attributions (i.e., a Dysfunctional AS) is an individual differences variable that puts individuals at risk in achievement settings. However, despite a good deal of research investigating problematic attributional tendencies in academic settings (e.g., Försterling & Rudolph, 1988; Perry et al., 2008; Peterson & Barrett, 1987; Ruthig et al., 2007), prior to the present investigation, there were no studies confirming the factorial and predictive validity of a measure of dysfunctional academic attributional style. The present findings suggest the AASQ is a valid tool for examining that attributional tendency. In two separate samples in Study 1, individuals’ perceptions of their personal control over, and the stability of reasons for, academic problems comprised factors that were reliable, cohesive, and distinct, indicating that the AASQ is a factorially valid measure of functional and dysfunctional attributional styles. In Study 2, attributional styles measured by the AASQ predicted causal beliefs about actual performance, success expectancies, hopefulness, and behavioral persistence in a difficult academic task, as well as perceptions of self-mastery, the malleability of intelligence, and end-of-term grades. The present findings confirm the presence of Dysfunctional AS as a risk factor in low achievement, thus (a) adding to the overall construct validity of the attributional model (Weiner, 1985), (b) modifying the theory by positing a moderator variable (attributional style), and (c) extending attributional research on at-risk students.
Overall, the present findings support the use of the AASQ to examine the role of Functional AS and Dysfunctional AS in achievement settings. Including a measure of academic attributional style in both basic and applied research on persistence behavior should improve our understanding of, and interventions in, contexts where an individual is at risk of the demotivating effects of repeated failure. Additional research on attributional style and its link to persistence is especially important in the academic domain. Finding ways to help students reach their full academic potential is crucial to battling drop-out rates and underachievement. Moreover, higher persistence and, usually, higher performance, have the potential of changing not only a student’s academic life but also the way they approach the world in general. Modifying a dysfunctional explanatory approach to challenges can help fight depression, feelings of helplessness, low self-esteem, and a general passivity that limits personal achievement (Försterling & Morgenstern, 2002; Peterson & Barrett, 1987; Perry, 2003; Wilson & Linville, 1985; Weiner, 1985). Challenging the belief that causes of failures are personally uncontrollable and stable and developing strategies to be used in the face of failure can completely change one’s approach to life.
Footnotes
Appendix
Acknowledgements
We would like to thank Bernard Weiner for his helpful comments on earlier versions of the manuscript and Margo McGregor for her contributions to the data collection in Study 1.
Declaration of Conflicting Interests
The author(s) declared no potential conflicts of interest with respect to the research, authorship, and/or publication of this article.
Funding
The author(s) received no financial support for the research and/or authorship of this article.