
Abstract
Per capita alcohol consumption, teen drinking, and alcohol-involved traffic fatalities show declines ranging from 16% to 40% since their peaks around 1980. This article examines how beverage prices, the minimum legal drinking age (MLDA), population aging, and teen attitudes contributed to the declines. Two policy variables that have garnered much attention—taxes and the MLDA—appear to have played a minimal role. Alcohol prices declined, which encouraged more drinking rather than less, and large Federal excise tax increases occurred after much of the decline had already taken place. Increases in the legal drinking age account for only a fraction of the declines in teen drinking and traffic fatalities. Changes in the age distribution of the population can account for a substantial fraction of the decline in per capita consumption, but not the decline in teen drinking. Heightened anti-alcohol sentiment among high school seniors has played an important role in the decline in youth drinking. Educational programs and increased penalties/stiffer enforcement of driving under the influence laws probably contributed to the declines, but wide-ranging estimates make a quantitative assessment uncertain. Future research must account for complex social environments.
Introduction
Alcohol abuse continues to be a major social problem in the United States and other countries. The National Epidemiologic Survey on Alcohol and Related Conditions found that 30% of drinkers exceed either the daily or weekly recommended limits (National Institute on Alcohol Abuse and Alcoholism [NIAAA], 2006). Despite laws prohibiting purchase and/or consumption, 44% of 12th graders report having used alcohol in the last 30 days, and 29% report having been drunk (Johnston, O’Malley, Bachman, & Schulenberg, 2012). Almost 40% of traffic fatalities involve alcohol, contributing to alcohol’s role as the third leading cause of preventable deaths in the United States (Center for Disease Control, 2004).
However, per capita alcohol consumption, alcohol involvement in traffic fatalities, and drinking by high school seniors declined significantly in the 1980s. The decline in per capita consumption was partially offset by a rise after the mid-1990s, whereas alcohol involvement in traffic fatalities leveled off and drinking by high school seniors declined further. This article examines selected quantitative evidence on the reasons for these changes. We consider policies such as taxation and the minimum legal drinking age (MLDA), demographics, and perceptions of risk and “disapproval” of heavy drinking among high school students. An understanding of which factors contributed to the declines is important for choosing effective public policies in the future.
Many studies have examined the signs and statistical significance of regression coefficients associated with explanations for alcohol use and abuse, but relatively few have used the results to account for changes over time. To take one example, a very carefully done study by Carpenter, Kloska, O’Malley, and Johnston (2007) found that exposure to a MLDA of 18 is associated with a statistically significant increase in drinking participation among high school seniors of 2.9 percentage points and of heavy drinking of 1.7 percentage points. In the late 1970s—the beginning of the period examined by Carpenter et al.—about 60% of teens were exposed to a MLDA of 18 (Dee, 1999). Thus, increases in the MLDA above 18 can account for reductions of about 1.7 percentage points (= 2.9% × 0.6) in drinking participation and 1.0 percentage points (=1.7% × 0.6) in heavy drinking. 1 The actual reduction in drinking participation was more than 29 percentage points and the reduction in heavy drinking was 16 points (Johnston et al., 2012). Thus, although there is statistically significant evidence that the MLDA reduced teen drinking, the estimates account for only a small portion of the actual reduction that took place.
In contrast to studies focusing primarily on the statistical significance of particular coefficients, this study’s primary objective is to assess the impact of public policies and other factors in relation to the actual historical changes in alcohol use and abuse. That is, we use the signs and magnitudes of estimated coefficients from the literature together with quantitative measures of changes in public policies to infer the magnitudes of changes in use and abuse that can be attributed to various policies.
We find that changes in the legal drinking age and beverage taxation/pricing can account for only a fraction of the actual decline in drinking and traffic fatalities. Indeed, beverage prices generally declined over the last 30 years, which tended to increase rather than decrease consumption. Changes in the age composition of the population—specifically, the decline in the fraction of the population in the peak drinking ages of 18 to 29—help to explain declines in per capita alcohol consumption, but not the sharp decline in teen drinking. Exploratory regressions using aggregate (national) time-series data suggest that attitudinal norms are significantly related to teen drinking behavior. In particular, the decline in teen drinking closely mirrors a rise in perceptions of “great risk” and “disapproval” of having five or more drinks once or twice on the weekend. We conclude that future research on drinking needs to more fully incorporate attitudinal norms and how they are affected by educational programs and other policies.
Changes in Use and Abuse
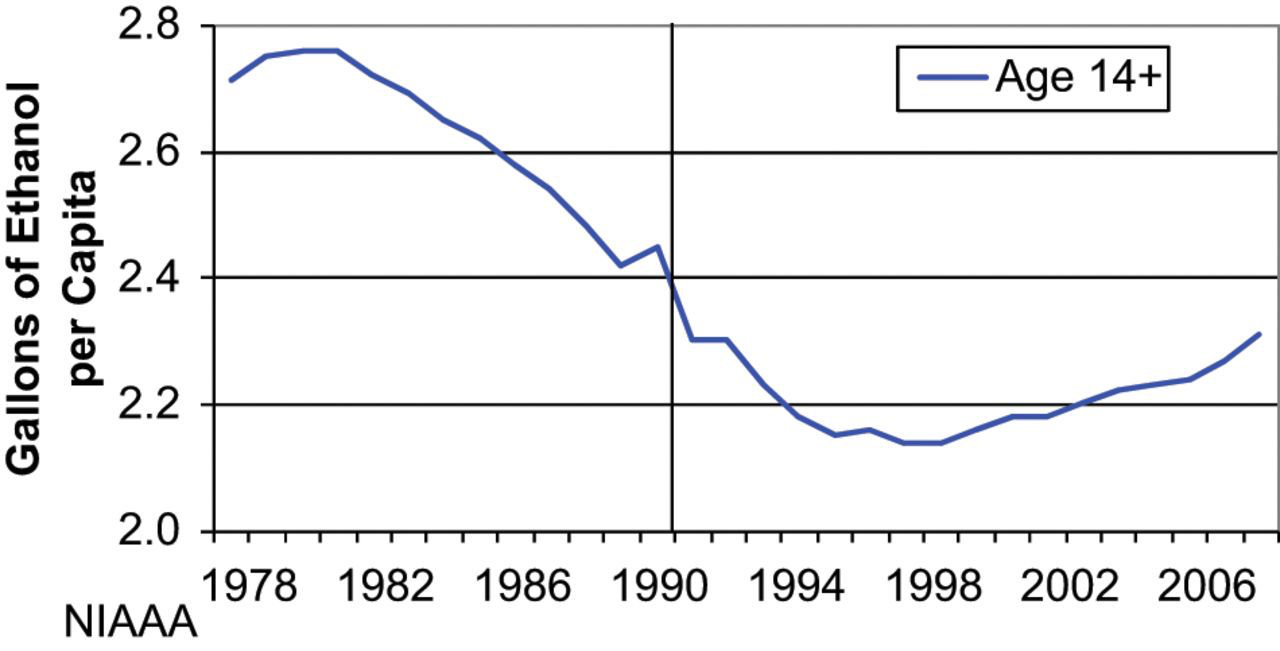
Figure 1 displays per capita consumption of ethanol in the United States from 1978 to 2007. These data are derived from sales of beer, wine, and spirits, and incorporate differences across beverages and changes over time in ethanol content (NIAAA, 2011). 2 Consumption peaked in 1981 at 2.76 gallons of pure ethanol per person aged 14+, declined to 2.14 gallons per person in 1997-1998, and then rebounded to 2.31 gallons per person in 2007. The net decline from 1981 to 2007 was 16%.
Alcohol consumption
Traffic fatality rates and the rate of alcohol-related accidents declined markedly after 1982, the 1st year for which alcohol involvement is reported (NHTSA, 2009). 3 Total fatalities per 100 million vehicle miles traveled declined by 49%, and the alcohol-involved fatality rate declined even more—by 65%. Put another way, the percentage of fatalities that occurred in crashes where at least one driver had a positive blood alcohol count (BAC) declined by about one third, from 55% to 37% (Figure 2).

Alcohol-involved fatality rates
Youth alcohol use also declined substantially (Figure 3; Johnston et al., 2012). Seventy-two percent of 12th graders reported alcohol use in the past 30 days in 1978-1980. Alcohol use fell to 49% by 1993, rebounded slightly during the middle 1990s, and then declined to 44% by 2009. The decline over the entire period was 28 percentage points or 40%. Data on heavy drinking (5+ drinks in a row) in the last 2 weeks show a decline of 16 percentage points or 37%, as does “Daily Use” (not shown in the figure but down 56%).

Alcohol use by 12th graders
Alcohol use is influenced by numerous economic, legal, and social factors, many of which are not amenable to quantitative assessment. Furthermore, no single study simultaneously considers all hypotheses—indeed no single study could conceivably do so. Instead, individual studies tend to focus on one or more economic, legal, or social aspects while at best controlling in some fashion for “other influences.” In addition, some studies are based primarily on cross-sectional data and others rely on time-series data, although each have their own deficiencies. The best studies typically combine cross-sectional and time-series data, and include controls for fixed effects associated with time and cross-sectional units (Ruhm, 1996; Young & Likens, 2000). With these comments in mind, the next sections assess—where possible—the quantitative impacts of several factors that may have affected the trends in alcohol use and abuse described above.
Alcohol Taxes and Prices
One possibility is that increases in the price of alcohol reduced use and abuse. Beginning January 1, 1991, the federal government increased excise taxes on alcoholic beverages. The beer tax doubled from US$9 to US$18 per 31-gallon barrel, wine taxes increased from US$0.17 to US$1.07 per gallon, and spirits taxes increased from US$12.50 to US$13.50 per proof-gallon (U.S. Department of the Treasury, 2009). However, about one half of the decrease in alcohol consumption occurred well before the increase in taxes, indicating that other factors were responsible (Figure 1). In addition, the data suggest that some sales in 1990 might have occurred in anticipation of the tax increases, with a corresponding reduction in sales in 1991. By 1992, alcohol sales appeared to be on roughly the same trend that existed prior to the tax increases. 4
Figure 4 displays the history of beverage prices since 1978. Beer, wine, and spirit prices are obtained from the U.S. Bureau of Labor Statistics (2010) and adjusted for inflation (“real” prices). All taxes directly associated with purchase and use are included in the index. Beverage prices have trended downward over time, with the exception of increases in 1991 associated with federal tax increases. Over the entire 1978-2009 time frame, beer, wine, and spirits prices fell by a total of 14%, 30%, and 31%, respectively. One reason that prices declined was that nominal taxes did not keep up with inflation. For example, Ponicki, Gruenewald, and LaScala (2007) reported that real tax rates fell by two thirds between 1970 and 2003, as inflation more than offset increases in nominal tax rates.
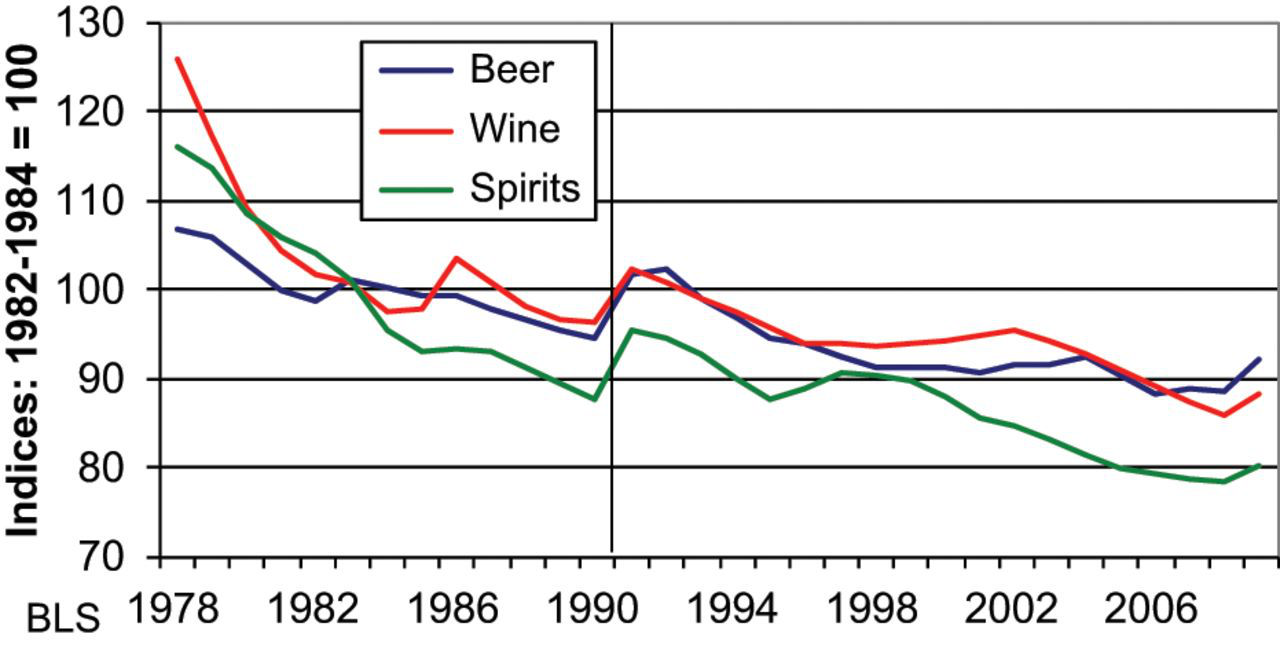
Real alcohol prices
The data in Figure 4 refer to prices for consumption “at home,” as opposed to on-premise consumption (“away”). Prices for on-premise consumption increased an average of 22% during 1978-2009, whereas the Bureau of Labor Statistics (BLS) index of combined “home” and “away” prices fell by 9%. Which of the three indices—home, away, or combined—is most appropriate? The answer depends partly on the particular measure of consumption under consideration. The BLS combined index is based on expenditure shares of approximately 56% on home consumption and 44% on consumption away (U.S. Bureau of Labor Statistics, 2007). As alcohol is much more expensive in on-premise establishments, this suggests that most alcohol is purchased off-premise. However, responses from “place of last drink” studies indicate that about half of the drivers stopped for driving under the influence (DUI) report that they obtained their last drink at a bar or restaurant (Gruenewald, Stockwell, Beel, & Dyskin, 1999; Institute for Public Strategies, 2008; Padilla & Morrissey, 1993). Thus, the combined home and away index may be most appropriate when considering alcohol-related fatalities. Finally, the vast majority of underage drinkers obtain alcohol from other persons rather than from on-premise establishments (Harrison, Fulkerson, & Park, 2000; Wagenaar et al., 1996). Thus, the “home” price index is most appropriate when considering underage drinking. In summary, the most relevant measures are the “home” and combined price indices, and they both showed substantial declines in the last quarter century.
The role of beverage prices has been the subject of numerous studies with sometimes conflicting results. Some studies have found large and statistically significant effects of alcohol taxes and/or prices on consumption and/or traffic fatalities, whereas others have found small, “wrong sign,” and/or statistically insignificant effects, or implausible effects such as a greater impact on fatalities during the day than at night. 5 The claim for a large role by state taxes has been particularly controversial because state taxes typically account for only 3% to 5% of retail prices and change infrequently (Cook & Moore, 2001; Young & Bielinska-Kwapisz, 2002). However, Wagenaar, Salois, and Komro’s (2009) meta-analysis concludes that use and abuse are negatively related to taxes and/or prices.
Thus, the evidence indicates that taxes and/or prices do not explain declining alcohol use and abuse. Instead, falling prices encouraged higher consumption. For example, Wagenaar et al.’s (2009) meta-analysis yields price elasticities for beer, wine, and spirits of −0.46, −0.69, and −0.80, respectively. Given the declines in “home” prices, consumption of beer, wine, and spirits would have been expected to rise by 6.9%, 16.8%, and 20.0%, respectively. Put another way, declining prices for alcohol actually make the historical data more difficult to explain, as the declining prices would have increased rather than decreased alcohol use.
Age Composition
The age composition of the U.S. population underwent substantial change during this time period, with the high-consumption younger age group falling as a percentage of the total population. For example, the percentage of the population aged 18 to 29 declined 4.9 percentage points or 22% from 1978 to 2009 (Figure 5).

Population age 18 to 29
Could this shift in age composition have had a substantial influence on overall alcohol use? The time path of the population in Figure 5 displays a sharp decline followed by a flattening out and slight rise—strikingly similar to the trends in use and abuse in Figures 1 and 2. In addition, a considerable body of evidence demonstrates that there is a clear life cycle pattern to alcohol use in general and heavy drinking in particular (Hilton & Clark, 1987; Levy & Sheflin, 1983; Treno, Parker, & Holder, 1993). Different studies have specified the role of age in various ways, but an example makes the importance of age composition clear. Young and Bielinska-Kwapisz (2003) estimated per capita alcohol consumption across U.S. states in the years 1982-1997. They control for a wide range of factors that may affect alcohol consumption, including alcohol price, income, percentage of population age 18 to 29, percentage of age greater than 65, percentage in “dry” counties, the legal drinking age, religious affiliations, the importance of tourism in the state, and “dummy” variables to control for year- and (in some specifications) state-fixed effects. In other words, the estimates measure the effect of changes in the age distribution, holding other factors constant.
Young and Bielinska-Kwapisz’s (2003) estimates imply that the 4.9 percentage point reduction in population ages 18 to 29 reduced consumption per capita by 6.9% to 15.2%. Actual consumption declined about 16.3%. In other words, the declining share of youth in the U.S. population can account for 42% to 93% of the decline in consumption that actually occurred. Similar results were obtained by Nelson (1997) for consumption in the 1980s. Dang (2008) found that demographic changes, including age and gender makeup of the driving population, explain about half of the decline since 1982 in the share of drivers who have BAC of .08 or above.
Although changes in the age composition of the population appear to be a powerful influence on measures of consumption per person and traffic fatalities, they cannot explain the declines in youth consumption displayed in Figure 3. That is, the declining share of heavy-drinking youth in the population helps to explain why average consumption has fallen, but it does not explain why drinking by youth themselves has also fallen. In addition, data from the Behavioral Risk Factors Surveillance System also suggest that heavy drinking declined among non-youth, reinforcing the idea that more was at work than just an age composition effect (NIAAA, 2003). 6
MLDA
One of the best documented policy influences on youth drinking and traffic fatalities is the MLDA (Carpenter et al., 2007; Wagenaar & Toomey, 2002). Some states lowered the legal drinking age during the early 1970s and then later increased it to 21, in part as a result of pressure from the federal government. The decreases and increases across multiple states at different times provide a “quasi-natural” experiment for analyzing the effects of the MLDA. 7
A quantitative assessment has to be based on specific ways of measuring the MLDA. For example, Dee (1999) analyzed the impact of the MLDA in the period 1977-1992 on the youth drinking measures illustrated in Figure 3. Using Monitoring the Future (MTF) data aggregated into state-year-gender-race-age cells, Dee estimated the impact of the MLDA while controlling for other influences, including state-level beer taxes, family income, parental education, family structure, and state- and year-fixed effects. The estimates indicate that exposure to a MLDA of 18 increased 30-day use by 3 percentage points and heavy drinking (5+ drinks in a row) in the last 2 weeks by 3.5 percentage points. MLDA above 18 were not statistically significant for this sample of high school seniors. Nearly 60% of the MTF respondents were exposed to a MLDA of 18 in 1977; by the late 1980s, every state had a MLDA of 21. Consequently, the increase in the MLDA is estimated to have reduced both measures of teen drinking by about 2 percentage points—slightly more than the estimate from Carpenter et al. 2007 referred to earlier. Recall that 30-day use fell by 28 percentage points, and heavy drinking fell by 16 percentage points. Consequently, increases in the MLDA can account for only about 8% to 15% of the decline in teen drinking.
Numerous studies have also found a statistically significant effect of the MLDA on youth traffic fatalities (Wagenaar & Toomey, 2002). For example, Dee (1999) estimated that a MLDA of 21 rather than 18 reduces fatality rates among 18- to 20-year-olds by 9% to 11%, with most of the effect coming when the age increases from 20 to 21. In 1982, only 14 of the 48 contiguous states had a MLDA of 21, so the subsequent increases to 21 may have reduced fatality rates by 6% to 8%. Young and Bielinska-Kwapisz (2006) estimated a somewhat smaller effect (about 2% for each year increase in the MLDA) among teens aged 16 to 20, perhaps because younger teens are less affected. 8 Between 1982 and 1988, the average MLDA increased by 1.5 years, implying a 3% reduction in the fatality rate. The actual traffic fatality rate for teens aged 16 to 20 declined by about 24%. Thus, using these two estimates as extremes, increases in the MLDA can account for 12% to 33% of the actual decline in teen fatalities.
Changing Perceptions and Norms
Alcohol use and abuse are also related to social norms (Linkenbach, 2006, 2008). Two prominent types of social norms have emerged in the literature: descriptive and injunctive norms (Bosari & Carey, 2003; Larimer & Neighbors, 2003). Descriptive norms measure the prevalence of behaviors, whereas injunctive norms focus on what is commonly approved or disapproved of in a culture (Reno, Cialdini, & Kallgren, 1993). Both types of norms are important and demonstrate impacts on various behaviors, including drinking (Agostinelli, Brown, & Miller, 1995; Schultz, Molan, Cialdini, Goldstein, & Griskevicius, 2007).
Declining use and abuse of alcohol by youth has been accompanied by substantial changes in descriptive and injunctive norms toward episodes of heavy drinking. The percentage of high school seniors who perceive “great risk” in having five or more drinks once or twice on the weekend increased from 35.9% in 1980 to 49.0% in 1992, and remained at 48.0% in 2009 (Figure 6; Johnston et al., 2012). Similarly, the percentage of high school seniors who “disapprove” of people having five or more drinks once or twice on the weekend increased from 55.6% in 1980 to 70.7% in 1992, and remained at 67.6% in 2009. The largest part of these attitudinal changes occurred prior to the 1991 tax increases, and so is unlikely to have resulted from a “signal” associated with the tax hike. However, educational programs in the schools and broader society, for example, the efforts of Mothers Against Drunk Driving, may have contributed to the changes (Eisenberg, 2003).
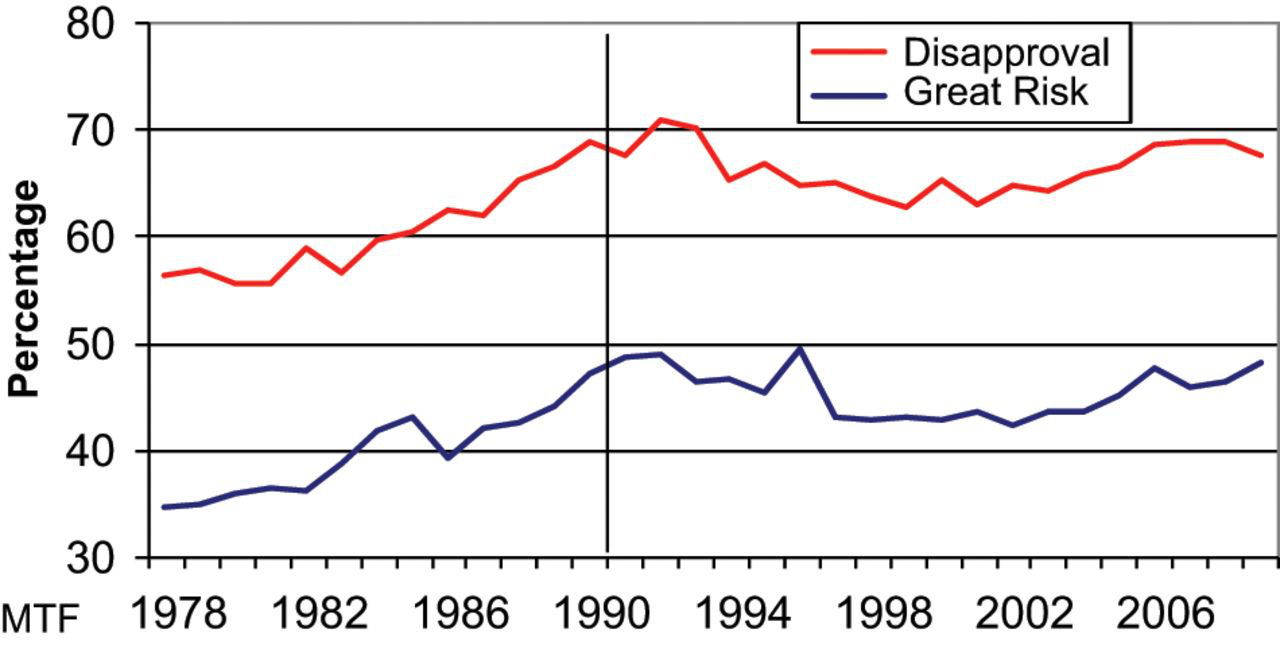
Attitudes toward 5+ drinks
Table 1 displays exploratory regressions relating teen drinking to the norm variables. These results are termed exploratory because they use aggregate (national) time-series data from MTF; pooled data across states and time would be better because controls for state-level policies could be included. However, data containing state identifiers are not immediately available. Nonetheless, the results are quite striking. Perceptions of great risk and disapproval are negatively and statistically significantly related to two measures of alcohol use among high school seniors. As column 1 of Table 1 indicates, a 1-percentage point increase in the fraction of students perceiving great risk is associated with a reduction in 30-day use of about 0.5 percentage point. The corresponding estimate for disapproval is only slightly smaller (column 2). When both measures are included, each remains negative and statistically significant (column 3), even though the correlation between perception of great risk and disapproval is quite high: 0.89. The results for 5+ drinks in a row are quite similar: Estimated coefficients are about −0.5 when great risk and disapproval are entered separately, and each retains its sign and statistical significance when they are entered together (columns 4-6).
Youth Alcohol Use and Norms

Note: MLDA = minimum legal drinking age. Dependent variables are the proportions of high school seniors responding “yes” to 30-day use and 5+ drinks in a row in the last 2 weeks. Estimation method is ordinary least squares (OLS). Absolute values of t-ratios are reported in parentheses. Newey–West standard errors are corrected for serial correlation (lag truncation = 3). Sample period is 1978-2009. See text for detailed definitions of variables.
Changes in norms account for a substantial fraction of the decline in teen drinking. For example, the increase in the percentage of teens perceiving great risk times the coefficient in column 1 of Table 1 yields a predicted decline of 6.0 percentage points in 30-day use, or about 21% of the actual decline of 28.5 percentage points that occurred between 1980 and 2009. Similarly, the increase in disapproval times the coefficient in column 2 of Table 1 yields a predicted decline of 5.4 percentage points or 19% of the actual decline. When the risk and disapproval norms are both included (column 3 of Table 1), the predicted decline is 7.4 percentage points or 26% of the actual decline.
The results are even stronger for heavy drinking. Changes in perceptions account for 5.2 percentage points or 33% of the actual decline of 16 percentage points in heavy drinking (column 4 of Table 1). Increased disapproval (column 5) accounts for 6.2 percentage points or 39% of the actual decline, and when the risk and disapproval norms are both included (column 6 of Table 1), the predicted decline is 7.5 percentage points or 47% of the actual decline.
The regressions also include the price of alcohol as measured by the BLS index of the real price for home consumption, the national average MLDA for beer, and a time trend. The price variable is always negative and significant. The estimated coefficients in the 30-day use equations imply that a 10% increase in alcohol prices would reduce youth participation by about 4 percentage points, or an elasticity of participation with respect to price of about minus 0.72. 9 The actual change in the price of alcohol was a decline in the index of 17.3 points. Thus, the actual change in alcohol prices may have increased 30-day use by 7.3 percentage points, or about 10% from its 1980 value. The estimates indicate that a 10% increase in price would reduce the incidence of heavy drinking by about 2.5 to 3 percentage points, for an elasticity at the means of −0.75 to −0.9. Thus, the actual decline in alcohol prices may have increased heavy drinking by 4.4 to 5.2 percentage points, or 10% to 12% of the 1980 value. The MLDA coefficients are negative, but mostly not statistically significant. The time trend coefficients indicate that participation declined by about 1% per year and occasional heavy drinking by about 1.5% per year, in addition to the trends accounted for by the included variables. 10
Concluding Discussion
This article has documented substantial declines in alcohol use and abuse in the United States since the early 1980s. The declining share of youth in the U.S. population can account for 42% to 93% of the decline in per capita alcohol consumption, but none of the decline in youth drinking. Although alcohol taxes were increased in nominal terms at the federal level and in some states, the increases were more than offset by inflation, and beverage prices fell. Thus, taxes and prices do not help to explain declining use and abuse. Increases in the MLDA can explain 8% to 15% of the decline in teen drinking and 12% to 33% of the decline in teen traffic fatalities. In short, a substantial amount of the declines in use and abuse remains unexplained, particularly for youth. Using national time-series data, we find that teen drinking is significantly related to norms concerning risk of harm and disapproval, and they account for significant fractions of the declines in teen use and abuse.
Factors other than those explicitly considered in this article no doubt also contributed to the decline in alcohol use and abuse. For example, many states took legal action to discourage drunken driving during the 1980s, but the exact features of the laws varied considerably. 11 Some states imposed mandatory minimum jail time for first offense DUI, whereas others increased monetary or driver’s license penalties for first, second, or third offenses. Some states enacted preliminary breath test, dram shop, or administrative per se laws. All states have now adopted a .08 BAC level, and some have adopted server training laws. Some states did a combination of all these. Attempts to specify quantitative measurements of states’ laws rapidly expand the number of explanatory variables, leading to intractable problems of multicollinearity. Estimated coefficients vary widely in sign and significance depending on sample, functional form, and the details of how the policies are measured, making it difficult to draw firm conclusions about the impact of individual laws. For example, Chaloupka, Saffer, and Grossman (1993) and Young and Likens (2000) used similar variables but obtained widely varying results. An alternative approach is to limit the number of laws under consideration. Dang (2008), for example, included just five laws, but they may be correlated with omitted laws with the result that estimates are biased. In addition, many states increased enforcement of DUI laws, making it difficult to determine whether declining use and abuse resulted from changes in the laws or in the probability of being caught and convicted which is seldom measured. Simultaneously, public and private groups increased educational efforts to alert the public to the dangers of drinking and driving, but it has proven difficult to directly measure either the efforts or their effects (Eisenberg, 2003).
Changes in taxes, the law, and its enforcement may themselves reflect more fundamental changes in societal norms that would have decreased drinking even in the absence of legal changes (Mattern & Neighbors, 2004; Young & Likens, 2000). As this article has documented, the data from MTF strongly suggest both substantial changes in norms and a close temporal relationship with alcohol use and abuse. The causality between norms and behavior is not completely clear, however. Norms surely influence behavior, but they may also rationalize existing behavior. For example, teens who engage in heavy drinking may rationalize their behavior by reporting that they do not perceive great risk nor do they disapprove. These relationships between alcohol use and societal norms are worthy of further investigation. One specific project would be to extend the analysis presented here to data pooled across states as well as over time, similar to Bachman, Johnston, and O’Malley’s (1998) analysis of marijuana use.
Footnotes
Notes
Declaration of Conflicting Interests
The author(s) declared no potential conflicts of interest with respect to the research, authorship, and/or publication of this article.
Funding
The author(s) received no financial support for the research and/or authorship of this article.
Bios
![]() .
.