
Abstract
The primary purpose of this study was to characterize bone mineral density (BMD) in healthy adult females in the Southern United States. A secondary purpose was to determine to what extent age, race, body mass index (BMI), and disordered eating contribute to BMD status. Age ranged from 25 to 50 years (39.8 ± 8.5). Race was classified into Caucasian or non-Caucasian. BMI was 28.97 ± 7.85 (kg/m2). The Eating Attitudes Test (EAT-26) was used to identify disordered eating characteristics. The Alara MetriScan was used to assess BMD values. Regression results showed that the linear combination of three independent variables—age, race, and BMI—predicted 34.5% of the variance in BMD, R2 = .345, R2adj = .334, F(3, 170) = 29.87, p < .001. The strongest predictor of low BMD was Caucasian race.
In the United States, approximately 80% of those currently diagnosed with osteoporosis are females and an estimated 55% of those aged 50 either already have osteoporosis or face elevated risk (Pike et al., 2010). Osteoporosis is a disease leading to progressive decreases in bone mineral density (BMD), decreased bone strength, and increased risk of skeletal fractures (Lau et al., 2010). Osteoporosis develops silently and frequently goes undiagnosed until a fracture-related fall or other injury occurs (Chang, Hong, & Yang, 2007).
Osteoporosis and its consequences lead to serious frailty, increased morbidity, and even mortality (Lau et al., 2010). Postmenopausal Caucasian females in the United States are expected to suffer 8.2 million fractures of the hip, spine, or distal forearm during the next decade that will surmount US$60 billion in direct medical expenditures (Tosteson, Burge, Marshall, & Lindsay, 2008). The lifetime risk that a postmenopausal woman will suffer an osteoporotic hip fracture exceeds the total cumulative risk of suffering breast, ovarian, and endometrial cancers (Werner, Olchovsky, Erlich-Gelaki, & Vered, 2003). Consequently, early detection is imperative to help decrease the effects of lowered BMD.
Low BMD is associated with increased odds of having osteopenia and osteoporosis (Winston, Alwazeer, & Bankart, 2008). BMD is measured by T-scores as Normal (0 to >0), Low Normal (−0.99 to <0), Osteopenic (−2.49 to −1.00), or Severe Osteoporotic (<−2.5; Thorpe & Steel, 2008). Peak bone mass is the highest level of BMD reached during life (Karlsson, Nordqvist, & Karlsson, 2008). Research indicates that females develop peak bone mass between 18 and 25 years of age, with 60% to 70% formed by age 20 (Shoepe & Snow, 2005). After the age of 25, BMD can be lost at a rate of 0.5% per year, although the rate of bone loss can increase to as much as 5% per year after menopause (Sundeep & Melton, 2007). Genetic factors, nutrition, hormonal disorders, medications, immobilization, and chronic illness during childhood and adolescence can limit attainment of optimal bone size, quality, mineral content, and density (Huang, Li, Cheung, Song, & Kung, 2008). Among lifestyle factors, proper nutrition and activity are widely recognized as the most important factors for attainment of peak bone mass (Valero et al., 2005).
Bone density is measured by radiographic absorptiometry (RA). The two RA methods commonly used are axial dual energy x-ray absorptiometry (aDEXA) and peripheral dual energy x-ray absorptiometry (pDEXA). pDEXA is available in primary care settings and has distinct advantages over aDEXA. It is less expensive, requires minimal office space, and can be completed in approximately 2 min versus a 30- to 40-min period for aDEXA (Suman, Subbalakshmi, Garnaraja, & Jeganathan, 2010). Furthermore, radiation doses are extremely small and lower than the doses associated with aDEXA (Hans et al., 2008). The benefit of lower radiation and convenience of pDEXA make it an excellent alternative to aDEXA.
The Alara MetriScan is a pDEXA tool used for osteoporotic assessment by primary care physicians. The MetriScan is one the most accurate of the peripheral techniques (Miller et al., 1998). The MetriScan is a tabletop device that uses computed RA to compare BMD of the phalanges (index, middle, and ring finger) on the nondominant hand with values of healthy young females. The MetriScan presents a T-score based on normative data against each participant and then computes their BMD value. This value is then used to categorize the individual’s bone health: Normal (0 to >0), Low Normal (−0.99 to <0), Osteopenic (−2.49 to −1.00), or Severe Osteoporotic (<−2.5; Thorpe & Steel, 2008). Bone density at the phalanges is well correlated with the density of bone at the hip and in the spine (Cantoni & King, 2001). The MetriScan has a sensitivity of 88% and a negative predictive value of 99 (Cantoni & King, 2001). Measurement of BMD in the phalanges of the hand is an excellent predictor of fracture due to osteoporosis in weight-bearing bones, especially the hip (Thorpe & Steel, 2008).
Risk factors for osteoporosis include age, race, body weight, and disordered eating. Females who are older than 50 years of age have a lower BMD than younger females (Suman et al., 2010). Generally, older Caucasian females are considered at high risk for osteoporosis (Looker et al., 2009). The effect of body weight on BMD is less clear. Overweight (body mass index [BMI] 25-29.9 kg/m2) females are thought to be at decreased risk for osteoporosis due to the effects of increased body weight on BMD, but females who are obese (BMI ≥ 30 kg/m2) have been found to have low BMD, compatible with a diagnosis of osteoporosis (Greco et al., 2010). However, in contrast to this, Morin and Leslie (2009) found a consistent, positive association between BMI and BMD, such that as BMI values increased, T-scores also increased. Disordered eating may also influence BMD. Females who show signs and symptoms of disordered eating also may show signs of decreased BMD (Hans et al., 2008). More work is clearly needed to determine what the risk factors are for osteoporosis. Therefore, although the primary purpose of this study was to characterize BMD in healthy adult females in the Southern United States, a secondary purpose was to determine to what extent age, race, BMI, and disordered eating contribute to BMD status.
Method
Approval for this study was granted from the University Institutional Review Board. Exclusion criteria for participation were current pregnancy or diagnosis of cancer. Females who were excluded from the study were provided with an educational packet that covered the benefits of weight-bearing exercise and a list of foods high in vitamin D and calcium.
Participants
A total of 179 community-dwelling females between the ages of 25 and 50 years met the inclusion criteria and were enrolled in this study (Table 1). After completion of informed consent, all participants completed a series of one-time measurements including demographics, disordered eating, and bone density. The principle investigator directly supervised all measurements.
Participant Demographic and Anthropometric Characteristics
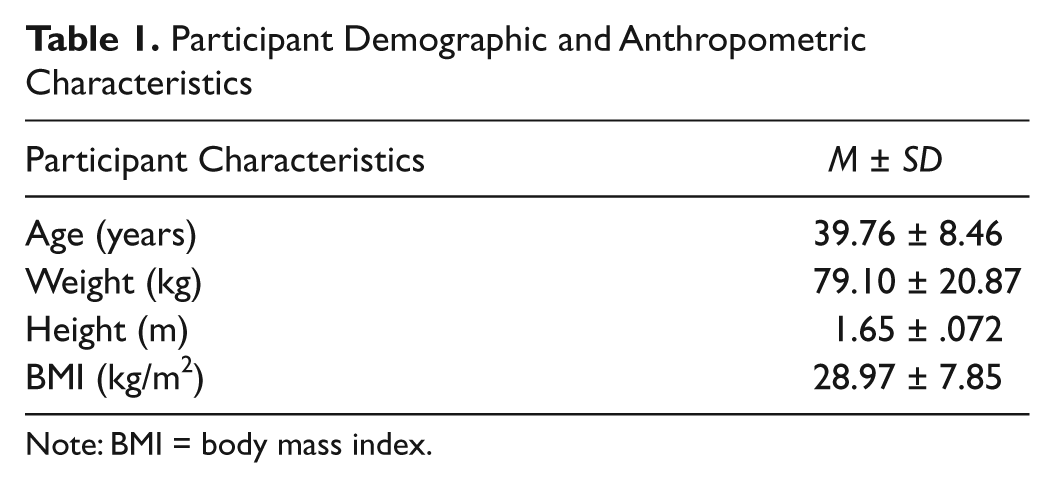
Note: BMI = body mass index.
Demographic Questionnaire
Age, race, height, and body weight were self-reported. Height in feet/inches and weight in pounds were converted to metric values and used to calculate BMI using the following formula:

The Eating Attitudes Test (EAT-26)
Disordered eating characteristics were assessed by the EAT-26. This is a validated, standardized self-report measure of symptoms and concerns characteristic of eating disorders (Garner, Olmsted, Bohr, & Garfinkel, 1982). The EAT-26 is a refinement of the original EAT-40 that was first published in 1979 (Garner et al., 1982). The EAT-26 has been found to be highly reliable and valid with an accuracy rate of at least 90% when used to differentially diagnose those with and without disordered eating patterns (Mintz & O’Halloran, 2000). The EAT-26 has 26 questions with three subscales: (a) Dieting (13 questions), (b) Bulimia and Food Preoccupations (6 questions), and (c) Oral Control (7 questions). Scores can range from 0 to 78. A score of 20 or higher signifies increased personal concerns about body weight, body shape, and eating concerns, and is considered the cut point for risk of disordered eating (Berger, Weitkamp, & Strauss, 2009).
BMD Assessment
The nondominant hand was used for all BMD assessments. Prior to measurement, participants removed all jewelry from their nondominate hand and forearm. Individual participant age, race, height, and weight were entered into the MetriScan, and BMD measurement was completed in approximately 5 s. After completion of the assessment, all participants were provided with a copy of their BMD report, a brief interpretation of their scores, information regarding exercises that promote BMD, foods that provide significant amounts of vitamin D and calcium, and contact information for medical follow-up at their own discretion.
Statistical Analysis
Statistics were calculated with SPSS (version 19.0 for Windows; IBM SPSS Inc., Chicago, Illinois). An alpha level of p < .05 was used to determine significance. Descriptive statistics were used to analyze characteristics of the participants. For purposes of analysis, participants were grouped as Caucasian and non-Caucasian. A regression analysis was used to explore the relationships between BMD and risk factors for osteoporosis (age, race, BMI, and disordered eating).
Results
Participant results are summarized in Table 2. Approximately 80% of participants had normal or low normal bone density (T-scores ≥ −0.99). Significantly decreased BMD was found in the remaining 20% of the participants. EAT-26 scores ranged from 0 to 67. Although the majority of the participants were classified as asymptomatic or free of problematic eating, six participants had a score of 20 and above, indicating a risk for problematic or disordered eating.
The regression model significantly predicted BMD, F(3, 170) = 29.87, p < .001, R2 = .345. The best fit model for predicting BMD was race (Caucasian vs. non-Caucasian), age, and BMI (underweight and normal weight). Caucasian race (t = 8.77, p < .001) was the strongest predicator of low BMD, followed by younger age (t = 2.88, p = .004) and lower BMI (t = 2.256, p = .025). Combined, these variables contributed to 34.5% of the shared variability of BMD in the selected population. EAT-26 scores had no relationship with BMD.
Participant Results for Disordered Eating, Bone Density, and Race

Note: EAT-26 = Eating Attitudes Test; BMD = bone mineral density.
Discussion
To our knowledge, there have been minimal studies to assess BMD in the Southern United States. Consistent with previous research, Caucasian race had the strongest negative influence on BMD (Looker et al., 2009). Although we were unable to discriminate between African American and Hispanic due to the small sample size, we believe that our dichotomous grouping of Caucasian and non-Caucasian females was appropriate for the current analysis.
Our finding that BMD increased with age was a novel one and differs from Looker et al., (2009) who found that BMD declined with age in females between the ages of 20 and 80 years. To our knowledge, no other research with a comparable group of females has identified a protective effect of age. Although it is possible that the younger females in our study may not have achieved peak bone density, this seems unlikely as peak density is believed to occur prior to the age of 25 (Shoepe & Snow, 2005). Instead, our finding may reflect current dietary and activity trends in younger females in the Southern United States. The majority of young females in the third decade of life report inadequate daily intake of milk to support normal bone density (Kalkwarf, Khoury, & Lanpheare, 2003). Furthermore, inadequate levels of vitamin D have specifically been reported in children in the Southern United States (Cole et al., 2010). Without adequate vitamin D and calcium, younger females may be depositing even less bone density than previously reported. Finally, physical activity, especially vigorous activities that promote bone deposition, has been found to decrease dramatically in adolescent girls in the Southern United States (Pate et al., 2007).
Greco et al., (2010) recently reported that overweight (BMI 25-29.9 kg/m2) was neutral or protective for BMD, whereas obesity (BMI > 30 kg/m2) was associated with low BMD. In agreement with their findings, our participants categorized as overweight had higher BMD scores than our participants who were obese by BMI. Recent studies have refuted the previously held belief that obesity exerts a protective effect on BMD (Migliaccio, Greco, Fornari, Donini, & Lenzi, 2011). Although the mechanism behind the negative influence of obesity is probably multifaceted, diet is likely to be involved. Obese women have been found to engage in bouts of dietary restriction that may negatively affect bone density through inadequate intake of calcium and vitamin D (Bacon, Stern, Keim, & Loan, 2004).
We believe that our findings have potential significance for clinical management of females in the Southern United States. Based on our findings, education targeting younger females may be needed, especially to promote deposition of peak bone mass. Furthermore, routine BMD assessment for younger females may be clinically appropriate to capture the losses reflected by our data. The Alara MetriScan represents a noninvasive, relatively low cost assessment strategy that involves little patient or clinician burden. Measurements take less than 1 min and require no clothing adjustment. Routine assessment of BMD in primary care settings using this technology could significantly decrease medical costs to treat osteoporotic fractures later in life.
Limitations
Limitations to this study include self-reported height and weight that were used to calculate BMI. Although self-reported data may be problematic in some cases, we believe our use of this data collection method for height and weight was appropriate. Consistent with our study design, self-reported height and weight have been found to be virtually the same as measured height and weight, resulting in no significant difference in calculation of BMI values (Craig & Adams, 2009; Stommel & Schoenborn, 2009).
Conclusion
In this group of females, BMD was primarily influenced by age, race, and BMI. The protective effect of non-Caucasian race was consistent with other studies and so was not surprising. However, our finding that younger obese women were at greatest risk for loss of BMD was unanticipated. Although more work in this area is undoubtedly needed, our findings support the need for greater clinical attention to BMD assessment of younger females to identify risk prior to significant bone loss.
Footnotes
Acknowledgements
This study was supported by Dr. Ryan C. Moorman, DC, Care Medical in Valdosta, Georgia, and by Donna K. Sledge, Abraham Baldwin Agriculture College.
The author(s) declared no potential conflicts of interest with respect to the research, authorship, and/or publication of this article.
The author(s) received no financial support for the research and/or authorship of this article.