
Abstract
The Dynamic Analog Scale (DAS)—a generic and flexible technique for creating single-item measures of psychological constructs—comprises detailed definitions and a continuous analog scale on which self and others are rated simultaneously. Using five experimental conditions, the authors investigated the psychometric properties of the DAS as well as the impact of different social contexts and modified Big Five trait definitions on participant ratings and their relationships to measures of volunteerism, religiosity, affect, and alcohol consumption. Results revealed few differences across conditions, and reliability coefficients and predictive validity estimates were similar to those typically obtained using standard, multiple-item questionnaires. The DAS is therefore supported as a consistent and efficacious method for measuring personality traits with single items.
Over the past several years, the viability of single-item questionnaires as an alternative to multiple-item questionnaires has become more apparent through the successful measurement of such constructs as job satisfaction (Nagy, 2002), attitudes toward advertisements (Bergkvist & Rossiter, 2007), the Big Five personality traits (Woods & Hampson, 2005), and the self-assessment of pain, fatigue, distress, and anorexia (Butt et al., 2008). These studies, among others (e.g., Barrett & Paltiel, 1996), have shown that single-item measures are an effective alternative to traditional multiple-item measures that also carry with them the benefits of ease and brevity of administration.
Grice, Mignogna, and Badzinsky (2011) recently introduced the Dynamic Analog Scale (DAS) as a flexible and generic technique that is computer administered and can be used to measure individual differences on psychological constructs with a single item. Initial results have shown that the DAS is capable of yielding data with psychometric properties similar to those of multiple-item questionnaires. Figure 1 shows a screenshot of an example DAS for the bipolar construct “agreeable vs. disagreeable” generated by the Idiogrid computer program (Grice, 2002). Instructions on how to rate the individuals are included on the top left of the screen. Participants simply click the names/labels of the individuals to be rated and drag and drop them anywhere along the vertical continuous rating scale. Once a name has been placed on the scale, it can be moved around, placed at the same point on the scale as another individual (e.g., see “Adam” and “Ben” in Figure 1), or removed from the scale if the participant is unsure of where to rate a particular individual (e.g., see “Sara” in Figure 1). This particular scale is anchored by the terms “The Most Extreme A-1 Person Imaginable” to “The Most Extreme 1-A Person Imaginable,” which have been created and defined by the researcher.

Example Dynamic Analog Scale for the agreeable versus disagreeable trait
The definitions for the anchors of the DAS, located on the left side of the screen (below the instructions), are written by the researcher based on theory. In this example, the anchors for the Big Five traits are generic labels (e.g., A-1 vs. 1-A for agreeable vs. disagreeable), intended to reduce the likelihood of respondents relying on their own idiosyncratic definitions of the trait terms. The individuals to be rated are either elicited from the participant to fit a particular role description or included in the list by the researcher. These can include anyone of interest, such as individuals from the respondent’s life (e.g., friend, significant other, relatives), various selves (e.g., actual self, ideal self), reference individuals (e.g., the typical college student), or other figures (e.g., public figures, fictional characters).
Beyond traditional analog or multipoint scales, the DAS contains several characteristics that serve as extensions of recent research on single-item measures. First, using the DAS, respondents rate multiple people simultaneously and can move people around during the rating process, creating a “social network” for the respondent to rate himself or herself within (Denissen, Geenen, Selfhout, & Van Aken, 2008). In addition, the researcher clearly defines each pole of the construct and provides these definitions to the respondent as the basis for which the bipolar construct should be understood (Woods & Hampson, 2005). Moreover, each pole of the construct is anchored by extreme terms, so as to reduce the likelihood of individual differences in how the scale endpoints are interpreted (Bartoshuk et al., 2002).
In an initial study of the validity of the DAS, Grice et al. (2011) found that the DAS was just as efficacious as a standard multiple-item questionnaire measuring the same personality traits in predicting behavioral acts, self-esteem, general affect, and religiosity. Moreover, they reported favorable immediate and approximate 2-week test–retest reliability coefficients for the DAS.
In the current study, we more thoroughly evaluated the properties of the DAS as a single-item technique for measuring individual differences using the Big Five personality traits. In addition to examining the immediate test–retest reliability of the DAS, we also examined its predictive validity regarding a number of well-known consequential outcomes related to human personality. The particular criteria (volunteerism, religiosity, affect, and drinking behaviors) were chosen from a recent review article (see Ozer & Benet-Martínez, 2006) that showed how well the Big Five personality traits predicted a variety of consequential outcomes. Moreover, using a complex study design, we examined the potential influence of (a) modifying the social context component in the rating process and (b) modifying the descriptive trait definitions used by Grice et al. (2011) to reduce the social desirability of the trait poles.
Method
Participants
A total of 250 undergraduate students volunteered to participate in exchange for course credit. Complete data were obtained for 238 participants, 1 among whom 149 were female (62.6%) and 89 were male (37.4%). Of this group, 201 reported their ethnicity as White (84.5%), 11 were Native American (4.6%), 8 were African American (3.4%), 6 were Asian (2.5%), 2 were Hispanic (0.8%), and 10 indicated “other” (4.2%). Ages ranged from 18 to 36 (M = 19.34, SD = 2.09).
Materials
Big Five bipolar trait descriptions
Determined by the group to which participants were assigned, they received one of two versions of the Big Five bipolar trait descriptions (the OCEAN or the ABCDE) when completing the DAS.
The OCEAN is the set of original descriptions used by Grice et al. (2011) to define each pole of the Big Five traits (i.e., Open-Minded/Close-Minded, Conscientious/Unconscientious, Extraverted/Introverted, Agreeable/Disagreeable, and Emotionally Stable/Emotionally Unstable). These descriptions were slightly modified in this study, however, by concealing the trait names using a generic label consisting of a capital letter either preceded or followed by the number “1.” This change was made to reduce the desirability of either pole as a result of individuals’ prior knowledge of the Big Five trait names. The descriptions were also modified to be more gender neutral to reduce the influence of gender stereotyping. With these changes in mind, Extraversion (E-1), for example, was described in distinction to Introversion (1-E) as,
An E-1 person is someone who tends to direct his or her energy toward the external world rather than to the inner world of ideas. Consequently, when presented with a new situation or unfamiliar activity, E-1s tend to jump right in without much hesitation. For instance, an E-1 attending a Yoga class for the first time with a friend would not hesitate to join in the exercises, or an E-1 visiting a sports bar for the first time would not feel uncomfortable in such a novel setting. E-1s, thus, tend to be seen as energetic and tend to seek out activities that involve other people. They also tend to be talkative, even in large groups of people, and they can sometimes appear to be aggressive when interacting with other people, even strangers.
The ABCDE is similar to the OCEAN, except that the generic labels were made more ambiguous to reduce the likelihood that the traits could be guessed from the familiar OCEAN acronym. Instead, the letters A, B, C, D, and E replaced O, C, E, A, and N, respectively (i.e., A instead of O, B instead of C, C instead of E, etc.). Moreover, the descriptions were modified to further neutralize the traits by explicitly adding strengths and weaknesses to each pole. For example, the Extraversion description was modified to read as follows:
A C-1 person is someone who tends to direct his or her energy toward the external world rather than to the inner world of ideas. Consequently, when presented with a new situation or unfamiliar activity, C-1s tend to jump right in without much hesitation. For instance, a C-1 attending a Yoga class for the first time with a friend would not hesitate to join in the exercises, or a C-1 visiting a sports bar for the first time would not feel uncomfortable in such a novel setting. C-1s, thus, tend to be seen as energetic and tend to seek out activities that involve other people. C-1s’ strengths are that they tend to be relaxed in novel situations and they can have large social networks. With regard to weaknesses, C-1s may be too greatly influenced by their surroundings, and they tend to develop fewer truly intimate relationships.
Similarly, the Introversion description (1-C) included strengths and weaknesses.
DAS
The DAS was administered using Idiogrid Version 2.4 (Grice, 2002). To complete the DAS, participants simultaneously rated individuals on a scale ranging from −200 to +200 (see Figure 1). The scale, consisting of 401 pixels of resolution, thus represented a quasi-continuous scale. Participants completed five scales anchored by the Big Five trait poles. For example, one scale asked the participant to simultaneously rate individuals on a continuous scale ranging from 1-C (Introversion) to C-1 (Extraversion). All participants (simultaneously) rated their actual self, and, depending on the experimental group to which they were assigned, may have rated their ideal self and 10 other individuals whom they named (see below). The descriptions they were provided on the Big Five bipolar trait descriptions (i.e., OCEAN or ABCDE) were typed next to the respective scale to serve as a reminder of what the generic labels stood for. Ratings were stored in a two-dimensional matrix for analysis.
Volunteerism Questionnaire (VQ)
The VQ consists of three yes-or-no items that ask participants if they have ever volunteered in the past, if they are currently volunteering, and if they plan to volunteer in the future. For each question that is answered with a “yes,” participants are asked to list each volunteering activity, approximate dates, and how they got involved. This questionnaire was adapted from Carlo, Okun, Knight, and de Guzman (2005). For the current study, only the quantity of volunteer activities per question was analyzed.
Religious Orientation Scale (ROS)
The ROS (Allport & Ross, 1967) consists of 21 items regarding religious beliefs and practices. Participants indicate the degree to which they agree with each item using a 5-point Likert-type scale (ranging from “strongly disagree” to “strongly agree”). Internal Religiosity and External Religiosity scores are computed, ranging from 9 to 45 and 12 to 60, respectively, both of which have been reported to have adequate psychometric properties for research (Hill & Hood, 1999). For the current study, average scores were computed for each of the subscales as a means of dealing with missing data (<1% missing). In addition, one item was dropped from the analyses due to a typographical error that rendered the item ambiguous.
Positive Affect Negative Affect Schedule (PANAS)
On the PANAS, participants use a 5-point Likert-type scale (ranging from “very slightly or not at all” to “extremely”) to indicate how they feel day to day (e.g., “distressed,” “excited,” “enthusiastic,” “irritable”). Positive and Negative Affect scores are computed, ranging from 10 to 50. The PANAS has been reported to yield highly reliable and highly valid data (Watson, Clark, & Tellegen, 1988). For the current study, average scores were computed for each of the subscales as a means of dealing with missing data (<1% missing).
Daily Drinking Questionnaire (DDQ)
The DDQ (Dimeff, Baer, Kivlahan & Marlatt, 1999) asks participants to self-report the number of alcoholic drinks they consume and the number of hours within which the drinks are consumed each day during a typical week. Participants also self-report on their age, gender, weight, height, type of housing, fraternity/sorority involvement, employment, and university enrollment. The DDQ was adapted from the Drinking Practices Questionnaire (Cahalan, Cisin, & Crossley, 1969), with which it correlates moderately.
Drinking Frequency-Quantity Questionnaire (DFQQ)
The DFQQ (Dimeff et al., 1999) is a three-item, multiple-choice questionnaire that asks about drinking behaviors during a typical month. For example, ranging from 1 = no drinks to 11 = 19 or more, participants are asked to report the most alcohol consumed on one occasion over the past month and how many drinks they typically consume on the weekend. Ranging from 1 = I do not drink to 6 = once a day or more, participants are asked to report how often they drank during the previous month.
Procedure
Participants were randomly assigned to one of five groups: OCEAN-10 (19 males, 24 females), Ideal OCEAN-10 (17 males, 33 females), Ideal ABCDE-10 (17 males, 30 females), Ideal ABCDE (17 males, 33 females), or ABCDE (19 males, 29 females). Table 1 summarizes the groups. All participants rated their actual selves using their respective set of Big Five trait definitions (i.e., the OCEAN or the ABCDE). Participants in the Ideal OCEAN-10 and OCEAN-10 groups both received the OCEAN Big Five trait definitions, whereas those in the Ideal ABCDE-10, Ideal ABCDE, and ABCDE groups received the ABCDE trait definitions. With regard to the other rated targets, participants in the Ideal OCEAN-10, Ideal ABCDE-10, and Ideal ABCDE groups rated their ideal selves, and participants in the Ideal OCEAN-10, OCEAN-10, and Ideal ABCDE-10 groups named 10 additional people to be rated.
Summary of the Dynamic Analog Scale Groups

For those groups who were asked to rate 10 additional people (see Table 1), participants were asked to write the first name or role title (e.g., “mom” or “coach”) of one individual whom they know personally who fits the description of each pole of the trait definitions (i.e., 10 total). Also, they were asked to write a brief description as to why the elicited individual fits that particular description (e.g., “He can’t stand being alone” or “She loves being the center of attention” for an extraverted person). Each of the elicited individuals served as a “marker person” (see Grice, Jackson, & McDaniel, 2006) for each pole of the Big Five traits and also provided researchers the opportunity to ensure the participants truly understood the descriptions.
Participants worked in small groups of up to four individuals at computer stations separated by divider panels. Participants received individual instructions from the researcher, could work at their own pace, and were blind to the other conditions. On arrival, all participants filled out basic demographic information and were then given the Big Five bipolar trait descriptions for their respective group (i.e., Ideal OCEAN-10 and OCEAN-10 participants were given the OCEAN; Ideal ABCDE-10, Ideal ABCDE, and ABCDE participants were given the ABCDE). Participants were given as much time as they needed to thoroughly read through each description. During this time, participants in those groups asked to rate 10 additional people elicited the names of these “marker people” for each trait pole. Next, participants watched a short video demonstrating how to rate individuals using the DAS. After completing the DAS, participants filled out the remaining inventories (including the VQ, ROS, PANAS, DDQ, and the DFQQ). Finally, participants completed the DAS a second time, rating the same individuals on the same five constructs as they had previously.
Results
Consistency of the DAS
The participants’ self-ratings were consistent across the two administrations of the DAS, with all Pearson product–moment correlation coefficients greater than .70 (Median = .83). Table 2 summarizes the correlation coefficients for each of the five groups (Ideal OCEAN-10, OCEAN-10, etc.). Overall consistency of each participant’s responses between the first and second administrations of the DAS could also be computed using Slater’s General Degree of Correlation 2 (see Grice, 2002) because each participant rated the same individuals on the same constructs for both grids in all but the ABCDE group. The obtained correlation for each participant typically ranges in value from 0 to 1 (although in rare cases the observed value can fall outside of this range), with higher values indicating higher levels of overall consistency between the two grids. Median correlations for each group indicated high levels of overall consistency in participants’ ratings. Specifically, a median correlation of .87 was found for individuals in the Ideal OCEAN-10 group (minimum = 0.26, maximum = 0.95, M = 0.82, SD = 0.12); .87 for the OCEAN-10 group (minimum = −0.06, maximum = 0.97, M = 0.79, SD = 0.22); .81 for the Ideal ABCDE-10 group (minimum = 0.06, maximum = 0.94, M = 0.76, SD = 0.18); and .80 for the Ideal ABCDE group (minimum = 0.15, maximum = 1.00, M = 0.76, SD = 0.24). 3 Given the high degree of consistency between the two administrations of the DAS (between the self-ratings in particular as well as the grids overall) and the similar direction and magnitude of results obtained from using either set of ratings, only the ratings from the first DAS administration will be reported in the subsequent analyses.
Pearson Correlations for Actual Self Ratings Across the Two Administration of the Dynamic Analog Scale by Group
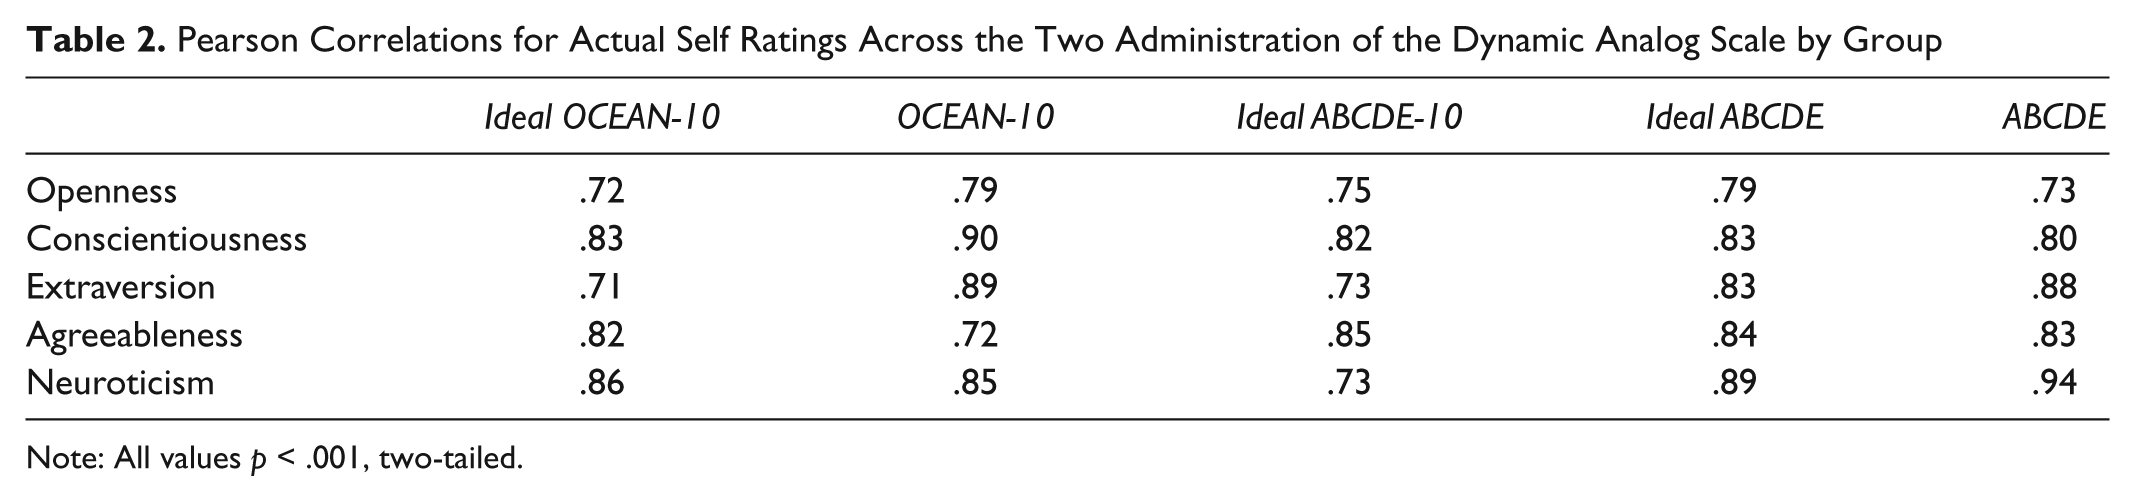
Note: All values p < .001, two-tailed.
Comparisons Between Groups
The current study sought to investigate whether modifying (a) the trait definitions used in the DAS and (b) the number of people simultaneously rated by the participants would influence the ratings of their actual self in any way. The mean actual self ratings from each of the five conditions were compared using one-way ANOVAs on each of the Big Five personality traits. The results indicated that, across the five conditions, the participants’ self-ratings did not differ significantly from one another on any of the Big Five traits (all Fs < 2.39, ps > .05, η2 < .04), other than neuroticism, F(4233) = 4.12, p = .003, η2 = .07. Table 3 reports descriptive statistics for the actual self ratings for each trait by group. For neuroticism (bolded in Table 3), results from Tukey’s HSD post hoc analysis revealed that those individuals who read the modified trait definitions (including strengths and weaknesses) and who also rated their ideal self and 10 other individuals (i.e., those individuals in the Ideal ABCDE-10 condition) rated their actual self as more emotionally unstable than those individuals who read the original trait definitions (i.e., conditions Ideal OCEAN-10 and OCEAN-10). 4
Descriptive Statistics for Actual Self Ratings on the Dynamic Analog Scale by Group

Note: Scale range: -200 to +200.
Regression Analyses
Multiple regression analyses were conducted to test the unique predictive capacity of the Big Five traits using the external criteria (volunteerism, religiosity, affect, and drinking behaviors) as the dependant variables. 5 Because a major aim of the current research was to investigate any differences that may arise as a result of the five groups, each of the models was evaluated for each group separately. To determine whether significant differences existed between the groups, the obtained Multiple R values were subjected to Fisher’s well-known formula for comparing two independent correlations. 6 Beyond merely noting the statistical significance of these comparisons, what is truly of interest here is the magnitude discrepancies of each pair of R2 values. Each group’s Multiple R2 values and β weights (for each of the Big Five traits) are reported in Table 4 for each of the models. Each model was evaluated for violations of statistical assumptions, and examination of the residuals revealed no anomalies.
Regression Analyses Predicting External Criteria From the Big Five DAS Constructs

Note: DAS = Dynamic Analog Scale. Rows designated as O, C, E, A, and N are β weights for openness to experience, conscientiousness, extraversion, agreeableness, and neuroticism, respectively.
Due to missing data, sample sizes are equal to those reported above, except one less for Ideal ABCDE when predicting positive and negative affect, drinks per week, and most drinks; two less for Ideal ABCDE when predicting weekend drinks; and one less for Ideal ABCDE-10 when predicting drinks per week.
p < .05. **p < .01, two-tailed.
Past volunteerism was significantly predicted (R2 = .236, p = .032) by extraversion (β = .407, p = .005) in the Ideal OCEAN-10 group. However, although the model was only significant for the Ideal OCEAN-10 group (all other R2s < .188, p > .05), there were no significant differences between the Multiple R values for any of the five groups (all zs < 1.14). In predicting current volunteerism, the multiple regression model was not significant for any of the five groups (R2s < .127, p > .05), and there were no differences between the Multiple R values for any of the five groups (all zs < 1.11). Similarly, planned future volunteerism was not predicted significantly in any of the groups (R2s < .203, p > .05), and there were no differences in the Multiple R values between any of the groups (all zs < 1.37).
The model for internal religiosity was not significant for any of the five groups (R2s < .211, p > .05), and there were no differences in the Multiple R values (all zs < 0.73). Results for external religiosity were significant for the ABCDE group (R2 = .275, p = .016), with conscientiousness being the only significant predictor (β = .380, p = .007). Again, there were no group differences in the Multiple R values (all zs < 1.53).
With regard to the two affectivity scales, positive affect was significantly predicted (R2 = .240, p = .035) by conscientiousness (β = .325, p = .021) and neuroticism (β = −.339, p = .018) in the ABCDE group. Positive affect was also significantly predicted (R2 = .377, p = .003) by conscientiousness (β = .406, p = .004) and extraversion (β = .348, p = .016) in the OCEAN-10 group. Moreover, a significantly greater amount of variance was accounted for in the OCEAN-10 (R2 = .377, p = .003) than in the Ideal OCEAN-10 group (R2 = .073, p = .633), z = 2.04, p = .04 (all other zs < 1.85). Negative affect was significantly predicted (R2 = .349, p = .006) by agreeableness (β = −.379, p = .008) and neuroticism (β = .418, p = .004) in the OCEAN-10 group; yet, there were no significant differences in the Multiple R values for the five groups (all zs < 1.35).
The estimated number of drinks consumed in a typical week was not significantly predicted for any of the five groups (R2s < .140, ps > .05). The model for the estimated number of drinks consumed on the typical weekend was also not significantly predicted for any of the five groups (R2s < .203, ps > .05). Likewise, the model for the highest number of drinks consumed in the past month was not significant for any of the five groups (R2s < .193, ps > .05). Moreover, the analyses for the three drinking behavior–dependent variables yielded Multiple R values that were not significantly different between any of the five groups (all zs < 1.38).
The pattern of predictive values across groups was examined by comparing each group’s R2 values for each of the 10 external criteria to the 10 R2 values in each other group (e.g., the R2 values for Ideal OCEAN-10 were compared with the R2 values for OCEAN-10) using the Gower similarity coefficient (Barrett, 2010b)—a coefficient that indicates the magnitude of similarity between pairs of observations. From the Gower coefficient matrix in Table 5, it can be seen that the five conditions yielded highly similar R2 values, with a mean similarity of 92% between the pairs of observations (SD = 0.01, Median = .92, minimum = 0.90, maximum = 0.94). Furthermore, bootstrapping (Barrett, 2010a), generating 10,000 Gower coefficients, revealed that obtaining a Gower coefficient equal to or greater than the lowest observed Gower coefficient (.90) was highly unlikely to occur by chance alone (p < .001).
Gower Similarity Coefficients for R2 Values by Group

Note: All values p < .001, two-tailed.
Discussion
The results from this study support the use of the DAS as a means for measuring individual differences in personality traits with a single item. Participants were highly consistent between the first and second administrations of the DAS in terms of their actual self ratings and their grids overall. Moreover, participants who were asked to rate 10 additional individuals consistently rated these “marker people” (see Grice et al., 2006) on the appropriate trait pole for which they were elicited (95.78% of the time for Ideal OCEAN-10, 94.35% for OCEAN-10, and 93.81% for Ideal ABCDE-10). Furthermore, the standard deviations were large enough to show that participants were using the full length of the scale range, showing some variability in their ratings between themselves as well as the other individuals that were rated. All this suggests that the participants understood the procedures and were able to complete them appropriately, with ease and in a timely manner.
Furthermore, a primary aim of the current study was to address (a) the impact of rating only oneself versus oneself along with other individuals (by varying the social network of the five groups) and (b) the issue of social desirability that is often present in rating oneself on the Big Five traits, a notion that is supported by Bäckström’s (2007) recent higher-order factor analysis of the Big Five factors. The modified definitions were designed to include strengths and weaknesses (i.e., adaptive and maladaptive qualities) of both poles of each trait, so as to neutralize them to a degree and reduce the social desirability in rating oneself on one pole over the other.
Statistical analyses revealed that, across the five conditions, the mean rating of participants’ actual selves were not significantly different from one another for any of the Big Five traits, except for neuroticism. For neuroticism, those participants in the Ideal ABCDE-10 group tended to rate themselves as significantly more emotionally unstable than those individuals in the Ideal OCEAN-10 and the OCEAN-10 groups, but not significantly different from the Ideal ABCDE and ABCDE groups. Interestingly, all three conditions with the modified trait definitions had a positive mean neuroticism score, whereas the two conditions with the original trait definitions had mean neuroticism scores in the opposite direction (i.e., negative). This unusual finding was replicated in another sample of individuals using the modified trait definitions. These findings suggest that, at least for neuroticism, adding strengths and weaknesses to each pole (i.e., emotional stability and emotional instability) may have had the desired effect of reducing the social desirability of rating oneself as emotionally stable. Of less importance was the social context within which participants rated themselves. In other words, the finding appears to be linked more so to the trait definitions they were given, rather than to whether they were asked to rate their ideal self or other individuals in addition to their actual self. One avenue for future research would be to investigate this finding further with neuroticism as well as the other traits to potentially reduce the influence of social desirability of a particular pole on participants’ responses.
As evaluating the predictive validity of single-item measures is an essential step in assessing their efficacy (Burisch, 1997), multiple regression analyses were conducted for each group. Although the regression models were arguably underpowered and most were nonsignificant, the primary interest in these analyses was not the statistical significance of the models. Rather, the discrepancies of the R2 values between the five groups were the primary concern here. With one exception, there were no differences between the five groups in how well the outcomes (volunteerism, religiosity, affect, and drinking behavior) were predicted; and the Gower coefficients indicated that the R2 values were highly consistent across the five groups. These results suggest that, on the whole, modifying the trait definitions by adding strengths and weaknesses and modifying the social network within which participants rated their actual selves did not significantly affect how the consequential outcomes were predicted.
Furthermore, the DAS yielded results comparable with those typically obtained by studies that use more traditional multiple-item measures of the Big Five (such as the BFQ and NEO) in predicting such consequential outcomes as past volunteerism, external religiosity, and positive and negative affect (see Ozer & Benet-Martínez, 2006). For example, in their meta-analysis examining personality as a correlate of subjective well-being, DeNeve and Cooper (1998) found that negative affect correlates .05 with openness to experience, −.10 with conscientiousness, −.07 with extraversion, −.13 with agreeableness, and .23 with neuroticism. Results from the DAS, across the five groups, similarly showed that negative affect correlates −.01 with openness to experience, −.10 with conscientiousness, −.14 with extraversion, −.13 with agreeableness, and .28 with neuroticism. The magnitudes of the effect sizes were thus entirely consistent with those obtained in other studies using common multiple-item measures (see also Carlo et al., 2005; Grice et al., 2011), and the results consequently indicate that the DAS is just as effective as more traditional techniques in predicting consequential outcomes. The results also serve as a reminder, however, that trait psychologists often deal in small effect sizes when discussing predictive validity.
Despite that neither technique—the DAS nor multiple-item questionnaires—appears to be superior to the other, there are some aspects of the DAS that distinguish it from the more conventional methods. The DAS is a simple rating technique that is completed in a timely manner, and it affords the researcher more control over the rating process through a variety of channels. First, rather than relying on the assumption that all participants will understand an item in the intended manner, the researcher is capable of clearly defining the subtleties of a particular construct to better ensure that the construct is understood in its intended manner. Second, the researcher is able to manipulate labels for the pole anchors. For example, recent research has used such anchors as “excessively extraverted” and “excessively conscientious” to investigate personality disorders as extreme manifestations of dimensional personality traits (Mullins-Sweatt, Jamerson, Samuel, Olson, & Widiger, 2006). Third, the researcher is capable of creating the participants’ reference group during the rating process by deciding the number of additional people to be rated and who these individuals will be. This also provides intriguing data (other than only the actual self) that could be analyzed without participants being asked to complete the same measure separately for each target individual. Last, participants reported enjoying the interactive nature of the DAS and the ability to rate multiple people simultaneously. This is an important consideration, particularly when participants are asked to complete multiple questionnaires or the same questionnaire multiple times for different people (e.g., actual self and ideal self).
In sum, the DAS has been evaluated as a single-item technique for measuring the Big Five personality traits in this study as well as the two studies reported in Grice et al. (2011). The overarching conclusion to be drawn from these investigations is that multiple items may not be necessary when measuring human personality traits—they can be measured just as well with only one item, and the DAS is a feasible approach for doing so. Using a single item, the DAS yields reliability and validity coefficients equal to those obtained using multiple items. Coupled with the benefits of only using one item (e.g., more control over defining the item, brevity and simplicity of the task), it stands to reason that single-item measurement is at least as valuable as multiple-item measurement. Given the amount of success that other researchers (e.g., Barrett & Paltiel, 1996; Bergkvist & Rossiter, 2007; Butt et al., 2008; Nagy, 2002) have had in measuring other constructs with a single item, it should come as no surprise that personality traits can also be measured using one item just as effectively as using multiple items.
Footnotes
Acknowledgements
The authors wish to thank Devan Ramirez, Drew Stephenson, Scott Ihrig, Megan Waugh, and Emily Parker for their valuable help collecting the data reported in this study.
The author(s) declared no potential conflicts of interest with respect to the research, authorship, and/or publication of this article.
The author(s) received no financial support for the research and/or authorship of this article.