
Abstract
To create successful marketing strategies, it is essential to be familiar with consumers’ cognitive structures. In this article, the qualitative method of concept mapping is applied in a consumer survey (N = 132) to elicit cognitive structures and dimensionality of cognitive structures. The authors present methods to analyze dimensionality of cognitive structures descriptively and microeconometrically. An indicator for measuring cognitive structure dimensionality including weighted links is applied. To test the methodology, effects of sociodemographics on dimensionality are analyzed regarding a chosen food product. Results show that consumers’ age and education determine whether cognitive structures are more or less complex, whereas gender has no effect on the dimensionality of cognitive structures. To offer tailored marketing strategies based on dimensionality, emotional marketing strategies should be applied to reach customers with less complex cognitive structures. For consumers with more complex cognitive structures, marketers might focus on providing more detailed, information-based promotion.
Introduction
To be successful in the market, a company’s challenge is to develop a useful understanding of consumers’ behavior in general and, more specifically, to identify consumers’ product knowledge. Companies have to place their products in consumers’ knowledge set, that is, they have to successfully place positive associations related to their products in consumers’ memory. Consumers’ product knowledge is represented in memory as cognitive structures that are relationships of associations. These associations might be units of product information such as brand, packaging, price, and so on. They significantly influence a consumer’s overt motor (e.g., purchase of products) and internal mental (e.g., product perception and evaluation) behavior (Olson & Reynolds, 1983). From consumers’ point of view, product associations help to process information and provide purchase motivation. Cognitive structures organize their information about products in a way that this information can be used in the future to determine which product attributes and characteristics will be more satisfying (e.g., Grunert, 1995; Tybout, Calder, & Sternthal, 1981). Consumers’ cognitive structures of knowledge in memory and associations are key factors, perhaps the most important aspect, in developing a useful understanding of consumer behavior (Joiner, 1998).
So far in the literature, several studies have addressed this topic. For example Henderson, Iacobucci, and Calder (1998) discussed cognitive structures in marketing research regarding branding effects and strategy detection. More recently, Roedder John, Loken, Kim, and Basu Monga (2006) used brand association networks to investigate brand equity. But, although cognitive structures have been shown to be a valuable tool for companies to assess branding effects and marketing strategies, critical components have been overlooked. Although consumers’ cognitive structures for products, brands, and other targets have been uncovered and qualified, the dimensionality of cognitive structures has only been discussed theoretically. Also, previous studies have not considered the underlying question of what exactly determines these structures. Understanding not only the factors constituting consumers’ product association but also dimensionality of cognitive structures is critical for being able to implement strategies that specifically and efficiently target consumers. This is because the dimension of these structures, that is, the complexity of consumers’ cognitive structures is important particularly with regard to information processing. It is assumed that the more complex consumers’ cognitive structures are, the higher the level of involvement (Lastovicka & Gardner, 1978). Involvement refers to the level of “perceived personal relevance” or interest evoked by a stimulus, which the consumer links to enduring or situation-specific goals (Mitchell, 1979; Zaichkowsky, 1985). The consequences of a high involvement are an extended information search, processing, and decision making (Rothschild, 1984). This in turn influences the promotional strategies chosen by companies (e.g., emotional strategies for low-involved customers and information-based strategies for high-involved customers).
To assess and qualify marketing-related cognitive structures and associations, appropriate tools and methodologies are needed. Against this background, the aim of this article is to analyze the determinants of cognitive structures, more specifically determinants of the dimensionality of cognitive structures using descriptive techniques and econometric modeling according to the given data structure. By using a count data model, we can appropriately control for the nature of the data while assessing the impact of individual-specific characteristics that drive the dimensionality. Our assumption is that a count data model in combination with the methodology of concept mapping is appropriate to investigate determinants of dimensionality of cognitive structures. In this regard, we elicited cognitive structures applying the qualitative method of concept mapping. A total of 132 respondents mapped their cognitive structures, aka, product associations participating in a consumer survey. Data were analyzed using Poisson models.
Findings from this research contribute to the literature methodologically and managerially. The methodological contribution of our study is fourfold: (a) We demonstrate the dimensionality of cognitive structures descriptively; (b) we provide an econometric determination of the dimensionality of cognitive structures; (c) we apply an indicator of cognitive dimensionality by means of a weighted dependend variable; and (d) we perform the method to different products to test for consistency. Results show that it is possible to analyze the dimensionality of cognitive structures in a descriptive and econometric way. They also show that the applied indicator gives significant results in the econometric analysis and that the procedure is consistent over different products.
Besides methodological issues, managerially, the findings are useful for effective marketing strategies regarding consumer groups with differently complex, that is dimensional, cognitive structures. For example, certain education showing a positive effect on dimensionality may lead to the conclusion that informative rather than persuasive communication strategies are appropriate to reach customers with higher education levels. Moving beyond merely uncovering consumer cognitive structure dimensionality and toward understanding the respective determinants is critical for consumer behavior researchers as well as marketers and product developers.
The structure of the article is as follows. The section titled “Theoretical Background on Cognitive Structures” gives theoretical background regarding cognitive structures. The next section titled “Methodological Background” discusses material and methods. The section titled “Empirical Results” presents the empirical results, and the last section titled “Conclusion” concludes and provides implications for further research.
Theoretical Background on Cognitive Structures
Cognitive structures have a major influence on mental behavior as well as on overt motor behavior. They are vital in explaining information processing and purchase decision making by having an impact on the processes of attention, encoding, evaluation, storage, and use of information (Marks & Olson, 1981; Olson & Reynolds, 1983).
To conceptualize cognitive structures, the assumption of a network of related, associated concepts has been made. These networks are called semantic and/or associative networks. Semantic networks are arranged of a set of characteristics (Anderson, 1983a, 1983b; Collins & Loftus, 1975). 1 For example, individuals are having semantic networks for products that include their generalized knowledge about this object.
According to the “associative network memory model” semantic memory or knowledge can be understood as a node-link structure comprising a set of nodes and lines (Keller, 1993; Sirsi, Ward, & Reingen, 1996). 2 The nodes of the network display concepts. The lines indicate links (relationships) connecting these concepts. They correspond to type and strength of the association between concepts (Cowley & Mitchell, 2003; Dacin & Mitchell, 1986; Henderson et al., 1998; Kintsch, 1998). There are, for example, associations between products and a set of characteristics such as brands, packaging, and commercials. These characteristics have links to other attributes, for example, from chocolate brand to chocolate to taste to sweet. The result is that each product is characterized by a group of associations. The associations vary in strength. Some concepts are more strongly associated than others (Aaker & Keller, 1990). We believe that the long-term memory contains a huge number of semantic networks. They are linked together in higher order patterns. One may think of a kind of hierarchy among them (Martin, 1985).
Semantic networks have different degrees of cognitive complexity. Cognitive complexity is conceptualized as dimensionality. The number of relevant concepts stored in memory defines dimensionality. The more concepts are stored for a domain, the higher the dimensionality. Dimensionality affects consumers’ product information processing (Kanwar, Olson, & Sims, 1981). In addition to the number of concepts, the dimensionality is identified by the number of links between the attributes. Highly integrated knowledge structures are characterized by a high number of relationships between all concepts and by the different levels of links (Martin, 1985). With regard to marketing, one might think that the more complex a semantic network is, the more involved the consumer is in terms of product evaluation. In line with the Elaboration Likelihood Model of Attitude Change (Cacioppo & Petty, 1986; Petty & Cacioppo, 1984; Petty, Cacioppo, & Schumann, 1983), those with less complex cognitive structures could be stimulated with rather emotional campaigns (peripheral route to persuasion). Concerning marketing strategies, those consumers with more complex cognitive structures might demand more information regarding the product (central route to persuasion).
With regard to semantic networks, most research has been done in the field of brands (Aaker & Keller, 1990; Henderson et al., 1998; Henderson, Iacobucci, & Calder, 2002; Joiner, 1998; Keller & Aaker, 1992; Roedder John et al., 2006; Tybout et al., 1981).
Methodological Background
Concept Mapping Technique
A technique to measure cognitive structures and cognitive structure dimensionality must reach memory somewhat directly (Kanwar et al., 1981). It is important not to control the mind (Bonato, 1990). The applied method has to be adequately “open” and nondirective so that the full range of elements kept in the cognitive structure can be uncovered (Olson & Muderrisoglu, 1979).
Among research methods, associative elicitation techniques are most commonly used to access semantic networks. Associative elicitation techniques are based on unprompted and automatic links between single memory and emotional content. They uncover the impact of single associations and their related cognitive structures. These elicitation procedures range from mainly qualitative types such as memory probes (e.g., free elicitation technique) and graphing techniques (e.g., concept mapping), to more structured techniques such as sorting methods (e.g., repertory grid), “think aloud” strategies, and laddering (Grebitus, 2008; Grebitus & Bruhn, 2008; Grunert & Grunert, 1995; Gutman, 1982; Henderson et al., 1998; Henderson et al., 2002; Joiner, 1998; Lord, Desforges, Fein, Pugh, & Lepper, 1994; Olson & Muderrisoglu, 1979; Reynolds & Gutman, 1988; Roedder John et al., 2006; Roininen, Arvola, & Laehteenmaeki, 2006; Scheele & Groeben, 1988; Hofstede ter, Audenaert, Steenkamp, & Wedel, 1998).
Associative elicitation techniques are closely related to network models modeling human long-term memory. Main objective of these techniques is to obtain cognitive structures regarding particular knowledge areas. Graphing procedures are preferred because of their visualization of associations and respective relationships with each other. Another advantage is the direct collection of data (Bonato, 1990). Against this background, we used the graphing procedure “concept mapping” as technique to reveal the dimensionality of cognitive structures. Concept mapping is a type of networking (Bonato, 1990). It creates a schematic representation of meaningful associations among information elements like product associations (Zsambok, 1993). Concept maps are images of cognitive structures. They assist individuals in describing their own knowledge structures (Jonassen, Beissner, & Yacci, 1993). The technique collects information about consumers’ mind models of a variety of knowledge. Concept maps illustrate differences among individuals, concerning their knowledge structure of a specific subject (Joiner, 1998).
Concept mapping is a method in which participants can write down all associations that come to their mind when presented with a stimulus (key concept). Concept mapping activates a specific structure of stored knowledge. When applying concept mapping, respondents not only have to recall associations but also have to directly link them to each other (Bonato, 1990). Concept maps expose the total number of relationships included in the network. This is an indicator of dimensionality of cognitive structures (Zsambok, 1993). Unlike other methods such as free elicitation technique, laddering, or repertory grid, the relationships are not based on theoretical assumptions. Respondents have to draw the actual link. To avoid confusion and minimize interviewer bias, clear instructions are provided (Bonato, 1990).
Concept maps are two-dimensional diagrams. They illustrate the relationships connecting concepts, that is, associations (Zsambok, 1993). The single concepts can be related to a key concept and/or to each other. The visual presentations are graphs made of concepts and their relationships (Bonato, 1990; Jonassen et al., 1993). Respondents receive a set of key concepts or have to write down concepts themselves. Then, they have to organize the concepts in a way that represents relationships among them (Martin, 1985). Concept mapping enables the participant to activate recognition. This lowers the barrier of availability and increases recall of knowledge held in long-term memory. This technique leads to a reflection of knowledge. This stimulates the spread of activation, which leads to further recall and elaboration (Rye & Rubba, 1998). Applying this procedure activates concepts within a specific area. Respondents with higher dimensional/more complex cognitive structures should be able to use more concepts to draw the concept map. In addition, they are supposed to be able to make finer distinctions between stimuli regarding the dimension compared with those whose cognitive structure dimensions are less expressed (Kanwar et al., 1981).
Concept mapping was developed as a learning technique (see Novak 1977; Novak & Gowin, 1984). Thus, a lot of research on concept mapping has been done in this field (e.g., Zsambok, 1993). Furthermore, concept mapping studies have been carried out in counseling research (e.g., Martin, 1985), social psychology (Lord et al., 1994), agricultural economics (Grebitus, 2008), and marketing (Joiner, 1998; Roedder John et al., 2006).
The contribution of our study lies in the descriptive and econometric determination of the dimensionality of cognitive structures. The particular relevance belongs to the fact that we use data from a consumer survey and perform the method to different products to test for consistency. We apply concept mapping for the first time in a consumer survey with a larger sample size. So far, in marketing applications, concept mapping has only been used with small groups of one to five students by Joiner (1998). Roedder John et al. (2006) applied concept mapping with a large sample of patients/former patients of the Mayo Clinic.
Data Collection
We apply concept mapping following Joiner (1998) and Lord et al. (1994). The respondents receive a key concept and are asked to write down concepts themselves. Then, they have to arrange these terms into a pattern that represents relationships existing among them. To provide a frame of reference for the task and minimize possible individual context effects due to respondent-unique interpretations, the interviewer provided instructions, explaining the purpose of the study in a way as nondirective as possible. Following Joiner, the instructions also stress that we are looking “for anything that comes to mind when you think about the target object.” (p. 314). We made it clear that there are no “correct” or “incorrect” concept maps. Also, we show a fictional concept map as an example of a completed concept map to reduce the priming of any specific types of associations. The interviewer leads the participant step by step through the procedure.
To choose a key concept, we conducted desk research in the field of agricultural marketing. One of the key information used by consumers to perceive (food) products is the brand. However, brands are usually used for processed, highly standardized food products. Unprocessed foods such as fresh fruits, vegetables, and meat are rarely branded, which makes it hard for consumers to evaluate the product (Bredahl, 2003). Consumers then have to use other quality characteristics to evaluate the product. It is important to know what characteristics are used for product perception and in turn what evaluation is related to the single product characteristic. Consumers might perceive the color to evaluate the freshness of a product. Furthermore, color is used to infer taste. This already shows that several complex relationships are present within the cognitive structures concerning foods. To investigate associations for unbranded products, we chose meat as the research product and more specifically pork because pork is by far the most consumed meat in Europe (covering almost half of total meat consumption; Ngapo, Martin, & Dransfield, 2007).
To control for method consistency, we chose two closely related, but still different, key concepts. The 132 participants were divided into two subsamples. Subsample 1 consisted of 65 participants who received “pork” as the key concept. Subsample 2 consisted of 67 participants who received “pork quality” as the key concept. The respondents got sheets of paper with the respective key concept in its center. To ease requirements of writing down everything that comes to mind, the interviewees received eight additional cards with concepts, namely, freshness, leanness, taste, butcher, marbling, price, origin, and seal of approval. In the following, these concepts are called predetermined concepts. The choice of the additional concepts was based on results of an analysis of studies concerning relevant pork (quality) characteristics. The concepts were derived from different empirical studies, which have taken place between 1982 and 2002. For a review, see Steenkamp (1989) and Engelage (2002). The application of the predetermined concepts was optional. Moreover, the participants were asked to add further individual concepts, which they associated with the key concept. Finally, they had to create a semantic network, by linking the concepts to each other. Participants were allowed to take as much time as necessary to complete their individual concept map.
To summarize the procedure,
Each map started with a key concept labeled in the centre of the paper, in this case pork/pork quality.
Interviewees received eight additional cards with predetermined concepts. The application of these concepts was optional.
Respondents were instructed to add own, individual concepts that they associated with the key concept.
Participants constructed a map, by linking the concepts to each other.
Count Data Analysis
To analyze determinants of dimensionality of cognitive structures, the number of concepts elicited with concept mapping is used as dependent variable (compare Martin, 1985). As the data are positive integers, an appropriate method for analysis is count data analysis. Count data are defined by the dependent variable being an integer positive number. That number takes the values y = 0, 1, 2, . . ., with no explicit upper boundary (Cameron & Trivedi, 1986). The two most frequently used models for count data are Poisson regression and negative binomial regression models (Stock & Watson, 2004). The models are based on different distributions of the dependent variable, whether it is a Poisson distribution or a negative binomial distribution. The mean is defined as F(X, β) = exp(X, β), to guarantee that the mean is positive (Cameron & Trivedi, 1986). The distributions are exponential.
To start with a count data model, a Poisson distribution is assumed. The Poisson regression model has a distributional assumption and a specification of the mean parameter as a function of explanatory variables. The Poisson distribution is a one-parameter, lambda, distribution, which is equal to the mean and the variance. Lambda must be positive. The Poisson model is characterized by the assumptions that events occur independently over time and that the conditional mean and variance of Yi given Xi are equal. This implies that the variance should not exceed the mean or there would be overdispersion. Also, the mean should not exceed the variance. Otherwise, there would be underdispersion (Cameron & Trivedi, 1986; Winkelmann, 2000).
One way to relax the restrictions of the general Poisson regression model is to apply the compound Poisson model. A negative binomial model is a generalized compound Poisson model, which allows for overdispersion (Cameron & Trivedi, 1986). To choose between the Poisson model (Lr) and the negative binomial model (Lur), a specification test to verify the variance–mean relationships is used (Collett, 2003):

Both models are estimated with the maximum-likelihood method. For further information regarding the specification test, see Collett (2003).
Empirical Results
Sample Structure
A survey of consumers was conducted in 2004 in the field of agricultural marketing. Data were collected in the medium-sized town of Kiel in Northern Germany. All respondents were older than 18 years and lived in private households. The survey was conducted using questionnaire-based, face-to-face interviews. Among others, consumers’ cognitive structures and sociodemographics were elicited. The sample consisted of 132 participants. The sampling method applied was a purely random sample derived from the social address register of the city of Kiel. Table 1 shows the structure of the sample and comparison with the demographic characteristics of residents of the city. Based on the comparison, the sample is overrepresentative with regard to female respondents and those aged 18 to 34 years.
Structure of the Sample (in Percentage)

As mentioned before, the sample was divided; 65 participants constructed concept maps regarding pork and 67 participants constructed concept maps regarding pork quality. 3 A Levene Multiple Comparison Test was applied to test for differences between the number of concepts and number of links between concepts used (written down) by the respondents in the two subsamples. There were no significant differences between the two subsamples, neither regarding number of concepts and links in total nor regarding number of individual or predetermined concepts. The individual concepts refer to the idiosyncratic (individual) concepts given by the respondents themselves. The predetermined concepts refer to the eight concepts given by the interviewer to the respondents. The result is satisfactory regarding the consistency of the method. As the two subsamples do not differ significantly, in the following, they are combined and results are presented for a sample of N = 132.
Descriptive Results: Counting
Kanwar et al. (1981) operationalized dimensionality of cognitive structures by the counted number of concepts stored in memory regarding the respective key concept. Thus, to analyze dimensionality of cognitive structures, we start by counting words elicited through the concept-mapping technique. Table 2 lists the descriptive findings. The measurements between total, individual, and predetermined number of concepts used are compared.
Descriptive Results of Concept Mapping
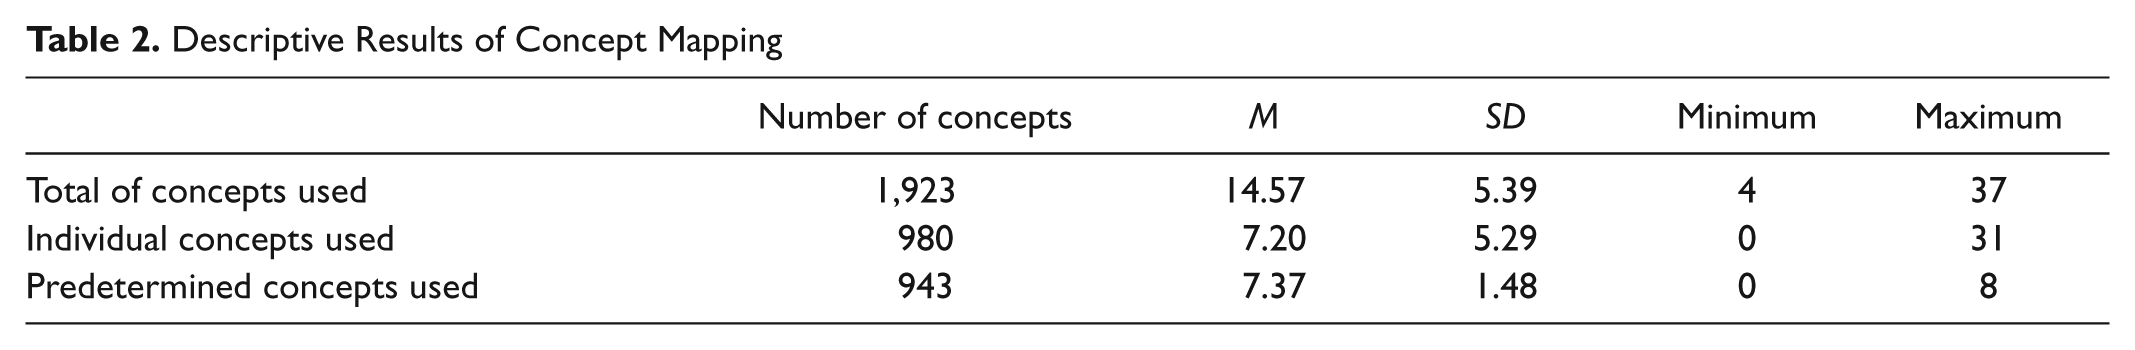
Table 2 shows that the number of concepts in total per interviewee ranges from 4 to 37. In sum, the 132 participants gave a total of 1,923 concepts, 980 individual concepts, and 943 concepts of the predetermined ones (including multiple nominations). The sum of different concepts is 637. The mean is 14.6 concepts per respondent, 7.2 of the individual ones and 7.4 of the predetermined ones. The difference between 7.2 and 7.4 is statistically not significant. Participants used almost all of the predetermined concepts. In this regard, one explanation might be that the concepts provided are the most important associations with pork/pork quality according to the literature. Hence, participants used them for that reason. However, a more critical explanation would be that they used them only because they were provided, without consciously thinking that they are indeed related to pork/pork quality. 4 Among the predetermined concepts, “butcher” and “origin” are the most frequent associations used by the interviewees. Concepts that participants individually relate to pork/pork quality are for example swine fever, factory farming, farm, expensive, barbecue, supermarket, animal transport, organic meat, odor, juicy, or fat. With regard to these individual concepts, “swine fever” is among the most frequent ones. This association could be evoked by consumers’ increasing concerns about health and food-borne risks in the meat sector. Nevertheless, there are a great number of concepts that have been mentioned by less than 10% of the respondents such as “hormonal treatment,” “minced meat,” and “canteen.”
As mentioned, according to Kanwar et al. (1981), the dimensionality of consumers’ cognitive structures is expressed by the number of concepts, that is, number of associations elicited with concept mapping. Furthermore, according to Martin (1985) and Zsambok (1993), concept maps reveal the amount of relationships contained in the network, which is an index of dimensionality of cognitive structures. To investigate this part, the concept maps were scored for the different levels of links.
Figure 1 and Figure 2 give examples of concept maps from the survey. Figure 1 shows that the participant used all predetermined eight concepts and added four individual concepts. For example “marbling” in Figure 1 is a first-level link, whereas “local” is a second-level link. All maps were scored for the level of links following the rule that the shortest way between the key concept and a concept defines the level of links.

Example of an individual concept map with the key concept ‘pork quality’
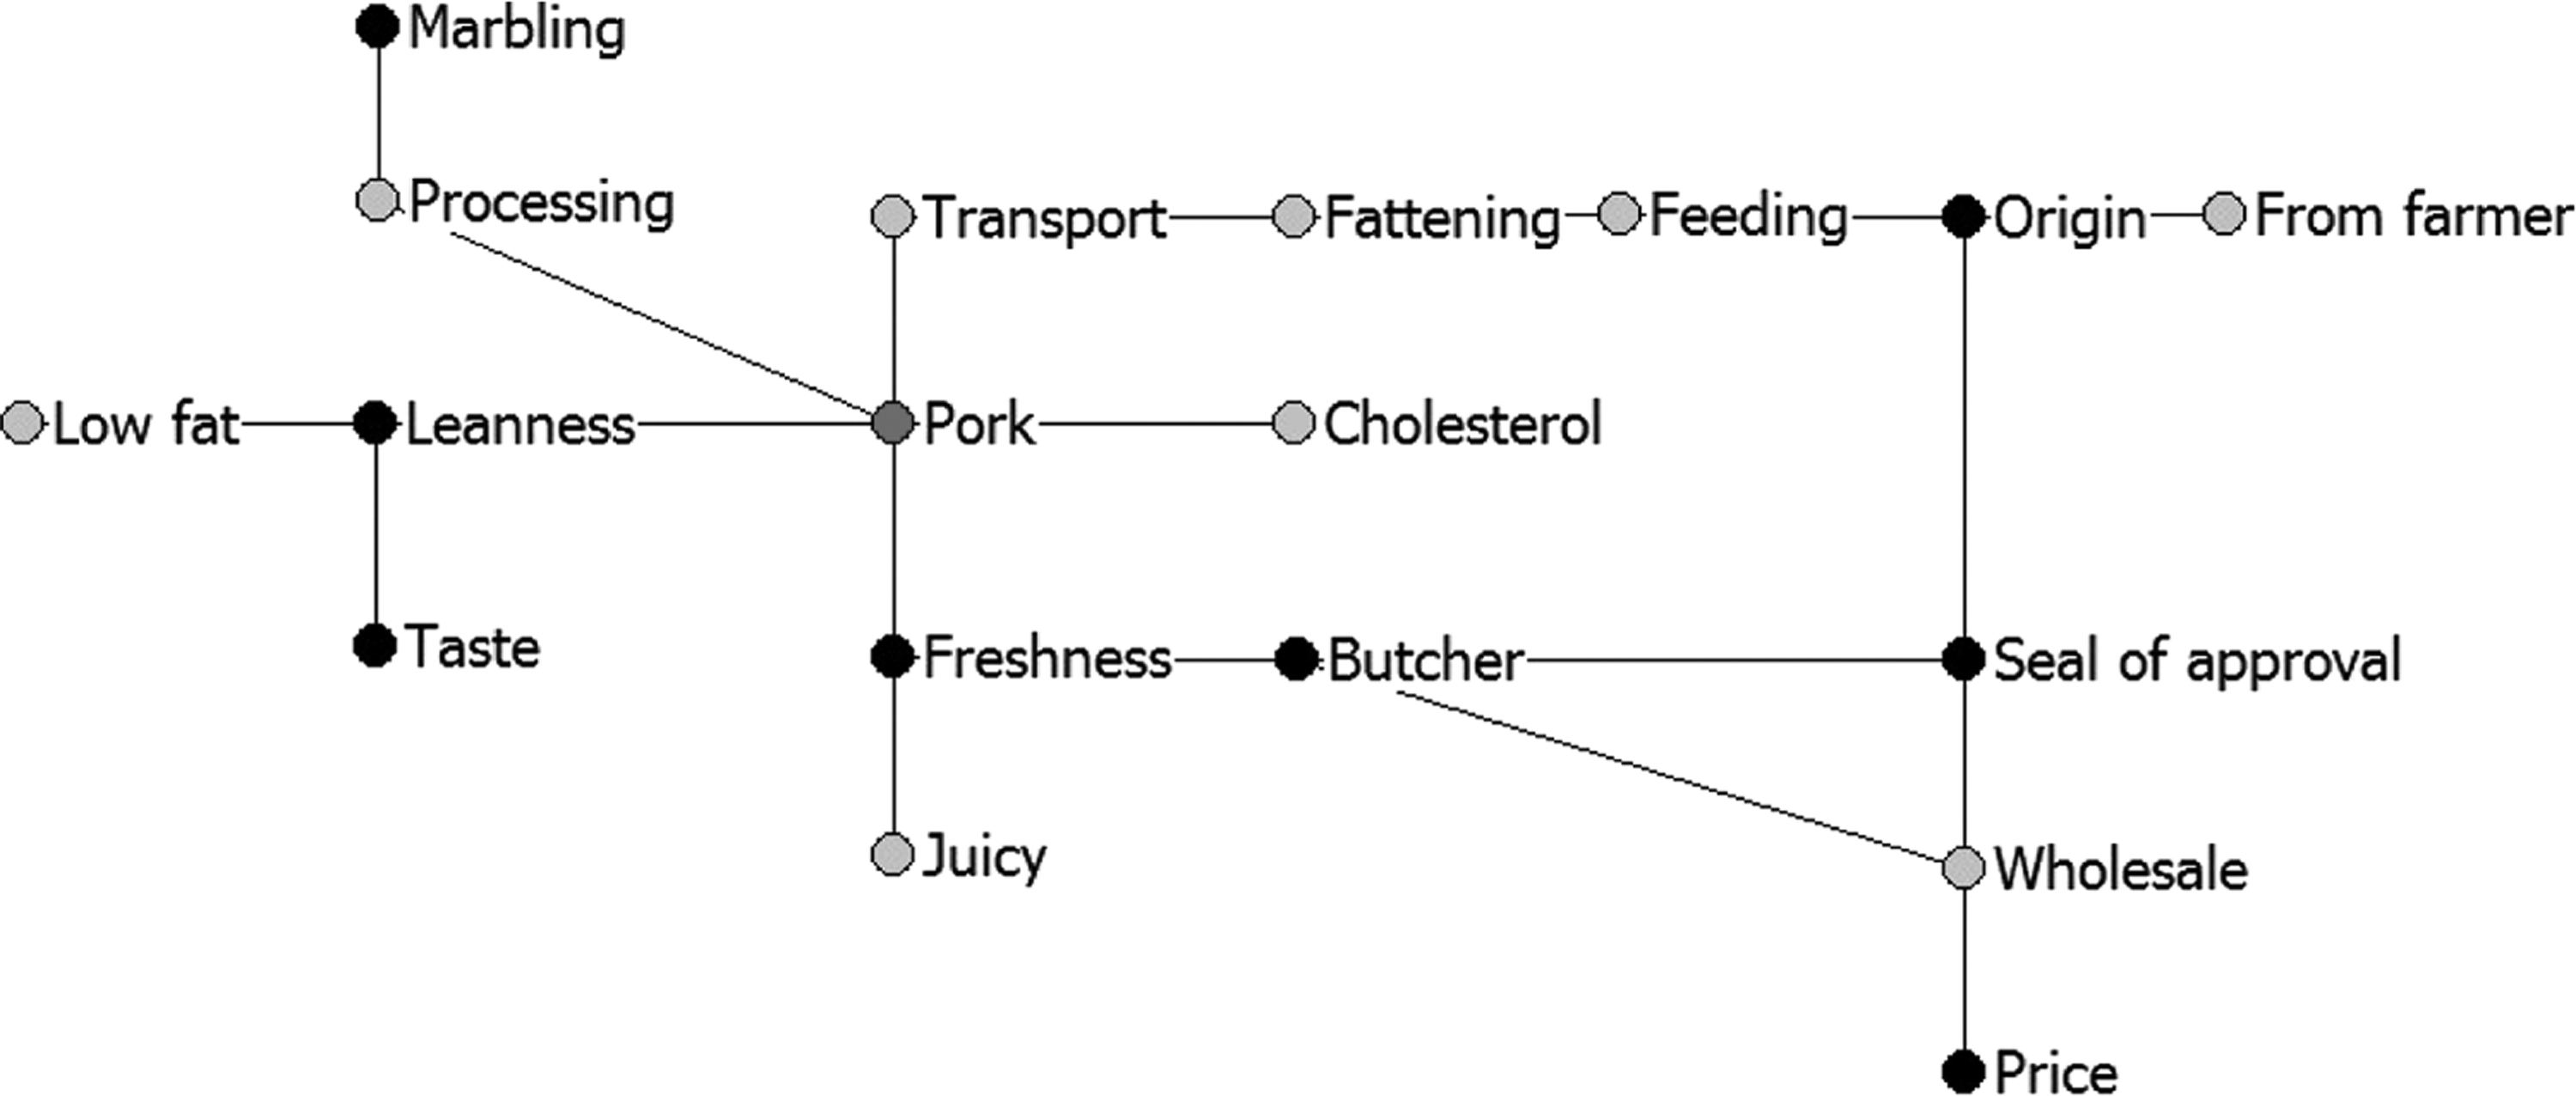
Example of an individual concept map with the key concept ‘pork’
Figure 2 shows examples of first-level links (e.g., freshness and transport) up to a fifth-level link (from farmer). This is a difference compared with the concept map in Figure 1 where the participant drew first- and second-level links only. In addition to that, this participant used more than twice as many individual concepts as the respondent from Figure 1.
Table 3 lists the descriptive findings for the five different levels of links. The results show that there are clearly more first- and second-level links than third- and higher level links. The mean of first-level links is 7.2 and the mean of second-level links is 5.1, whereas the fourth and fifth plus level links have a mean below 1. Furthermore, the results show that some participants have only first-level links expressed by the minimum of 0 for second- and higher level links.
Descriptive Statistics for Level of Links

Econometric Results: Count Data Model
After merely counting concepts and links, we perform an econometric analysis—count data analysis—to analyze determinants of dimensionality of cognitive structures. To do so, we use three different dependent variables. Dependent Variable 1 consists of the # of concepts (following Kanwar et al., 1981). Dependent Variable 2 consists of the # of links—to analyze determinants of dimensionality depending on relationships between concepts. Dependent Variable 3 is an indicator developed by Grebitus (2008) following Martin (1985) and Zsambok (1993) and consists of the # of concepts with weighted links. It is called Cognitive Structures Weighted by Level of Links. This variable is constructed as shown in Equation 2:

where #con = number of concepts from concept mapping and LeLi = Level of Links.
As the nature of this article is methodological, we test whether count data models are appropriate to analyze determinants of dimensionality of cognitive structures. Independent variables included in the analysis as determinants are sociodemographics. If the outcome is successful in the future, all kinds of variables such as attitudes and beliefs can be included in the analysis. In the following, Table 4 defines dependent and independent variables included in the analysis.
Definition of Variables

Specification test for count data model
To test whether the Poisson model or the negative binomial model is appropriate, we apply the specification test described in the previous section. The results show that the distributions of yi are Poisson. 5 The Poisson regression model specifies that each yi is drawn from a Poisson distribution with parameter λi, which is related to the regressors xi (Greene, 2000). The most common formulation for λi is the log-linear model,

Presentation and discussion of results
The estimation results are reported in Table 5. The table columns report the estimated coefficients and standard errors. Also, marginal effects (dy/dx) are reported for each model to show how consequential the different sociodemographic variables are. It turns out that the model with dependent variable # of concepts with weighted links has a higher pseudo R2 and a higher log likelihood compared with the models with dependent variables # of concepts and # of links.
Determinants of Cognitive Structure Dimensionality (n = 132)

Level of significance: *p < .10. **p < .05. ***p < .01. ns = not significant.
ME = Marginal effects (dy/dx). Significant marginal effects are printed bold.
Low education dropped due to multicollinearity.
The assembly of determinants is jointly significant in the three independent models “# of concepts, # of links, and # of concepts with weighted links” based on likelihood ratio tests. The pseudo R2 ranges from .04 to .09, with higher values reported for the set of estimates for # of concepts with weighted links. Results for # of concepts and # of links are very similar. With regard to the comparison of the results of all three dependent variables it is observed that # of concepts with weighted links shows significantly better results. The pseudo R2 is twice as high, and more coefficients show significant results. This leads to the conclusion that in analyzing the dimensionality of cognitive structures the dependent variable # of concepts with weighted links should be used in the future.
As the main focus of the article is to test the application of the count data model in general, the results are only briefly interpreted—with regard to # of concepts with weighted links. The results show that there is no significant effect of gender on the dimensionality of cognitive structures. This result leads to the conclusion that men and women have the same degree of cognitive structure dimensionality regarding the key concepts. The variable age does not show significant effects but age squared is significantly positive. This means that only from a higher age on dimensionality of cognitive structures increases. We note a nonlinear increase with age.
There is a significantly positive effect to state for modest education and a significantly negative effect for very high level of education. Kanwar et al.’s (1981) theoretical approach and the results by Joiner (1998) lead to the conclusion that concept maps of more knowledgeable groups should be structurally more complex. Thus, an increase in education would lead to a higher dimensionality of cognitive structures. This is partly shown by our results. The significantly positive effect of modest education compared with the dropped category low education shows that a higher level of education leads to more complex cognitive structures. However, the very high education shows the opposite result. This might be explained by the fact that dimensionality of cognitive structures is not dependent on education alone. Another explanation might be that from a very high level of education on individuals start to cluster their knowledge. Instead of using multiple concepts to “describe” something in memory they might use a mechanism of combination/categorization, which ultimately would lead to a lower amount of concepts and links in the respective cognitive structure. However, this would need further research to be tested. To test results with regard to education, the dummy variables were replaced with a continuous variable using years of education. The results were consistent with the model presented in Table 4. Dummy variables enable us to differentiate between different education levels, thus we prefer this model.
With regard to the marginal effects, we note especially strong positive effects of the variables modest and high education. If an individual holds a modest education, it will use on average 3 more concepts and 4 more links compared with an individual with a low education level. The difference between those with a high education and those with a low education is on average 0.6 more concepts and 2 more links, although we have a negative effect for very high education. Those individuals would use 1 concept and 0.4 links less than those with a low education level. The effect of gender is also negative. Women use about 1 concept and 0.3 links less than men. The older someone becomes the more concepts (0.02 per year) but the less links (0.1 per year) are used. Concluding from this one could think of different strategies in information processing depending on gender and education. This in turn could be useful for companies when developing strategies for target marketing. For example, modest education showing a positive effect on dimensionality may lead to the conclusion that rather informative than persuasive communication strategies are appropriate to reach customers with modest education levels.
Conclusion
This article has investigated descriptive and econometric methods for analyzing determinants of dimensionality of cognitive structures using consumer data. The descriptive method of counting concepts shows how many associations appear in consumers’ minds and the levels of links present. Count data analysis investigates determinants of dimensionality of cognitive structures to be used in identifying target groups for marketing strategies.
From a methodological point of view, our results show that both descriptive and econometric methods are useful to analyze (dimensionality of) cognitive structures. For uncovering determinants of dimensionality, the model combining number of concepts with level of links shows better results than the simpler models based on number of concepts/links only. Further analyses of the data could be done by applying network analysis to specifically uncover the relationships between the associations mentioned by participants. This would provide additional information on context to be used for communication strategies.
From the managerial perspective, results from count data modelling enable marketers for instance to uncover consumers’ level of involvement based on complexity of cognitive structures. This helps to tailor marketing strategies according to the dimensionality. Simple and rather emotional marketing strategies should be applied to reach target groups with less complex cognitive structures, for example, at the point of sale to communicate brands. For more complex cognitive structures, promotional strategies should rather focus on information such as leaflets or labels as these customers most likely have a higher involvement.
Footnotes
The author(s) declared no potential conflicts of interest with respect to the research, authorship, and/or publication of this article.
The author(s) received no financial support for the research and/or authorship of this article.