
Abstract
Introduction
Patients with femoral neck fractures (FNF) have reduced walking ability owing to muscle weakness. Preoperative muscle volume and quality may have an association with prolonged rehabilitation and can be useful to predict the postoperative walking ability in patients with FNF. This study aimed to compare the muscle volume and computed tomography (CT)-assessed density around the hip joint in patients with FNF with patients having hip osteoarthritis (HOA) and assess the association of these measurement with postoperative walking ability.
Materials and Methods
This retrospective observational study included 15 patients with FNF and 15 with unilateral HOA who were matched for age, sex, and osteoporosis medication. Muscle volume and CT-assessed density of the gluteus maximus, gluteus medius, gluteus minimus, iliacus, psoas major, rectus femoris, and rectus abdominis on the unaffected side were measured three-dimensionally using 3D Slicer software with preoperative CT data. The associations of muscle measurement with patient background, load to FNF (measured using the finite element method), and pre- or postoperative walking ability were assessed.
Results
Muscle volume of gluteus maximus, CT-assessed density of all muscles, and femoral strength were significantly lower in the FNF group than in the OA group (P < .01, P < .01, and P = .04, respectively). Muscle volume showed a moderate-to-strong correlation with body mass index (r = 0.66-0.81) and FNF load (r = 0.51-0.70), and CT-assessed density showed a moderate correlation with serum nutritional markers (r = 0.33-0.60). Postoperative walking ability was significantly correlated with the muscle volumes of iliacus and gluteus maximus (r = 0.40 and 0.49) and CT-assessed density of all muscles (r = 0.47-0.64).
Conclusion
Muscle volume and CT-assessed density significantly correlated with femoral bone strength, serum total protein levels, and pre- and postoperative walking ability. These findings suggest that muscle CT analysis around the hip joint may serve as a valuable tool for assessing musculoskeletal status in patients with FNF.
Keywords
Introduction
As the population ages, the incidence of proximal femoral fractures is increasing, significantly contributing to long-term care and bedridden cases. These fractures often lead to decreased walking ability post-injury1,2; this may be due to reduced muscle strength in the trunk and lower extremities, which is necessary for walking. Thus, evaluation of preoperative muscle weakness may be associated with prolonged rehabilitation and be useful in predicting postoperative walking ability in patients with femoral neck fracture (FNF). Muscle strength in patients with FNF has often been evaluated in accordance with the diagnostic criteria for sarcopenia.3,4 Several studies have delved into identifying the specific muscles exhibiting abnormalities in volume or cross-sectional area in patients with proximal femoral fracture,5-9 however, few studies have focused on the muscle volume and CT values of the muscles around hip joint in relation to walking ability.
Recent advances in diagnostic imaging techniques and evaluation methods have provided various benefits in the medical field. Computed tomography (CT) is a useful modality for the quantitative evaluation of bones and muscles by targeting skeletal and soft tissue regions. Using dedicated software, CT quantitatively enables three-dimensional muscle assessment of volume and CT-assessed density, which is reportedly correlated with muscle strength. 10 The 3D-slicer (https://www.slicer.org) 6 is a free and open-source software that provides three-dimensional visualization, segmentation, and analysis of bones and muscles. 11 It allows quantitative comparison of muscle volume and CT-assessed density among different patients. Using a calibration phantom, CT-assessed density can be normalized and compared among the patients to quantify the quality of each muscles. 10
Patients with FNF are expected to have decreased muscle volume, muscle CT-assessed density, and bone strength.12-14 However, only a limited number of studies have conducted comprehensive three-dimensional evaluations of these parameters. Therefore, one of the objectives of this study was to assess muscle volume and CT-assessed density around the hip joint on the unaffected side in patients with FNF. To achieve this, we included patients with unilateral hip osteoarthritis (HOA) as the control group since osteoarthritis is common among older individuals. CT analysis of the muscles around the hip joint on the unaffected side was compared between patients with FNF and those with HOA. Moreover, we aimed to explore whether preoperative patient status, including femoral strength and CT analysis of muscles, correlated with postoperative walking ability in patients with FNF.
Materials and Methods
Patient
This retrospective observational study was approved by the Institutional Review Board (F241000003) and conducted in accordance with the STROBE guidelines. A total of 15 patients with cervical fractures of the femur (six males and nine females) who underwent preoperative CT and surgical treatment at our hospital between 2015 and 2018 was included. The control group comprised 15 patients with HOA (six males, nine females) who underwent total hip arthroplasty at our hospital from 2012 to 2018. The control group was selected after adjusting for patient background, including age at surgery, height, weight, sex, and osteoporosis medications, with FNF patients. The primary outcome measures considered in this observational study include volume and CT-assessed density muslces around hip, femoral bone strength, serum nutritional markers, and pre- and postoperative walking abilities. In all patients, preoperative serum total protein (TP) and albumin (Alb) were measured, and pre-and postoperative walking ability was scored on a 5-point scale: 1 for wheelchair inaccessibility, 2 for wheelchair accessibility, 3 for walking with aid, 4 for walking with a cane, and 5 for unaided walking. All patients underwent CT scans (Sensation16; Siemens AG, Erlangen, Germany) promptly after being brought to the emergency department for the fracture. The scanner settings were approximately 120 kV and 300 mA, with a slice thickness of 1.5 mm. A calibration phantom (B-MAS 200; Kyoto-Kagaku, Kyoto, Japan) was placed on the back of each patient during imaging. 10 Transverse images were obtained from L1 to the distal end of the femur for each patient.
Bone Strength Measurement
Finite element (FE) models of the femoral bone on the unaffected side were constructed using Mechanical Finder (MF, version 10.0; RCCM, Tokyo, Japan) from the CT datasets that was underwent immediate after the fracture occurred. The average number of tetrahedral elements in the FE models utilized in this study was approximately 240 000. To account for the heterogeneity of the osseous tissue, we determined the elastic modulus of the elements of the osseous tissue. The Poisson’s ratio of each element in the FE model was 0.40. The shaft of the femur bone model was constrained to a level of 2.5 cm from the distal foot of the lesser trochanter (Figure 1A and B). A load was applied to the head of the femoral model at 20° from the femoral model axis (Figure 1C). The load value at the inflection point of the stress-strain diagram was defined as the proximal femoral strength value (Figure 1D and E). We compared femoral strength values between the FNF and HOA groups, with separate analyses conducted for males and females. Finite Element Model for Measurement of Proximal Femoral Strength on the Unaffected Side in Patients With Femoral Neck Fracture and Those With Unilateral Hip Osteoarthritis. (A-E) Proximal Femoral Strength was Quantified by Measuring the Load Value at the Inflection Point of the Stress-Strain Diagram Using Mechanical Finder.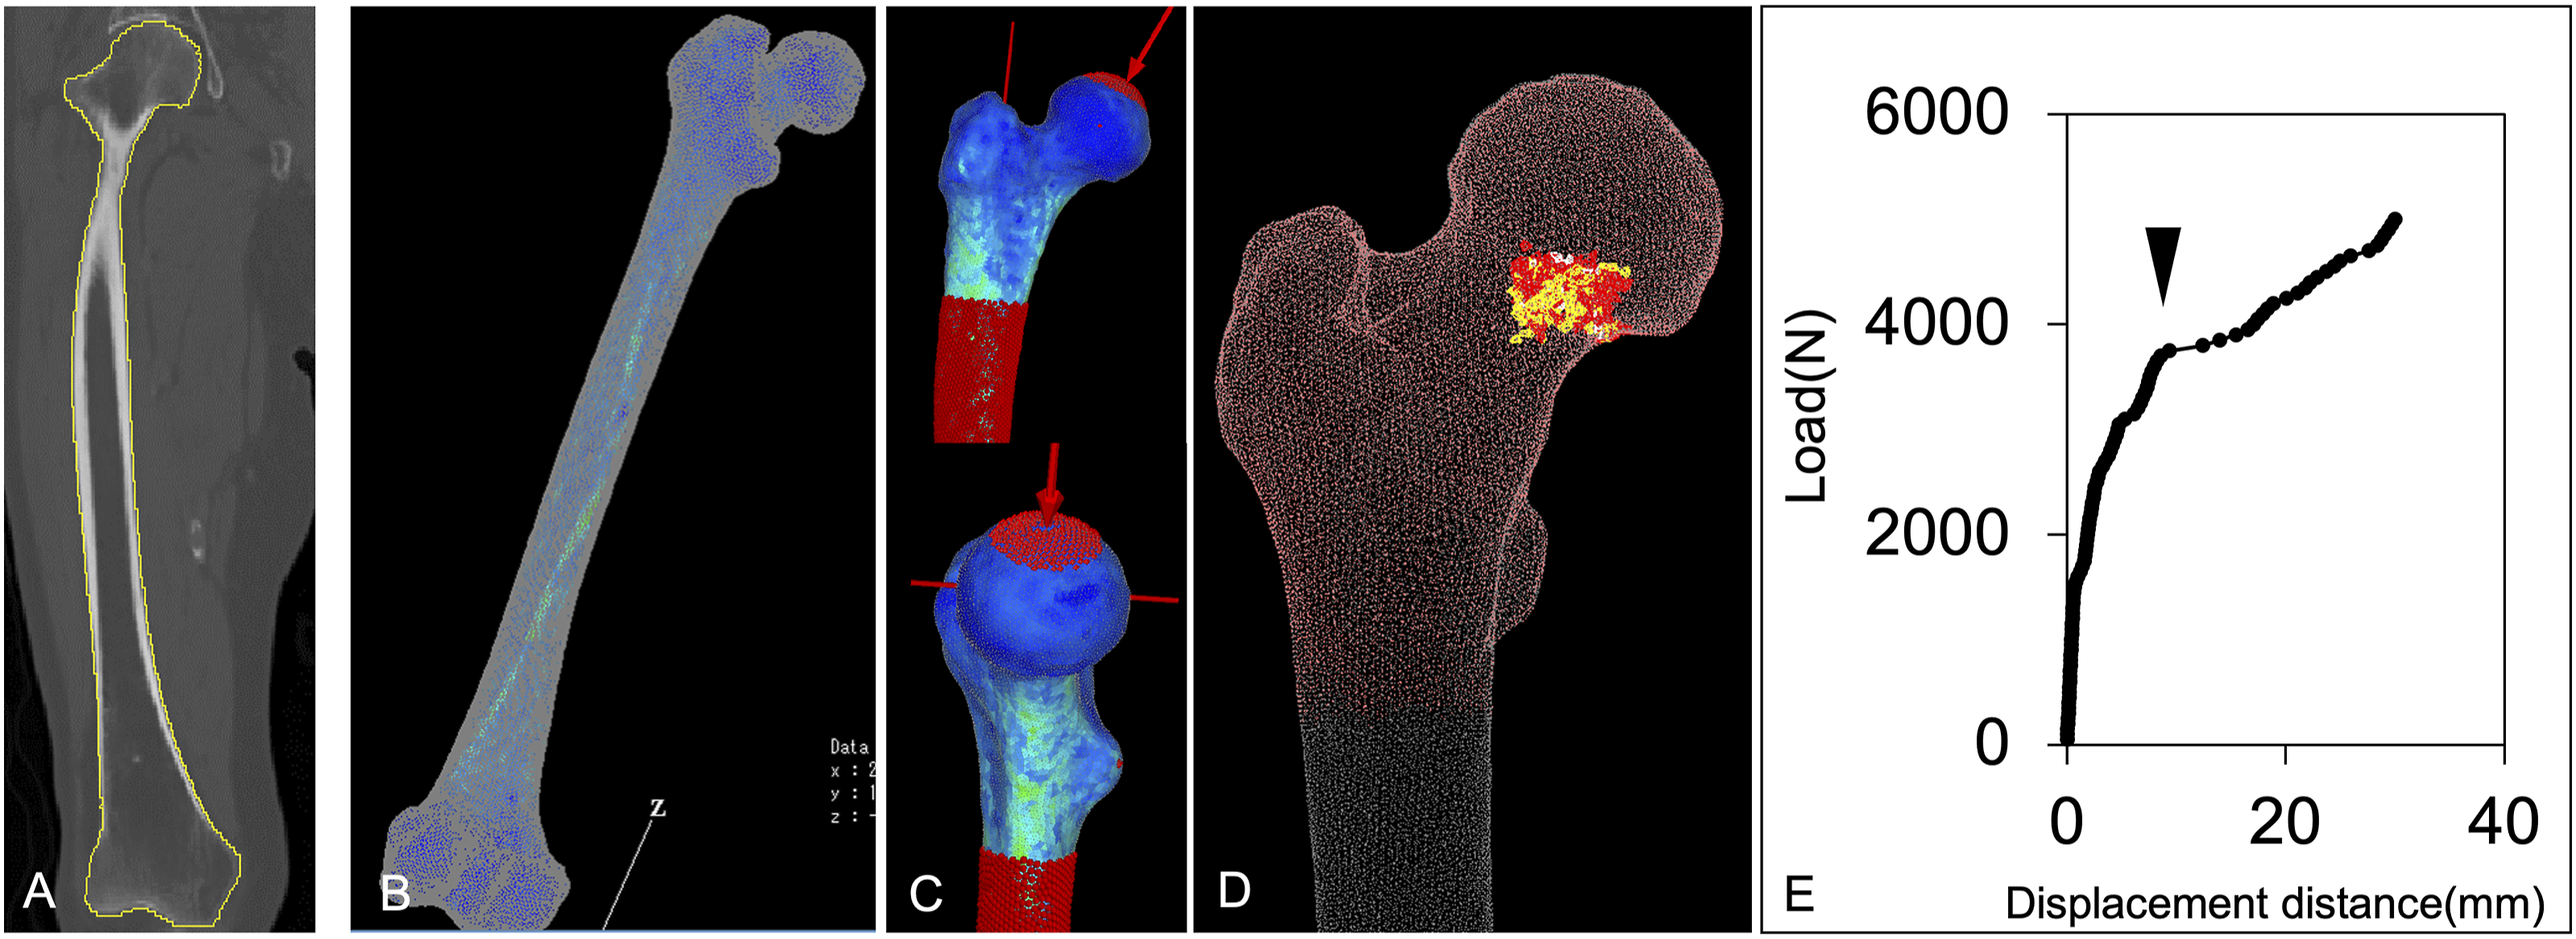
Muscle Volume and CT-Assessed Density Measurement
Muscle volume and CT-assessed density were measured using the freely available software 3D Slicer®□ version5.6.2 (https://www.slicer.org).
6
Using a similar method, our previous study reported intra-observer and inter-observer reliability for 3D measurements of gluteus medius muscle volume at 0.998 (95% CI, 0.996-0.999) and 0.948 (95% CI, 0.887-0.977), respectively.
10
In each patient, we identified seven muscles (rectus abdominis, iliacus, psoas major, gluteus maximus, gluteus medius, gluteus minimus, and rectus femoris) of the unaffected side on the preoperative CT scans (Figure 2A). The three-dimensional volume of each muscle was calculated in a freehand-drawn manner by tracking the margins of each muscle (Figure 2B).
10
The whole muscle was carefully detected by excluding the surrounding fat or connective tissue and partial volume artifacts (Figure 2C). The software reconstructed each muscle, providing output data, including the volume and CT-assessed density of each muscle. Muscle volumes were divided by height to adjust for individual physique differences. The CT-assessed density was corrected using a calibration phantom to compare each patient. The value obtained by multiplying the volume (mm3) with the CT-assessed density (HU) was defined as the mass value (HU × mm3). Three-Dimensional Analysis of Muscles Around Hip Joints. (A-C) Muscle Volume and CT-Assessed Density of the Rectus Abdominis, Iliacus, Psoas Major, Gluteus Maximus, Gluteus Medius, Gluteus Minimus, and Rectus Femoris were Calculated in a Freehand-Draw Fashion by Tracking the Margins of Each Muscle Using Slicer Free Software of 3D Slicer.
Statistics
Patient backgrounds, muscle volume, CT-assessed density, mass value, bone strength, and serum nutritional data were compared between the FNF and HOA groups, and the statistical significance of differences was determined using Student’s t-test (two-tailed). Pearson correlation coefficients were calculated for muscle volume, CT-assessed density, and mass with respect to age, body weight, body mass index (BMI), femoral strength, TP, and Alb. The association of muscle volume and CT-assessed density with walking ability was investigated using a one-way analysis of variance followed by Bonferroni’s test. Statistical significance was set at P < .05.
Results
Comparison of Demographic, CT Analysis for Muscles, and Femoral Strength Between FNF and Hip OA Patients
Difference of Demographic Data Between Patients With Femoral Neck Fracture and Those With Hip Osteoarthritis.

Mean value (Standard deviation).
FNF: femoral neck fracture, HOA: hip osteoarthritis, BMI, body mass index.
aIndicates a significant correlation (P < .05).

Comparison of the Muscle Mass Value Between the Femoral Neck Fracture (FNF) and Unilateral Hip Osteoarthritis (HOA) Groups. (A-G) Computed Tomography (CT) Measurement of the Muscle Mass Value that was Calculated by Multiplying Muscle Volume and CT-Assessed Density is Significantly Lower in the FNF Group than that in the HOA Group. P-value were Derived from Two-Tailed Student t-test. Bars Denotes Mean and Standard Deviation.
Difference of Demographic Data Between Male or Female Patients With Femoral Neck Fracture and Those With Hip Osteoarthritis.

Mean value (Standard deviation).
FNF: femoral neck fracture, HOA: hip osteoarthritis.
aIndicates a significant correlation (P < .05).
The average femoral strength was significantly lower in the FNF group than in the HOA group (2571 vs 3604 N, P = 0.022; Figure 4A). In males, the average femoral strength was significantly lower in the FNF group than in the HOA group (3100 vs 4810 N, P = 0.019) but was not significantly different in females (2200 vs 2760 N, N.S., Figure 4B). The walking ability in the FNF group was wheelchair in 4 patients (level 2), walking with a circle in 2 patients (level 3), and walking with a cane in 9 patients (level 4) at 6 months after surgery (Figure 5). Comparison of Femoral Strength. Average Femoral Strength Values were Significantly Lower in the femoral Neck Fracture Group than in the Osteoarthritis Group (A), Especially in Male Patients (B). P-value were Derived from Two-Tailed Student t-test. Bars Denotes Mean and Standard Deviation. Pre- and Postoperative Walking Ability. The Walking Ability in the Femoral Neck Fracture Group was Assessed Pre- and Postoperatively (the Time of Discharge and 6 months After Surgery) from Level 1 to 5. 6 months After Surgery, Walking Ability was Wheelchair in 4 Patients (Level 2), Walking with a Circle in 2 Patients (Level 3), and Walking with a Cane in 9 Patients (level 4).

2 Correlation of CT Analysis for Muscles and Other Data
Correlation of Muscle Volumes With Patient Background and Femoral Fracture Load.

BMI, body mass index; Op, operative; FNF, femoral neck fracture; CT, computed tomography.
aindicates a strong to moderate correlation in the Pearson correlation coefficient.
Discussion
As the population ages, the incidence of FNF continues to rise.1,2,15 Owing to the reduced bone strength in FNF patients, addressing bone fragility is essential to prevent subsequent fractures or injuries in other locations. Although treatment interventions for osteoporosis are crucial for preventing a cascade of fractures, studies that directly measure bone strength in patients with FNF are scarce. 16 In this study, we quantified the bone strength of patients with FNF using FE models based on CT data from the contralateral femur. This method is advantageous because it allows for the assessment of femoral strength under clinically realistic conditions. Our findings demonstrated that bone strength, as measured using FE models, was significantly lower in patients with FNF than in age-matched patients with HOA. Interestingly, this study also suggests that male patients with FNF exhibit reduced bone strength compared to female ones. Although men generally have a higher BMD and a lower risk of fracture than women, some men still exhibited lower bone strength, predisposing them to FNF. Therefore, employing FE models based on femoral CT data, as demonstrated in this study, may be particularly useful for evaluating the fracture risk in these patients.
Muscle strength has been extensively evaluated in accordance with the diagnostic criteria for sarcopenia3,4; however, few studies have comprehensively assessed the three-dimensional volume and quality of muscles in patients with FNF. Therefore, in this study, we quantitatively evaluated the musculature surrounding the hip joint by measuring muscle volume and CT-assessed density using the 3D Slicer® software with preoperative CT data. Our analysis revealed significantly lower CT-assessed density in patients with FNF, which correlated with their nutritional status, indicating muscle atrophy associated with sarcopenia. 17 Interestingly, muscle volume correlated with the patient’s musculoskeletal structure rather than their nutritional status. This finding indicates that muscle volume and CT-assessed density provide distinct insights into the patient’s condition. In patients with FNF, muscle atrophic changes and walking disabilities are better represented by CT-assessed density, whereas muscle volume is more influenced by skeletal structure. As CT-assessed density represents the penetrability of radiation, a low CT-assessed density in muscles implies fatty infiltration or muscle fiber degradation consistent with muscle atrophy.10,18 In fact, patients with low preoperative CT-assessed density in the target muscles of the unaffected hip tend to have lower postoperative walking ability, suggesting that preoperative assessment of CT-assessed density in periprosthetic muscles can serve as a predictive indicator of postoperative walking ability. Calibration with a phantom also enables quantitative comparisons of the CT-assessed density among patients.
In patients with FNF, the most concerning postoperative complication is a decline in walking ability. 19 Walking ability requires more muscle strength than bone strength, and accurately assessing muscle mass and quality in patients with FNF can facilitate the implementation of tailored rehabilitation programs.7,12,13,20 Therefore, this study aimed to evaluate the various muscles around the hip joint that are crucial for walking. Our findings suggest that a decrease in preoperative muscle CT-assessed density correlates with both preoperative and postoperative walking impairment. This suggests that preoperative CT can be a valuable predictor for walking ability in patients with FNF. Among the muscles examined, the outer muscles, such as the iliacus and gluteus maximus, which have significant mass and contraction ranges, showed reduced volume in patients with FNF. This reduction correlated with postoperative walking ability. In contrast, the muscle volumes associated with smaller contraction ranges, such as the rectus abdominis and gluteus medius/minimus, experienced minimal reduction and demonstrated no correlation with walking ability.
CT-assessed density was significantly reduced across all muscles in patients with FNF, suggesting a decline in muscle quality. This reduction was particularly notable in female patients (Table 3), showing a significant association with malnutrition (Table 3). Thus, the presence of sarcopenia in patients with FNF is more sensitive to muscle density than to muscle volume. Quantitative evaluation of muscle volume adjusted for height revealed a strong correlation among bone strength, weight, and BMI. This implies that the habitual mechanical loading of skeletal muscles is essential for bone strength and muscle volume development. In individuals with low body weight, there is a likelihood of progressive loss of bone strength over time, underscoring the importance of monitoring both bone strength and muscle volume in patients with lightweight FNF. Our data demonstrated that muscle weakness existed in patients with FNF, even before the fracture occurred, including on the unaffected side. This is consistent with previous reports12-14 and suggests that rehabilitation approaches such as neurological rehabilitation, 21 post-traumatic rehabilitation, 22 and other interventions beneficial for FNF patients may need to be initiated early after fracture surgery to prevent disuse-related impairments. Therefore, early screening for muscle weakness and osteoporosis is crucial for individuals at risk of FNF in our aging society.
Our current study is a retrospective analysis in which the unaffected side of HOA was used as a control. However, if rapid analysis becomes feasible, prospective validation across various cases will be possible, ultimately facilitating its application in clinical practice. One limitation of this study is the small sample size of FNF patients, as it is a pilot study and therefore a power analysis was not conducted, along with the absence of a healthy control group. Nevertheless, despite the limited number of cases, significant differences in muscle volume, quality, and mass were observed compared to age-matched patients with HOA, highlighting the presence of preoperative muscle atrophy in FNF patients. Another limitation is that our measurements were based on morphological assessments derived from CT data rather than direct measures of muscle strength. However, previous studies have demonstrated a strong correlation between CT-derived parameters and muscle strength in HOA patients, supporting the use of muscle volume, CT-assessed density, and mass as surrogate markers for muscle strength in FNF patients, particularly when direct measurement is challenging in clinical settings. 10 These parameters were significantly correlated with postoperative walking ability, suggesting that CT-based analysis is valuable for evaluating and predicting muscle strength and functional outcomes in FNF patients. This finding underscores the utility of CT imaging in this patient population, which primarily consists of older adults. Although most of our CT analyses were conducted manually, requiring considerable time per patient, recent advancements in imaging technology have facilitated automation. The integration of such technologies enables rapid muscle assessment following CT imaging, streamlining clinical evaluation and enhancing patient management.
Conclusion
In patients with FNF, both hip and trunk muscle volumes, as well as CT-assessed density, were significantly lower compared to age-matched patients with HOA. Muscle volume and CT-assessed density were significantly correlated with femoral bone strength, serum TP levels, and pre- and postoperative walking abilities. These findings suggest that muscle CT analysis around the hip joint may serve as a valuable tool for assessing musculoskeletal status in patients with FNF.
ORCID iD
Hyonmin Choe https://orcid.org/0000-0003-4432-2303
Statements and declarations
Ethical considerations
This study was approved by our institutional review board (F241000003).
Consent to participate and for publication
Consent to participate and for publication was obtained by the opt-out information in the homepage of our hospital
Footnotes
Author contributions
Conceptualization, H.C. and M.O.; methodology, H.C., T.Y., M.O. and K.A..; investigation, H.C. and T.Y.; writing—original draft preparation, H.C., K.A., H.I., K.K., N.K., and Y.I.; writing—review and editing, H.C.and K.A.; supervision, H.C. All authors have read and agreed to the published version of the manuscript.
Funding
The authors received no financial support for the research, authorship, and/or publication of this article.
Conflicting Interests
The authors declared no potential conflicts of interest with respect to the research, authorship, and/or publication of this article.
Data Availability Statement
Data can available upon reasonable requirement to the corresponding author.